(primary solid tumor cohort)
This pipeline uses various statistical tests to identify mRNAs whose expression levels correlated to selected clinical features.
Testing the association between 18295 genes and 8 clinical features across 480 samples, statistically thresholded by Q value < 0.05, 7 clinical features related to at least one genes.
-
2315 genes correlated to 'Time to Death'.
-
ANKRD56|345079 , B3GNTL1|146712 , COL7A1|1294 , DONSON|29980 , ADAMTS14|140766 , ...
-
19 genes correlated to 'AGE'.
-
RANBP17|64901 , RFPL1S|10740 , WFDC1|58189 , UTY|7404 , PALLD|23022 , ...
-
216 genes correlated to 'GENDER'.
-
XIST|7503 , PRKY|5616 , NLGN4Y|22829 , RPS4Y1|6192 , TSIX|9383 , ...
-
2625 genes correlated to 'PATHOLOGY.T'.
-
NR3C2|4306 , FKBP11|51303 , TMEM150C|441027 , FAM122A|116224 , PLEKHA9|51054 , ...
-
5 genes correlated to 'PATHOLOGY.N'.
-
C11ORF34|349633 , PITX2|5308 , ATP6V1D|51382 , HEMGN|55363 , TMEM104|54868
-
317 genes correlated to 'PATHOLOGICSPREAD(M)'.
-
GARNL3|84253 , IL20RB|53833 , PLEKHA9|51054 , C22ORF9|23313 , BIRC5|332 , ...
-
3057 genes correlated to 'TUMOR.STAGE'.
-
PLEKHA9|51054 , NR3C2|4306 , FKBP11|51303 , FAM122A|116224 , NOP2|4839 , ...
-
No genes correlated to 'KARNOFSKY.PERFORMANCE.SCORE'
Complete statistical result table is provided in Supplement Table 1
Table 1. Get Full Table This table shows the clinical features, statistical methods used, and the number of genes that are significantly associated with each clinical feature at Q value < 0.05.
| Clinical feature | Statistical test | Significant genes | Associated with | Associated with | ||
|---|---|---|---|---|---|---|
| Time to Death | Cox regression test | N=2315 | shorter survival | N=1496 | longer survival | N=819 |
| AGE | Spearman correlation test | N=19 | older | N=3 | younger | N=16 |
| GENDER | t test | N=216 | male | N=134 | female | N=82 |
| KARNOFSKY PERFORMANCE SCORE | Spearman correlation test | N=0 | ||||
| PATHOLOGY T | Spearman correlation test | N=2625 | higher pT | N=1420 | lower pT | N=1205 |
| PATHOLOGY N | t test | N=5 | n1 | N=2 | n0 | N=3 |
| PATHOLOGICSPREAD(M) | t test | N=317 | m1 | N=264 | m0 | N=53 |
| TUMOR STAGE | Spearman correlation test | N=3057 | higher stage | N=1674 | lower stage | N=1383 |
Table S1. Basic characteristics of clinical feature: 'Time to Death'
| Time to Death | Duration (Months) | 0.1-111 (median=34.3) |
| censored | N = 323 | |
| death | N = 154 | |
| Significant markers | N = 2315 | |
| associated with shorter survival | 1496 | |
| associated with longer survival | 819 |
Table S2. Get Full Table List of top 10 genes significantly associated with 'Time to Death' by Cox regression test
| HazardRatio | Wald_P | Q | C_index | |
|---|---|---|---|---|
| ANKRD56|345079 | 0.71 | 0 | 0 | 0.319 |
| B3GNTL1|146712 | 2.4 | 0 | 0 | 0.684 |
| COL7A1|1294 | 1.32 | 0 | 0 | 0.676 |
| DONSON|29980 | 2.7 | 0 | 0 | 0.686 |
| ADAMTS14|140766 | 1.44 | 1.11e-16 | 2e-12 | 0.684 |
| SLC16A12|387700 | 0.78 | 1.11e-16 | 2e-12 | 0.311 |
| NUMBL|9253 | 1.85 | 2.22e-16 | 4.1e-12 | 0.687 |
| ANAPC7|51434 | 5.8 | 3.331e-16 | 6.1e-12 | 0.677 |
| STX1A|6804 | 1.73 | 3.331e-16 | 6.1e-12 | 0.678 |
| RGS17|26575 | 1.43 | 4.441e-16 | 8.1e-12 | 0.666 |
Figure S1. Get High-res Image As an example, this figure shows the association of ANKRD56|345079 to 'Time to Death'. four curves present the cumulative survival rates of 4 quartile subsets of patients. P value = 0 with univariate Cox regression analysis using continuous log-2 expression values.
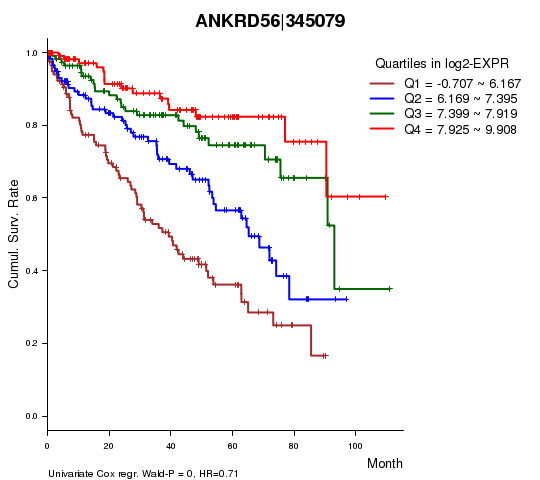
Table S3. Basic characteristics of clinical feature: 'AGE'
| AGE | Mean (SD) | 60.58 (12) |
| Significant markers | N = 19 | |
| pos. correlated | 3 | |
| neg. correlated | 16 |
Table S4. Get Full Table List of top 10 genes significantly correlated to 'AGE' by Spearman correlation test
| SpearmanCorr | corrP | Q | |
|---|---|---|---|
| RANBP17|64901 | -0.2556 | 1.392e-08 | 0.000255 |
| RFPL1S|10740 | -0.2559 | 1.702e-08 | 0.000311 |
| WFDC1|58189 | -0.2476 | 3.998e-08 | 0.000731 |
| UTY|7404 | -0.2758 | 1.044e-07 | 0.00191 |
| PALLD|23022 | -0.2349 | 1.983e-07 | 0.00363 |
| NEFH|4744 | -0.2324 | 2.701e-07 | 0.00494 |
| DIO2|1734 | -0.2285 | 4.416e-07 | 0.00808 |
| FNDC1|84624 | -0.2249 | 6.595e-07 | 0.0121 |
| ZNF610|162963 | -0.2249 | 6.608e-07 | 0.0121 |
| KDM5D|8284 | -0.248 | 8.594e-07 | 0.0157 |
Figure S2. Get High-res Image As an example, this figure shows the association of RANBP17|64901 to 'AGE'. P value = 1.39e-08 with Spearman correlation analysis. The straight line presents the best linear regression.
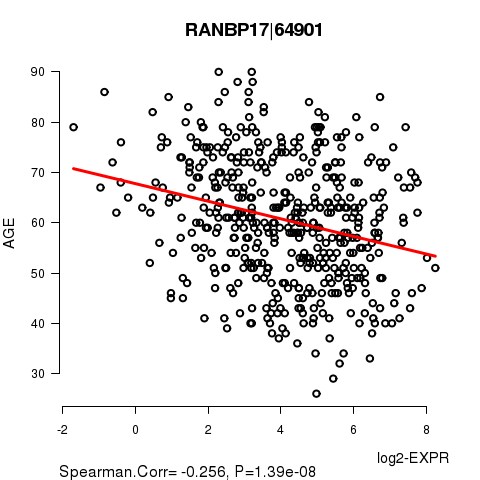
Table S5. Basic characteristics of clinical feature: 'GENDER'
| GENDER | Labels | N |
| FEMALE | 167 | |
| MALE | 313 | |
| Significant markers | N = 216 | |
| Higher in MALE | 134 | |
| Higher in FEMALE | 82 |
Table S6. Get Full Table List of top 10 genes differentially expressed by 'GENDER'
| T(pos if higher in 'MALE') | ttestP | Q | AUC | |
|---|---|---|---|---|
| XIST|7503 | -43.08 | 3.603e-160 | 6.59e-156 | 0.982 |
| PRKY|5616 | 37.98 | 1.52e-104 | 2.78e-100 | 0.9797 |
| NLGN4Y|22829 | 34.69 | 2.124e-76 | 3.89e-72 | 0.9752 |
| RPS4Y1|6192 | 35.02 | 2.133e-71 | 3.9e-67 | 0.9859 |
| TSIX|9383 | -23.71 | 3.977e-69 | 7.27e-65 | 0.9659 |
| ZFY|7544 | 34.73 | 1.837e-65 | 3.36e-61 | 0.9783 |
| DDX3Y|8653 | 30.27 | 1.611e-56 | 2.95e-52 | 0.9739 |
| KDM5C|8242 | -16.81 | 1.069e-48 | 1.96e-44 | 0.8949 |
| NCRNA00183|554203 | -16.02 | 1.752e-43 | 3.2e-39 | 0.8608 |
| KDM5D|8284 | 24.55 | 1.134e-38 | 2.07e-34 | 0.9708 |
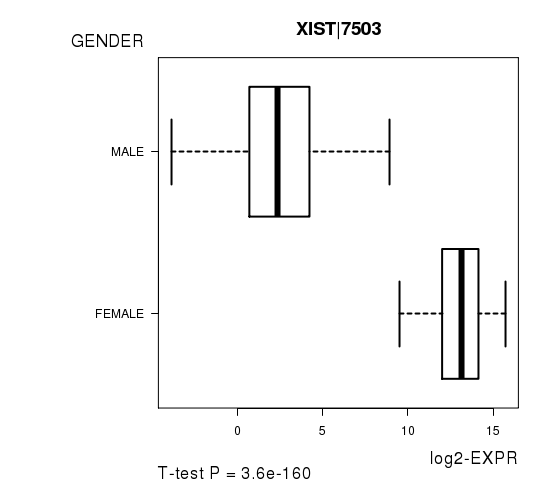
Figure S3. Get High-res Image As an example, this figure shows the association of XIST|7503 to 'GENDER'. P value = 3.6e-160 with T-test analysis.
No gene related to 'KARNOFSKY.PERFORMANCE.SCORE'.
Table S7. Basic characteristics of clinical feature: 'KARNOFSKY.PERFORMANCE.SCORE'
| KARNOFSKY.PERFORMANCE.SCORE | Mean (SD) | 90.88 (18) |
| Score | N | |
| 0 | 1 | |
| 70 | 1 | |
| 80 | 3 | |
| 90 | 12 | |
| 100 | 17 | |
| Significant markers | N = 0 |
Table S8. Basic characteristics of clinical feature: 'PATHOLOGY.T'
| PATHOLOGY.T | Mean (SD) | 1.91 (0.97) |
| N | ||
| T1 | 238 | |
| T2 | 60 | |
| T3 | 171 | |
| T4 | 11 | |
| Significant markers | N = 2625 | |
| pos. correlated | 1420 | |
| neg. correlated | 1205 |
Table S9. Get Full Table List of top 10 genes significantly correlated to 'PATHOLOGY.T' by Spearman correlation test
| SpearmanCorr | corrP | Q | |
|---|---|---|---|
| NR3C2|4306 | -0.4024 | 4.14e-20 | 7.57e-16 |
| FKBP11|51303 | 0.3887 | 9.19e-19 | 1.68e-14 |
| TMEM150C|441027 | -0.3833 | 3.014e-18 | 5.51e-14 |
| FAM122A|116224 | -0.3831 | 3.156e-18 | 5.77e-14 |
| PLEKHA9|51054 | 0.3798 | 6.4e-18 | 1.17e-13 |
| ZNF132|7691 | -0.3759 | 1.465e-17 | 2.68e-13 |
| ACADSB|36 | -0.3725 | 3.046e-17 | 5.57e-13 |
| PTPRB|5787 | -0.372 | 3.375e-17 | 6.17e-13 |
| FAM160A1|729830 | -0.3714 | 3.816e-17 | 6.98e-13 |
| ANKRD56|345079 | -0.3711 | 4.375e-17 | 8e-13 |
Figure S4. Get High-res Image As an example, this figure shows the association of NR3C2|4306 to 'PATHOLOGY.T'. P value = 4.14e-20 with Spearman correlation analysis.
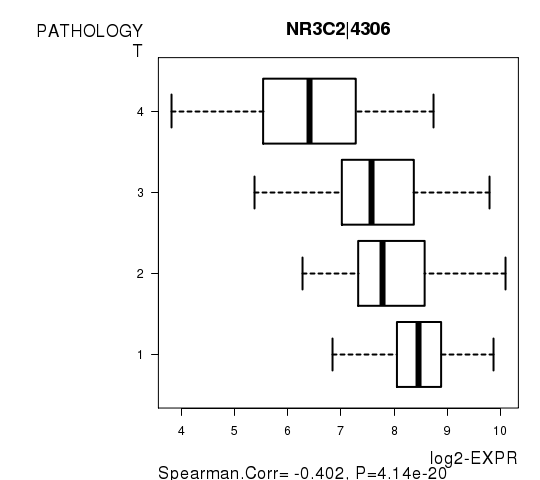
Table S10. Basic characteristics of clinical feature: 'PATHOLOGY.N'
| PATHOLOGY.N | Labels | N |
| N0 | 228 | |
| N1 | 17 | |
| Significant markers | N = 5 | |
| Higher in N1 | 2 | |
| Higher in N0 | 3 |
Table S11. Get Full Table List of 5 genes differentially expressed by 'PATHOLOGY.N'
| T(pos if higher in 'N1') | ttestP | Q | AUC | |
|---|---|---|---|---|
| C11ORF34|349633 | -7.72 | 5.065e-09 | 9.26e-05 | 0.719 |
| PITX2|5308 | 6.94 | 1.839e-07 | 0.00336 | 0.785 |
| ATP6V1D|51382 | -6.13 | 4.006e-07 | 0.00732 | 0.7495 |
| HEMGN|55363 | -5.93 | 8.15e-07 | 0.0149 | 0.7437 |
| TMEM104|54868 | 5.94 | 2.491e-06 | 0.0455 | 0.8055 |
Figure S5. Get High-res Image As an example, this figure shows the association of C11ORF34|349633 to 'PATHOLOGY.N'. P value = 5.07e-09 with T-test analysis.
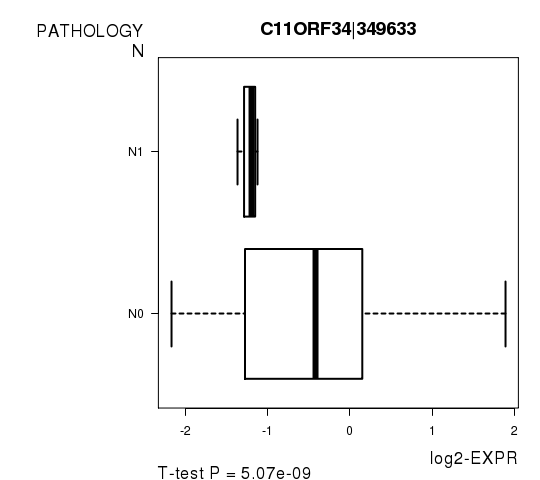
Table S12. Basic characteristics of clinical feature: 'PATHOLOGICSPREAD(M)'
| PATHOLOGICSPREAD(M) | Labels | N |
| M0 | 403 | |
| M1 | 77 | |
| Significant markers | N = 317 | |
| Higher in M1 | 264 | |
| Higher in M0 | 53 |
Table S13. Get Full Table List of top 10 genes differentially expressed by 'PATHOLOGICSPREAD(M)'
| T(pos if higher in 'M1') | ttestP | Q | AUC | |
|---|---|---|---|---|
| GARNL3|84253 | -6.98 | 2.078e-10 | 3.8e-06 | 0.7458 |
| IL20RB|53833 | 6.7 | 1.089e-09 | 1.99e-05 | 0.7308 |
| PLEKHA9|51054 | 6.68 | 1.135e-09 | 2.08e-05 | 0.7383 |
| C22ORF9|23313 | 6.61 | 1.462e-09 | 2.67e-05 | 0.735 |
| BIRC5|332 | 6.63 | 1.615e-09 | 2.95e-05 | 0.7295 |
| INHBE|83729 | 6.55 | 2.516e-09 | 4.6e-05 | 0.7275 |
| NFE2L3|9603 | 6.48 | 2.544e-09 | 4.65e-05 | 0.7237 |
| TYMP|1890 | 6.38 | 3.096e-09 | 5.66e-05 | 0.7102 |
| OIP5|11339 | 6.38 | 4.433e-09 | 8.11e-05 | 0.7251 |
| CENPA|1058 | 6.35 | 6.395e-09 | 0.000117 | 0.7237 |
Figure S6. Get High-res Image As an example, this figure shows the association of GARNL3|84253 to 'PATHOLOGICSPREAD(M)'. P value = 2.08e-10 with T-test analysis.
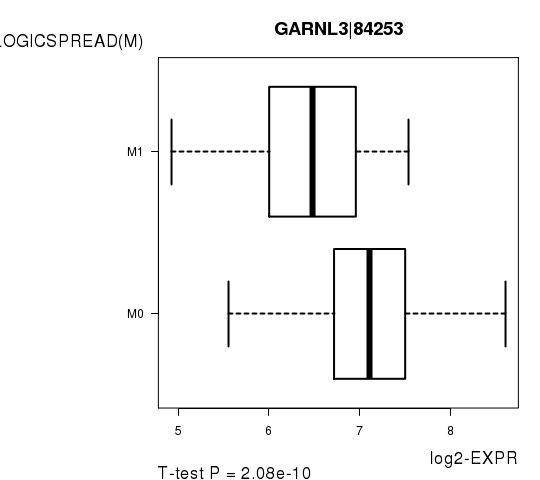
Table S14. Basic characteristics of clinical feature: 'TUMOR.STAGE'
| TUMOR.STAGE | Mean (SD) | 2.09 (1.2) |
| N | ||
| Stage 1 | 234 | |
| Stage 2 | 48 | |
| Stage 3 | 117 | |
| Stage 4 | 81 | |
| Significant markers | N = 3057 | |
| pos. correlated | 1674 | |
| neg. correlated | 1383 |
Table S15. Get Full Table List of top 10 genes significantly correlated to 'TUMOR.STAGE' by Spearman correlation test
| SpearmanCorr | corrP | Q | |
|---|---|---|---|
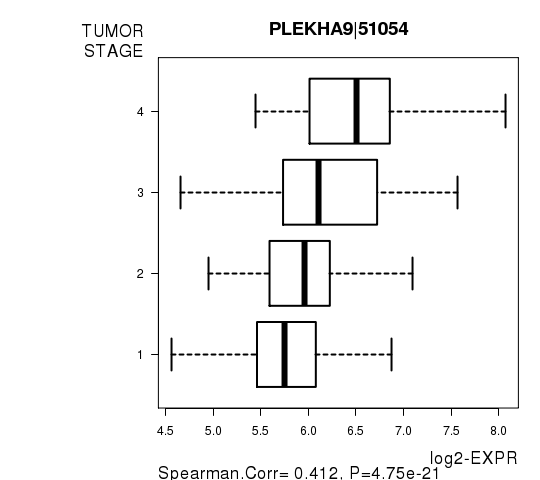
| PLEKHA9|51054 | 0.4116 | 4.754e-21 | 8.7e-17 |
| NR3C2|4306 | -0.4073 | 1.329e-20 | 2.43e-16 |
| FKBP11|51303 | 0.4063 | 1.655e-20 | 3.03e-16 |
| FAM122A|116224 | -0.3988 | 9.48e-20 | 1.73e-15 |
| NOP2|4839 | 0.3897 | 7.358e-19 | 1.35e-14 |
| TSPAN7|7102 | -0.3858 | 1.741e-18 | 3.18e-14 |
| ALDH6A1|4329 | -0.385 | 2.071e-18 | 3.79e-14 |
| ACADSB|36 | -0.382 | 4.016e-18 | 7.34e-14 |
| PTPRB|5787 | -0.3796 | 6.725e-18 | 1.23e-13 |
| FAM160A1|729830 | -0.379 | 7.664e-18 | 1.4e-13 |
Figure S7. Get High-res Image As an example, this figure shows the association of PLEKHA9|51054 to 'TUMOR.STAGE'. P value = 4.75e-21 with Spearman correlation analysis.
-
Expresson data file = KIRC-TP.uncv2.mRNAseq_RSEM_normalized_log2.txt
-
Clinical data file = KIRC-TP.clin.merged.picked.txt
-
Number of patients = 480
-
Number of genes = 18295
-
Number of clinical features = 8
For survival clinical features, Wald's test in univariate Cox regression analysis with proportional hazards model (Andersen and Gill 1982) was used to estimate the P values using the 'coxph' function in R. Kaplan-Meier survival curves were plot using the four quartile subgroups of patients based on expression levels
For continuous numerical clinical features, Spearman's rank correlation coefficients (Spearman 1904) and two-tailed P values were estimated using 'cor.test' function in R
For two-class clinical features, two-tailed Student's t test with unequal variance (Lehmann and Romano 2005) was applied to compare the log2-expression levels between the two clinical classes using 't.test' function in R
For multiple hypothesis correction, Q value is the False Discovery Rate (FDR) analogue of the P value (Benjamini and Hochberg 1995), defined as the minimum FDR at which the test may be called significant. We used the 'Benjamini and Hochberg' method of 'p.adjust' function in R to convert P values into Q values.
This is an experimental feature. The full results of the analysis summarized in this report can be downloaded from the TCGA Data Coordination Center.