(primary solid tumor cohort)
This pipeline uses various statistical tests to identify genes whose promoter methylation levels correlated to selected clinical features.
Testing the association between 17337 genes and 8 clinical features across 272 samples, statistically thresholded by Q value < 0.05, 7 clinical features related to at least one genes.
-
480 genes correlated to 'Time to Death'.
-
FLJ42289 , TLL2 , RIOK3 , RPRD2 , ARHGEF12 , ...
-
15 genes correlated to 'AGE'.
-
ELOVL2 , ME3 , MRPS33 , DOK6 , TSPYL5 , ...
-
69 genes correlated to 'GENDER'.
-
UTP14C , KIF4B , CCDC146 , UQCRH , CAV2 , ...
-
808 genes correlated to 'PATHOLOGY.T'.
-
KDR , CLEC2L , OPRK1 , ACTA1 , SYN2 , ...
-
9 genes correlated to 'PATHOLOGY.N'.
-
CARD16 , CASP1 , SFXN5 , VGF , ZFP64 , ...
-
68 genes correlated to 'PATHOLOGICSPREAD(M)'.
-
C20ORF112 , OPRK1 , HTR6 , PLCD1 , NBLA00301 , ...
-
884 genes correlated to 'TUMOR.STAGE'.
-
KDR , UTF1 , LOC645323 , OPRK1 , CLEC2L , ...
-
No genes correlated to 'KARNOFSKY.PERFORMANCE.SCORE'
Complete statistical result table is provided in Supplement Table 1
Table 1. Get Full Table This table shows the clinical features, statistical methods used, and the number of genes that are significantly associated with each clinical feature at Q value < 0.05.
| Clinical feature | Statistical test | Significant genes | Associated with | Associated with | ||
|---|---|---|---|---|---|---|
| Time to Death | Cox regression test | N=480 | shorter survival | N=293 | longer survival | N=187 |
| AGE | Spearman correlation test | N=15 | older | N=12 | younger | N=3 |
| GENDER | t test | N=69 | male | N=7 | female | N=62 |
| KARNOFSKY PERFORMANCE SCORE | Spearman correlation test | N=0 | ||||
| PATHOLOGY T | Spearman correlation test | N=808 | higher pT | N=399 | lower pT | N=409 |
| PATHOLOGY N | t test | N=9 | n1 | N=2 | n0 | N=7 |
| PATHOLOGICSPREAD(M) | t test | N=68 | m1 | N=62 | m0 | N=6 |
| TUMOR STAGE | Spearman correlation test | N=884 | higher stage | N=559 | lower stage | N=325 |
Table S1. Basic characteristics of clinical feature: 'Time to Death'
| Time to Death | Duration (Months) | 0.1-109.6 (median=27.9) |
| censored | N = 177 | |
| death | N = 92 | |
| Significant markers | N = 480 | |
| associated with shorter survival | 293 | |
| associated with longer survival | 187 |
Table S2. Get Full Table List of top 10 genes significantly associated with 'Time to Death' by Cox regression test
| HazardRatio | Wald_P | Q | C_index | |
|---|---|---|---|---|
| FLJ42289 | 0.03 | 1.837e-12 | 3.2e-08 | 0.304 |
| TLL2 | 0.02 | 4.808e-12 | 8.3e-08 | 0.314 |
| RIOK3 | 7501 | 1.987e-11 | 3.4e-07 | 0.668 |
| RPRD2 | 54 | 2.331e-11 | 4e-07 | 0.681 |
| ARHGEF12 | 44 | 2.398e-11 | 4.2e-07 | 0.642 |
| GRIN2D | 0 | 3.355e-11 | 5.8e-07 | 0.32 |
| IGLL1 | 0.01 | 7.656e-11 | 1.3e-06 | 0.311 |
| MBNL2 | 28 | 1.233e-10 | 2.1e-06 | 0.672 |
| PLCB3 | 0 | 1.283e-10 | 2.2e-06 | 0.379 |
| PCCA | 51 | 1.561e-10 | 2.7e-06 | 0.66 |
Figure S1. Get High-res Image As an example, this figure shows the association of FLJ42289 to 'Time to Death'. four curves present the cumulative survival rates of 4 quartile subsets of patients. P value = 1.84e-12 with univariate Cox regression analysis using continuous log-2 expression values.
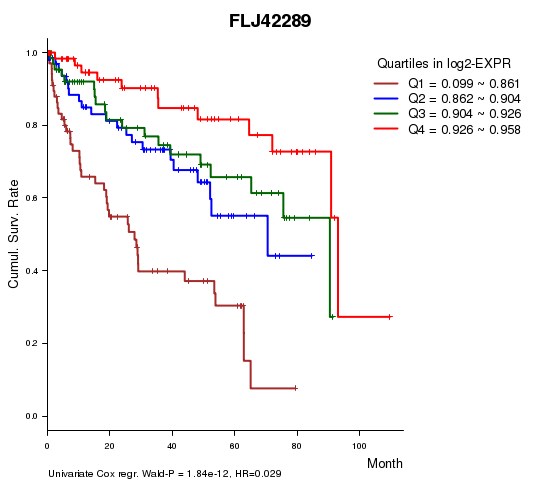
Table S3. Basic characteristics of clinical feature: 'AGE'
| AGE | Mean (SD) | 61.34 (12) |
| Significant markers | N = 15 | |
| pos. correlated | 12 | |
| neg. correlated | 3 |
Table S4. Get Full Table List of top 10 genes significantly correlated to 'AGE' by Spearman correlation test
| SpearmanCorr | corrP | Q | |
|---|---|---|---|
| ELOVL2 | 0.4681 | 3.221e-16 | 5.58e-12 |
| ME3 | -0.3185 | 7.937e-08 | 0.00138 |
| MRPS33 | 0.3184 | 7.954e-08 | 0.00138 |
| DOK6 | 0.3171 | 9.071e-08 | 0.00157 |
| TSPYL5 | 0.3157 | 1.041e-07 | 0.0018 |
| ADAMTS17 | 0.3108 | 1.67e-07 | 0.00289 |
| RANBP17 | 0.3048 | 2.966e-07 | 0.00514 |
| ZYG11A | 0.3047 | 2.99e-07 | 0.00518 |
| PVT1 | -0.3018 | 3.907e-07 | 0.00677 |
| LYSMD2 | -0.2976 | 5.769e-07 | 0.01 |
Figure S2. Get High-res Image As an example, this figure shows the association of ELOVL2 to 'AGE'. P value = 3.22e-16 with Spearman correlation analysis. The straight line presents the best linear regression.
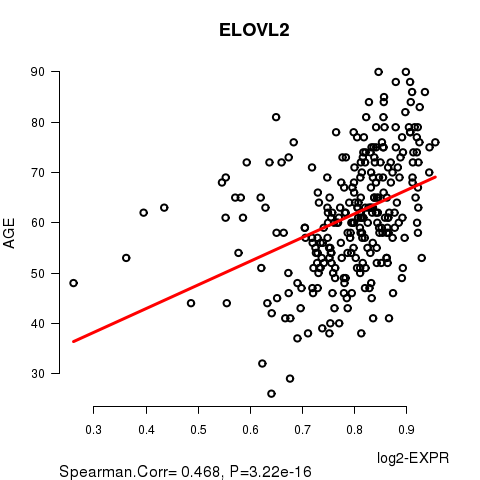
Table S5. Basic characteristics of clinical feature: 'GENDER'
| GENDER | Labels | N |
| FEMALE | 93 | |
| MALE | 179 | |
| Significant markers | N = 69 | |
| Higher in MALE | 7 | |
| Higher in FEMALE | 62 |
Table S6. Get Full Table List of top 10 genes differentially expressed by 'GENDER'
| T(pos if higher in 'MALE') | ttestP | Q | AUC | |
|---|---|---|---|---|
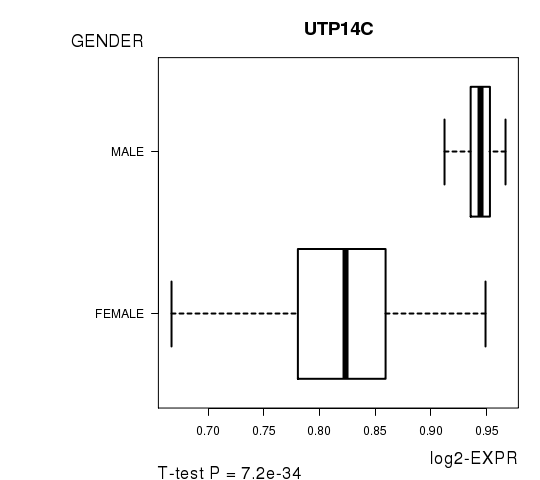
| UTP14C | 17.67 | 7.204e-34 | 1.25e-29 | 0.9717 |
| KIF4B | -11.84 | 5.539e-25 | 9.6e-21 | 0.8806 |
| CCDC146 | -10.57 | 5.83e-22 | 1.01e-17 | 0.8016 |
| UQCRH | 10.04 | 1.417e-19 | 2.46e-15 | 0.7614 |
| CAV2 | -9.94 | 1.455e-19 | 2.52e-15 | 0.8024 |
| DNAJB13 | -9.66 | 4.784e-19 | 8.29e-15 | 0.7821 |
| C5ORF27 | -9.64 | 2.049e-18 | 3.55e-14 | 0.8035 |
| TLE1 | -9.45 | 3.198e-17 | 5.54e-13 | 0.8072 |
| NICN1 | -9.2 | 5.664e-17 | 9.82e-13 | 0.8059 |
| COX7C | -8.77 | 8.392e-15 | 1.45e-10 | 0.809 |
Figure S3. Get High-res Image As an example, this figure shows the association of UTP14C to 'GENDER'. P value = 7.2e-34 with T-test analysis.
No gene related to 'KARNOFSKY.PERFORMANCE.SCORE'.
Table S7. Basic characteristics of clinical feature: 'KARNOFSKY.PERFORMANCE.SCORE'
| KARNOFSKY.PERFORMANCE.SCORE | Mean (SD) | 92.59 (8.1) |
| Score | N | |
| 70 | 1 | |
| 80 | 3 | |
| 90 | 11 | |
| 100 | 12 | |
| Significant markers | N = 0 |
Table S8. Basic characteristics of clinical feature: 'PATHOLOGY.T'
| PATHOLOGY.T | Mean (SD) | 1.96 (0.98) |
| N | ||
| T1 | 128 | |
| T2 | 34 | |
| T3 | 102 | |
| T4 | 8 | |
| Significant markers | N = 808 | |
| pos. correlated | 399 | |
| neg. correlated | 409 |
Table S9. Get Full Table List of top 10 genes significantly correlated to 'PATHOLOGY.T' by Spearman correlation test
| SpearmanCorr | corrP | Q | |
|---|---|---|---|
| KDR | 0.5042 | 6.031e-19 | 1.05e-14 |
| CLEC2L | 0.4782 | 6.046e-17 | 1.05e-12 |
| OPRK1 | 0.4675 | 3.548e-16 | 6.15e-12 |
| ACTA1 | 0.4589 | 1.436e-15 | 2.49e-11 |
| SYN2 | 0.4447 | 1.292e-14 | 2.24e-10 |
| NEUROD2 | 0.4434 | 1.581e-14 | 2.74e-10 |
| AVPR1A | 0.4427 | 1.759e-14 | 3.05e-10 |
| UTF1 | 0.4407 | 2.363e-14 | 4.1e-10 |
| LOC645323 | 0.4489 | 2.413e-14 | 4.18e-10 |
| SLC35F1 | 0.4393 | 2.929e-14 | 5.08e-10 |
Figure S4. Get High-res Image As an example, this figure shows the association of KDR to 'PATHOLOGY.T'. P value = 6.03e-19 with Spearman correlation analysis.
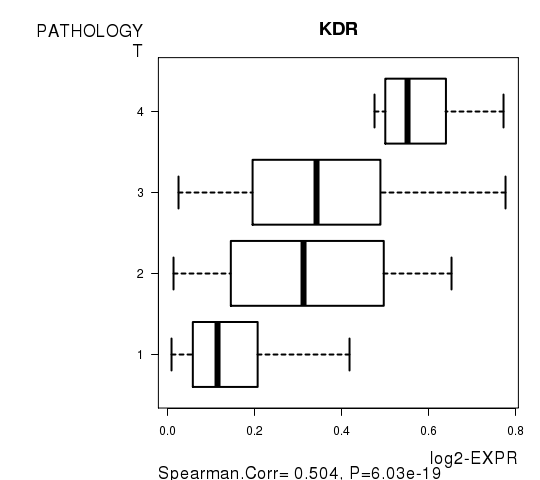
Table S10. Basic characteristics of clinical feature: 'PATHOLOGY.N'
| PATHOLOGY.N | Labels | N |
| N0 | 122 | |
| N1 | 9 | |
| Significant markers | N = 9 | |
| Higher in N1 | 2 | |
| Higher in N0 | 7 |
Table S11. Get Full Table List of 9 genes differentially expressed by 'PATHOLOGY.N'
| T(pos if higher in 'N1') | ttestP | Q | AUC | |
|---|---|---|---|---|
| CARD16 | -6.43 | 6.705e-09 | 0.000116 | 0.6648 |
| CASP1 | -6.43 | 6.705e-09 | 0.000116 | 0.6648 |
| SFXN5 | -6.15 | 4.185e-07 | 0.00725 | 0.7049 |
| VGF | -5.23 | 6.713e-07 | 0.0116 | 0.6594 |
| ZFP64 | -5.25 | 6.953e-07 | 0.0121 | 0.6266 |
| CYP27C1 | 5.19 | 1.082e-06 | 0.0188 | 0.6803 |
| TSPO | -5.37 | 1.108e-06 | 0.0192 | 0.6266 |
| PLAG1 | -4.97 | 2.112e-06 | 0.0366 | 0.7696 |
| LOC150568 | 5.4 | 2.289e-06 | 0.0397 | 0.742 |
Figure S5. Get High-res Image As an example, this figure shows the association of CARD16 to 'PATHOLOGY.N'. P value = 6.71e-09 with T-test analysis.
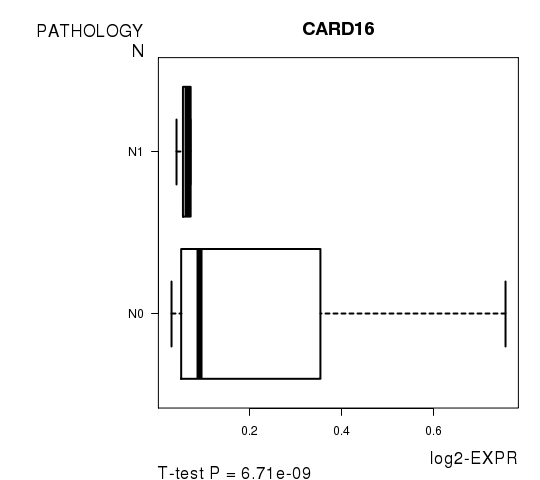
Table S12. Basic characteristics of clinical feature: 'PATHOLOGICSPREAD(M)'
| PATHOLOGICSPREAD(M) | Labels | N |
| M0 | 221 | |
| M1 | 51 | |
| Significant markers | N = 68 | |
| Higher in M1 | 62 | |
| Higher in M0 | 6 |
Table S13. Get Full Table List of top 10 genes differentially expressed by 'PATHOLOGICSPREAD(M)'
| T(pos if higher in 'M1') | ttestP | Q | AUC | |
|---|---|---|---|---|
| C20ORF112 | 7.56 | 3.47e-12 | 6.02e-08 | 0.7674 |
| OPRK1 | 7.56 | 2.711e-11 | 4.7e-07 | 0.769 |
| HTR6 | 7.33 | 1.327e-10 | 2.3e-06 | 0.773 |
| PLCD1 | 6.64 | 3.601e-10 | 6.24e-06 | 0.7151 |
| NBLA00301 | 6.47 | 4.007e-09 | 6.94e-05 | 0.726 |
| MUSK | 6.27 | 4.755e-09 | 8.24e-05 | 0.7137 |
| SESN1 | 6.25 | 4.926e-09 | 8.54e-05 | 0.7077 |
| PDGFB | 6.14 | 7.019e-09 | 0.000122 | 0.7197 |
| STK24 | 6.35 | 7.347e-09 | 0.000127 | 0.7532 |
| ASB4 | 6.08 | 1.011e-08 | 0.000175 | 0.694 |
Figure S6. Get High-res Image As an example, this figure shows the association of C20ORF112 to 'PATHOLOGICSPREAD(M)'. P value = 3.47e-12 with T-test analysis.
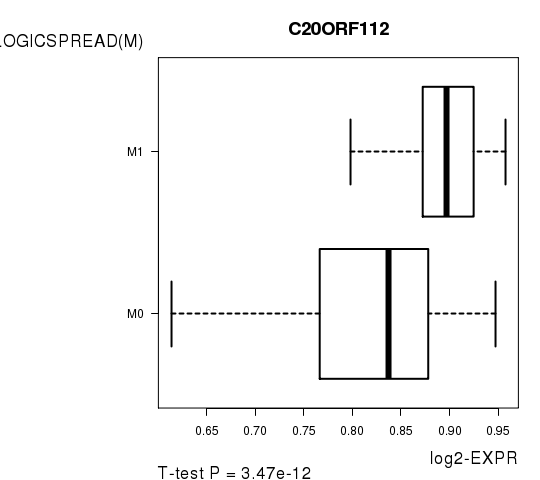
Table S14. Basic characteristics of clinical feature: 'TUMOR.STAGE'
| TUMOR.STAGE | Mean (SD) | 2.2 (1.2) |
| N | ||
| Stage 1 | 126 | |
| Stage 2 | 22 | |
| Stage 3 | 68 | |
| Stage 4 | 56 | |
| Significant markers | N = 884 | |
| pos. correlated | 559 | |
| neg. correlated | 325 |
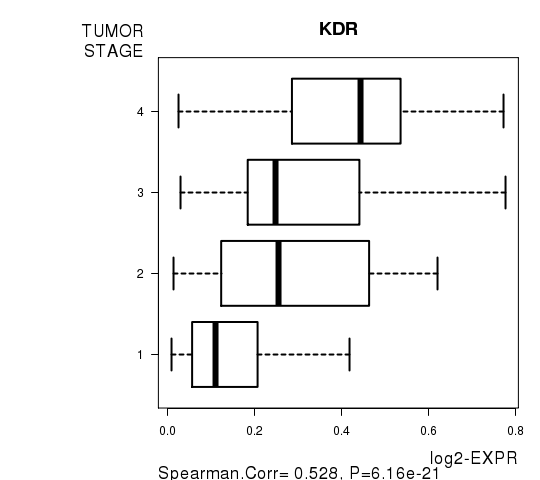
Table S15. Get Full Table List of top 10 genes significantly correlated to 'TUMOR.STAGE' by Spearman correlation test
| SpearmanCorr | corrP | Q | |
|---|---|---|---|
| KDR | 0.5281 | 6.164e-21 | 1.07e-16 |
| UTF1 | 0.4971 | 2.218e-18 | 3.84e-14 |
| LOC645323 | 0.5017 | 4.807e-18 | 8.33e-14 |
| OPRK1 | 0.4921 | 5.436e-18 | 9.42e-14 |
| CLEC2L | 0.4888 | 9.614e-18 | 1.67e-13 |
| ACTA1 | 0.4879 | 1.125e-17 | 1.95e-13 |
| NEUROD2 | 0.4833 | 2.516e-17 | 4.36e-13 |
| SYN2 | 0.4751 | 1.016e-16 | 1.76e-12 |
| AVPR1A | 0.468 | 3.259e-16 | 5.65e-12 |
| FAM38B | 0.4676 | 3.507e-16 | 6.08e-12 |
Figure S7. Get High-res Image As an example, this figure shows the association of KDR to 'TUMOR.STAGE'. P value = 6.16e-21 with Spearman correlation analysis.
-
Expresson data file = KIRC-TP.meth.for_correlation.filtered_data.txt
-
Clinical data file = KIRC-TP.clin.merged.picked.txt
-
Number of patients = 272
-
Number of genes = 17337
-
Number of clinical features = 8
For survival clinical features, Wald's test in univariate Cox regression analysis with proportional hazards model (Andersen and Gill 1982) was used to estimate the P values using the 'coxph' function in R. Kaplan-Meier survival curves were plot using the four quartile subgroups of patients based on expression levels
For continuous numerical clinical features, Spearman's rank correlation coefficients (Spearman 1904) and two-tailed P values were estimated using 'cor.test' function in R
For two-class clinical features, two-tailed Student's t test with unequal variance (Lehmann and Romano 2005) was applied to compare the log2-expression levels between the two clinical classes using 't.test' function in R
For multiple hypothesis correction, Q value is the False Discovery Rate (FDR) analogue of the P value (Benjamini and Hochberg 1995), defined as the minimum FDR at which the test may be called significant. We used the 'Benjamini and Hochberg' method of 'p.adjust' function in R to convert P values into Q values.
This is an experimental feature. The full results of the analysis summarized in this report can be downloaded from the TCGA Data Coordination Center.