(primary solid tumor cohort)
This pipeline uses various statistical tests to identify miRs whose expression levels correlated to selected clinical features.
Testing the association between 471 genes and 8 clinical features across 480 samples, statistically thresholded by Q value < 0.05, 6 clinical features related to at least one genes.
-
60 genes correlated to 'Time to Death'.
-
HSA-MIR-130B , HSA-MIR-223 , HSA-MIR-21 , HSA-MIR-34C , HSA-MIR-138-1 , ...
-
2 genes correlated to 'AGE'.
-
HSA-MIR-148A , HSA-MIR-590
-
12 genes correlated to 'GENDER'.
-
HSA-MIR-100 , HSA-MIR-455 , HSA-MIR-708 , HSA-MIR-599 , HSA-MIR-30A , ...
-
35 genes correlated to 'PATHOLOGY.T'.
-
HSA-MIR-139 , HSA-MIR-625 , HSA-MIR-21 , HSA-MIR-130B , HSA-MIR-486 , ...
-
18 genes correlated to 'PATHOLOGICSPREAD(M)'.
-
HSA-MIR-193A , HSA-MIR-625 , HSA-MIR-155 , HSA-MIR-28 , HSA-MIR-130B , ...
-
41 genes correlated to 'TUMOR.STAGE'.
-
HSA-MIR-139 , HSA-MIR-21 , HSA-MIR-155 , HSA-MIR-625 , HSA-MIR-144 , ...
-
No genes correlated to 'KARNOFSKY.PERFORMANCE.SCORE', and 'PATHOLOGY.N'.
Complete statistical result table is provided in Supplement Table 1
Table 1. Get Full Table This table shows the clinical features, statistical methods used, and the number of genes that are significantly associated with each clinical feature at Q value < 0.05.
| Clinical feature | Statistical test | Significant genes | Associated with | Associated with | ||
|---|---|---|---|---|---|---|
| Time to Death | Cox regression test | N=60 | shorter survival | N=54 | longer survival | N=6 |
| AGE | Spearman correlation test | N=2 | older | N=2 | younger | N=0 |
| GENDER | t test | N=12 | male | N=4 | female | N=8 |
| KARNOFSKY PERFORMANCE SCORE | Spearman correlation test | N=0 | ||||
| PATHOLOGY T | Spearman correlation test | N=35 | higher pT | N=27 | lower pT | N=8 |
| PATHOLOGY N | t test | N=0 | ||||
| PATHOLOGICSPREAD(M) | t test | N=18 | m1 | N=14 | m0 | N=4 |
| TUMOR STAGE | Spearman correlation test | N=41 | higher stage | N=32 | lower stage | N=9 |
Table S1. Basic characteristics of clinical feature: 'Time to Death'
| Time to Death | Duration (Months) | 0.1-111 (median=35.2) |
| censored | N = 323 | |
| death | N = 154 | |
| Significant markers | N = 60 | |
| associated with shorter survival | 54 | |
| associated with longer survival | 6 |
Table S2. Get Full Table List of top 10 genes significantly associated with 'Time to Death' by Cox regression test
| HazardRatio | Wald_P | Q | C_index | |
|---|---|---|---|---|
| HSA-MIR-130B | 2.1 | 7.949e-14 | 3.7e-11 | 0.665 |
| HSA-MIR-223 | 1.63 | 5.21e-13 | 2.4e-10 | 0.649 |
| HSA-MIR-21 | 2 | 1.109e-09 | 5.2e-07 | 0.657 |
| HSA-MIR-34C | 1.27 | 2.752e-09 | 1.3e-06 | 0.633 |
| HSA-MIR-138-1 | 1.38 | 2.552e-08 | 1.2e-05 | 0.644 |
| HSA-MIR-1248 | 1.4 | 3.509e-08 | 1.6e-05 | 0.62 |
| HSA-MIR-365-2 | 1.66 | 4.286e-08 | 2e-05 | 0.628 |
| HSA-MIR-18A | 1.55 | 5.002e-08 | 2.3e-05 | 0.622 |
| HSA-MIR-10B | 0.57 | 9.608e-08 | 4.4e-05 | 0.373 |
| HSA-MIR-101-1 | 0.55 | 1.142e-07 | 5.3e-05 | 0.395 |
Figure S1. Get High-res Image As an example, this figure shows the association of HSA-MIR-130B to 'Time to Death'. four curves present the cumulative survival rates of 4 quartile subsets of patients. P value = 7.95e-14 with univariate Cox regression analysis using continuous log-2 expression values.
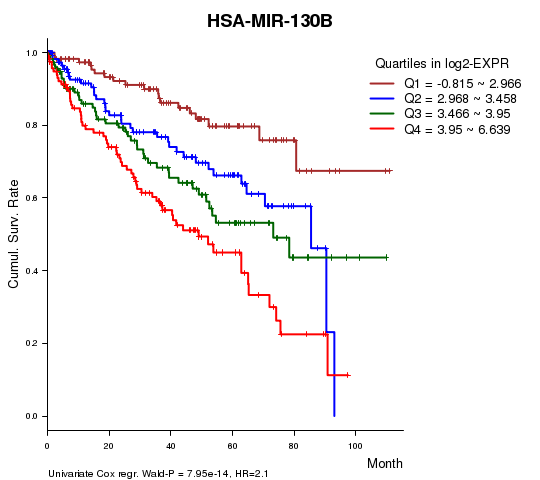
Table S3. Basic characteristics of clinical feature: 'AGE'
| AGE | Mean (SD) | 60.58 (12) |
| Significant markers | N = 2 | |
| pos. correlated | 2 | |
| neg. correlated | 0 |
Table S4. Get Full Table List of 2 genes significantly correlated to 'AGE' by Spearman correlation test
| SpearmanCorr | corrP | Q | |
|---|---|---|---|
| HSA-MIR-148A | 0.1852 | 4.477e-05 | 0.0211 |
| HSA-MIR-590 | 0.1823 | 5.91e-05 | 0.0278 |
Figure S2. Get High-res Image As an example, this figure shows the association of HSA-MIR-148A to 'AGE'. P value = 4.48e-05 with Spearman correlation analysis. The straight line presents the best linear regression.
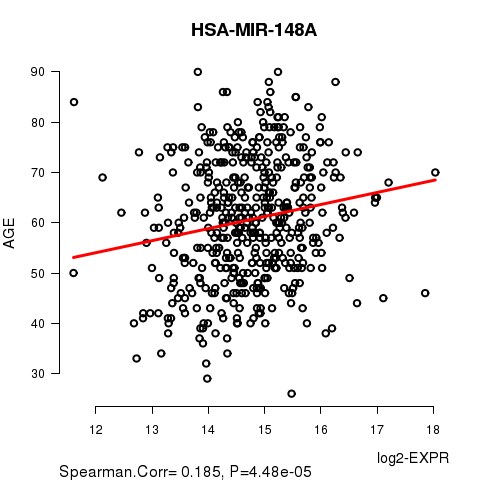
Table S5. Basic characteristics of clinical feature: 'GENDER'
| GENDER | Labels | N |
| FEMALE | 163 | |
| MALE | 317 | |
| Significant markers | N = 12 | |
| Higher in MALE | 4 | |
| Higher in FEMALE | 8 |
Table S6. Get Full Table List of top 10 genes differentially expressed by 'GENDER'
| T(pos if higher in 'MALE') | ttestP | Q | AUC | |
|---|---|---|---|---|
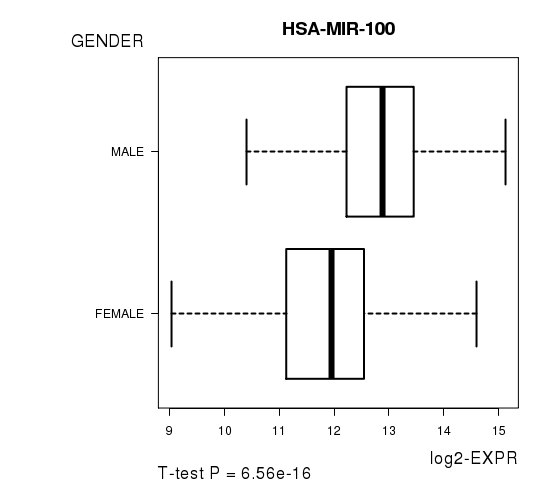
| HSA-MIR-100 | 8.54 | 6.562e-16 | 3.09e-13 | 0.7423 |
| HSA-MIR-455 | -5.26 | 2.457e-07 | 0.000115 | 0.6499 |
| HSA-MIR-708 | 5.24 | 3.051e-07 | 0.000143 | 0.6535 |
| HSA-MIR-599 | -5.25 | 3.079e-07 | 0.000144 | 0.6756 |
| HSA-MIR-30A | -4.34 | 1.875e-05 | 0.00875 | 0.6129 |
| HSA-MIR-500B | -4.32 | 2.054e-05 | 0.00957 | 0.6203 |
| HSA-MIR-30C-2 | -4.32 | 2.063e-05 | 0.00959 | 0.6125 |
| HSA-MIR-31 | 4.17 | 3.961e-05 | 0.0184 | 0.6225 |
| HSA-MIR-3934 | 4.06 | 6.878e-05 | 0.0318 | 0.6286 |
| HSA-MIR-204 | -4.02 | 7.103e-05 | 0.0328 | 0.6349 |
Figure S3. Get High-res Image As an example, this figure shows the association of HSA-MIR-100 to 'GENDER'. P value = 6.56e-16 with T-test analysis.
No gene related to 'KARNOFSKY.PERFORMANCE.SCORE'.
Table S7. Basic characteristics of clinical feature: 'KARNOFSKY.PERFORMANCE.SCORE'
| KARNOFSKY.PERFORMANCE.SCORE | Mean (SD) | 88.33 (23) |
| Score | N | |
| 0 | 2 | |
| 70 | 1 | |
| 80 | 3 | |
| 90 | 13 | |
| 100 | 17 | |
| Significant markers | N = 0 |
Table S8. Basic characteristics of clinical feature: 'PATHOLOGY.T'
| PATHOLOGY.T | Mean (SD) | 1.92 (0.97) |
| N | ||
| T1 | 233 | |
| T2 | 62 | |
| T3 | 174 | |
| T4 | 11 | |
| Significant markers | N = 35 | |
| pos. correlated | 27 | |
| neg. correlated | 8 |
Table S9. Get Full Table List of top 10 genes significantly correlated to 'PATHOLOGY.T' by Spearman correlation test
| SpearmanCorr | corrP | Q | |
|---|---|---|---|
| HSA-MIR-139 | -0.3342 | 5.503e-14 | 2.59e-11 |
| HSA-MIR-625 | 0.2793 | 4.732e-10 | 2.22e-07 |
| HSA-MIR-21 | 0.2765 | 7.164e-10 | 3.36e-07 |
| HSA-MIR-130B | 0.2577 | 1.017e-08 | 4.76e-06 |
| HSA-MIR-486 | -0.253 | 1.903e-08 | 8.88e-06 |
| HSA-MIR-155 | 0.2529 | 1.925e-08 | 8.97e-06 |
| HSA-MIR-144 | -0.2463 | 4.571e-08 | 2.13e-05 |
| HSA-MIR-9-2 | 0.2257 | 5.838e-07 | 0.000271 |
| HSA-MIR-451 | -0.2239 | 7.202e-07 | 0.000333 |
| HSA-MIR-9-1 | 0.2216 | 9.423e-07 | 0.000435 |
Figure S4. Get High-res Image As an example, this figure shows the association of HSA-MIR-139 to 'PATHOLOGY.T'. P value = 5.5e-14 with Spearman correlation analysis.
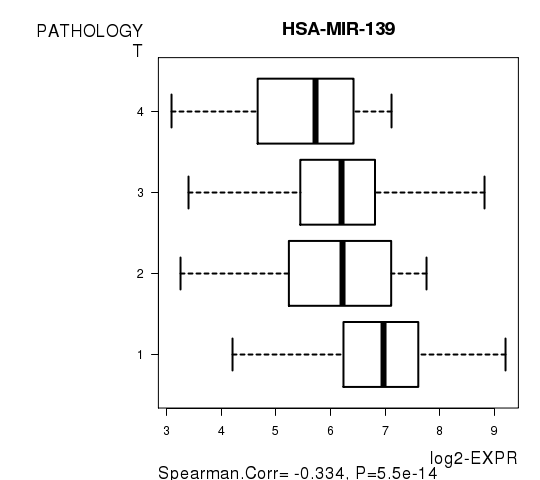
Table S10. Basic characteristics of clinical feature: 'PATHOLOGY.N'
| PATHOLOGY.N | Labels | N |
| N0 | 222 | |
| N1 | 17 | |
| Significant markers | N = 0 |
Table S11. Basic characteristics of clinical feature: 'PATHOLOGICSPREAD(M)'
| PATHOLOGICSPREAD(M) | Labels | N |
| M0 | 405 | |
| M1 | 75 | |
| Significant markers | N = 18 | |
| Higher in M1 | 14 | |
| Higher in M0 | 4 |
Table S12. Get Full Table List of top 10 genes differentially expressed by 'PATHOLOGICSPREAD(M)'
| T(pos if higher in 'M1') | ttestP | Q | AUC | |
|---|---|---|---|---|
| HSA-MIR-193A | 5.78 | 3.13e-08 | 1.47e-05 | 0.6467 |
| HSA-MIR-625 | 5.36 | 4.97e-07 | 0.000234 | 0.6849 |
| HSA-MIR-155 | 5.17 | 1.072e-06 | 0.000503 | 0.6815 |
| HSA-MIR-28 | 5.16 | 1.113e-06 | 0.000521 | 0.6609 |
| HSA-MIR-130B | 5.12 | 1.218e-06 | 0.000569 | 0.6671 |
| HSA-MIR-144 | -5.01 | 2.339e-06 | 0.00109 | 0.6793 |
| HSA-MIR-27A | 4.93 | 2.378e-06 | 0.00111 | 0.6328 |
| HSA-MIR-106B | 4.86 | 3.123e-06 | 0.00145 | 0.6525 |
| HSA-MIR-139 | -4.62 | 1.123e-05 | 0.0052 | 0.6657 |
| HSA-MIR-21 | 4.5 | 1.605e-05 | 0.00741 | 0.6393 |
Figure S5. Get High-res Image As an example, this figure shows the association of HSA-MIR-193A to 'PATHOLOGICSPREAD(M)'. P value = 3.13e-08 with T-test analysis.
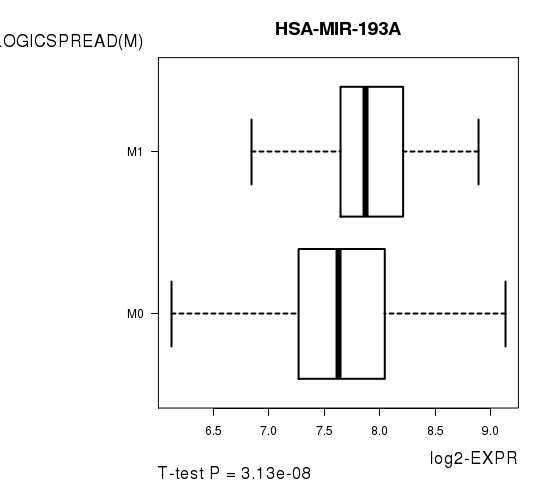
Table S13. Basic characteristics of clinical feature: 'TUMOR.STAGE'
| TUMOR.STAGE | Mean (SD) | 2.11 (1.2) |
| N | ||
| Stage 1 | 229 | |
| Stage 2 | 50 | |
| Stage 3 | 122 | |
| Stage 4 | 79 | |
| Significant markers | N = 41 | |
| pos. correlated | 32 | |
| neg. correlated | 9 |
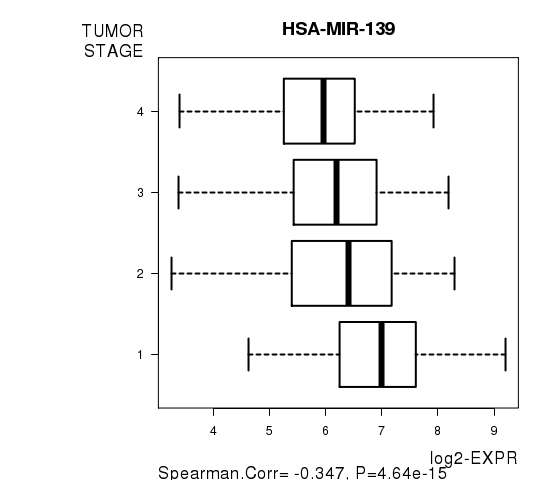
Table S14. Get Full Table List of top 10 genes significantly correlated to 'TUMOR.STAGE' by Spearman correlation test
| SpearmanCorr | corrP | Q | |
|---|---|---|---|
| HSA-MIR-139 | -0.3474 | 4.64e-15 | 2.19e-12 |
| HSA-MIR-21 | 0.2797 | 4.449e-10 | 2.09e-07 |
| HSA-MIR-155 | 0.278 | 5.723e-10 | 2.68e-07 |
| HSA-MIR-625 | 0.2763 | 7.378e-10 | 3.45e-07 |
| HSA-MIR-144 | -0.272 | 1.381e-09 | 6.45e-07 |
| HSA-MIR-486 | -0.2666 | 2.975e-09 | 1.39e-06 |
| HSA-MIR-451 | -0.2491 | 3.201e-08 | 1.49e-05 |
| HSA-MIR-130B | 0.2456 | 5.006e-08 | 2.32e-05 |
| HSA-MIR-10B | -0.2324 | 2.617e-07 | 0.000121 |
| HSA-MIR-9-2 | 0.232 | 2.746e-07 | 0.000127 |
Figure S6. Get High-res Image As an example, this figure shows the association of HSA-MIR-139 to 'TUMOR.STAGE'. P value = 4.64e-15 with Spearman correlation analysis.
-
Expresson data file = KIRC-TP.miRseq_RPKM_log2.txt
-
Clinical data file = KIRC-TP.clin.merged.picked.txt
-
Number of patients = 480
-
Number of genes = 471
-
Number of clinical features = 8
For survival clinical features, Wald's test in univariate Cox regression analysis with proportional hazards model (Andersen and Gill 1982) was used to estimate the P values using the 'coxph' function in R. Kaplan-Meier survival curves were plot using the four quartile subgroups of patients based on expression levels
For continuous numerical clinical features, Spearman's rank correlation coefficients (Spearman 1904) and two-tailed P values were estimated using 'cor.test' function in R
For two-class clinical features, two-tailed Student's t test with unequal variance (Lehmann and Romano 2005) was applied to compare the log2-expression levels between the two clinical classes using 't.test' function in R
For multiple hypothesis correction, Q value is the False Discovery Rate (FDR) analogue of the P value (Benjamini and Hochberg 1995), defined as the minimum FDR at which the test may be called significant. We used the 'Benjamini and Hochberg' method of 'p.adjust' function in R to convert P values into Q values.
This is an experimental feature. The full results of the analysis summarized in this report can be downloaded from the TCGA Data Coordination Center.