(primary blood tumor (peripheral) cohort)
This pipeline uses various statistical tests to identify genes whose promoter methylation levels correlated to selected clinical features.
Testing the association between 16580 genes and 3 clinical features across 175 samples, statistically thresholded by Q value < 0.05, 3 clinical features related to at least one genes.
-
2 genes correlated to 'Time to Death'.
-
AGRN , C10ORF128
-
44 genes correlated to 'AGE'.
-
JAKMIP1 , KIAA1377 , HCG4 , AASS , TMEM20 , ...
-
10 genes correlated to 'GENDER'.
-
FAM35A , DKFZP434L187 , KIF4B , CROCC , NICN1 , ...
Complete statistical result table is provided in Supplement Table 1
Table 1. Get Full Table This table shows the clinical features, statistical methods used, and the number of genes that are significantly associated with each clinical feature at Q value < 0.05.
| Clinical feature | Statistical test | Significant genes | Associated with | Associated with | ||
|---|---|---|---|---|---|---|
| Time to Death | Cox regression test | N=2 | shorter survival | N=1 | longer survival | N=1 |
| AGE | Spearman correlation test | N=44 | older | N=9 | younger | N=35 |
| GENDER | t test | N=10 | male | N=5 | female | N=5 |
Table S1. Basic characteristics of clinical feature: 'Time to Death'
| Time to Death | Duration (Months) | 0.9-94.1 (median=12) |
| censored | N = 59 | |
| death | N = 92 | |
| Significant markers | N = 2 | |
| associated with shorter survival | 1 | |
| associated with longer survival | 1 |
Table S2. Get Full Table List of 2 genes significantly associated with 'Time to Death' by Cox regression test
| HazardRatio | Wald_P | Q | C_index | |
|---|---|---|---|---|
| AGRN | 250000001 | 1.441e-09 | 2.4e-05 | 0.538 |
| C10ORF128 | 0.12 | 7.053e-07 | 0.012 | 0.371 |
Figure S1. Get High-res Image As an example, this figure shows the association of AGRN to 'Time to Death'. four curves present the cumulative survival rates of 4 quartile subsets of patients. P value = 1.44e-09 with univariate Cox regression analysis using continuous log-2 expression values.
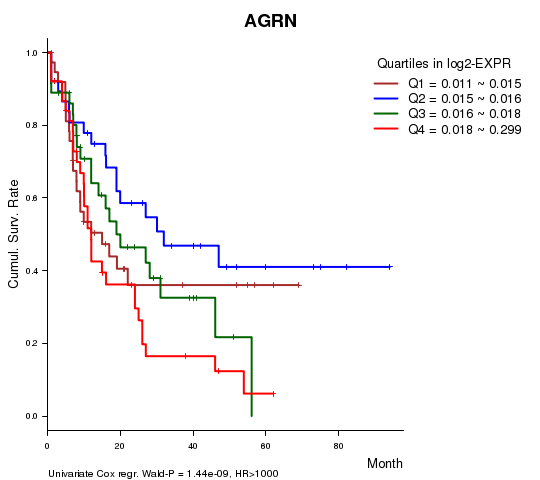
Table S3. Basic characteristics of clinical feature: 'AGE'
| AGE | Mean (SD) | 55.13 (16) |
| Significant markers | N = 44 | |
| pos. correlated | 9 | |
| neg. correlated | 35 |
Table S4. Get Full Table List of top 10 genes significantly correlated to 'AGE' by Spearman correlation test
| SpearmanCorr | corrP | Q | |
|---|---|---|---|
| JAKMIP1 | -0.4598 | 1.543e-10 | 2.56e-06 |
| KIAA1377 | -0.458 | 1.862e-10 | 3.09e-06 |
| HCG4 | -0.4352 | 1.751e-09 | 2.9e-05 |
| AASS | -0.404 | 2.939e-08 | 0.000487 |
| TMEM20 | -0.4004 | 4.012e-08 | 0.000665 |
| HIST3H2A | -0.3905 | 9.135e-08 | 0.00151 |
| APBB1 | -0.3883 | 1.1e-07 | 0.00182 |
| CD96 | 0.3881 | 1.114e-07 | 0.00185 |
| TBC1D12 | -0.3856 | 1.363e-07 | 0.00226 |
| SARM1 | -0.381 | 1.975e-07 | 0.00327 |
Figure S2. Get High-res Image As an example, this figure shows the association of JAKMIP1 to 'AGE'. P value = 1.54e-10 with Spearman correlation analysis. The straight line presents the best linear regression.
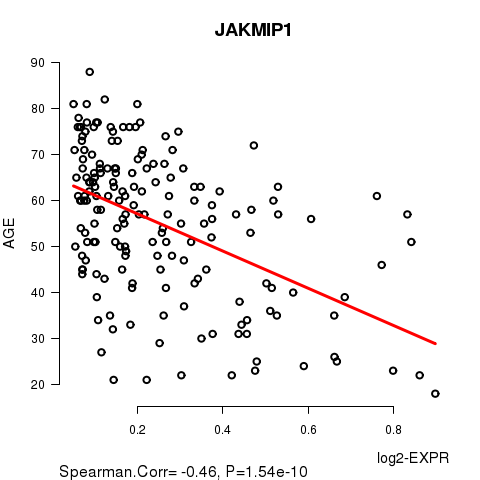
Table S5. Basic characteristics of clinical feature: 'GENDER'
| GENDER | Labels | N |
| FEMALE | 83 | |
| MALE | 92 | |
| Significant markers | N = 10 | |
| Higher in MALE | 5 | |
| Higher in FEMALE | 5 |
Table S6. Get Full Table List of 10 genes differentially expressed by 'GENDER'
| T(pos if higher in 'MALE') | ttestP | Q | AUC | |
|---|---|---|---|---|
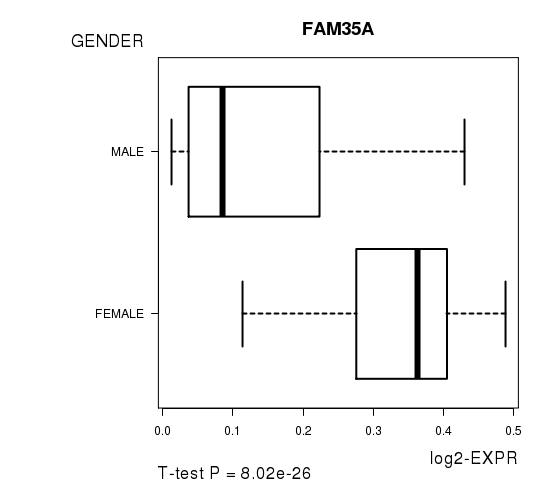
| FAM35A | -12.54 | 8.017e-26 | 1.33e-21 | 0.8924 |
| DKFZP434L187 | 11.4 | 2.187e-22 | 3.63e-18 | 0.9339 |
| KIF4B | -11.45 | 3.327e-22 | 5.52e-18 | 0.8642 |
| CROCC | -10.11 | 4.35e-19 | 7.21e-15 | 0.8854 |
| NICN1 | -9.89 | 3.979e-18 | 6.59e-14 | 0.8732 |
| WBP11P1 | 8.31 | 2.816e-14 | 4.67e-10 | 0.8296 |
| NARS | -5.66 | 6.377e-08 | 0.00106 | 0.7762 |
| LOC389791 | 5.41 | 2.099e-07 | 0.00348 | 0.714 |
| PLLP | 5.22 | 6.19e-07 | 0.0103 | 0.736 |
| ATP5J | 5.07 | 1.115e-06 | 0.0185 | 0.7385 |
Figure S3. Get High-res Image As an example, this figure shows the association of FAM35A to 'GENDER'. P value = 8.02e-26 with T-test analysis.
-
Expresson data file = LAML-TB.meth.for_correlation.filtered_data.txt
-
Clinical data file = LAML-TP.clin.merged.picked.txt
-
Number of patients = 175
-
Number of genes = 16580
-
Number of clinical features = 3
For survival clinical features, Wald's test in univariate Cox regression analysis with proportional hazards model (Andersen and Gill 1982) was used to estimate the P values using the 'coxph' function in R. Kaplan-Meier survival curves were plot using the four quartile subgroups of patients based on expression levels
For continuous numerical clinical features, Spearman's rank correlation coefficients (Spearman 1904) and two-tailed P values were estimated using 'cor.test' function in R
For two-class clinical features, two-tailed Student's t test with unequal variance (Lehmann and Romano 2005) was applied to compare the log2-expression levels between the two clinical classes using 't.test' function in R
For multiple hypothesis correction, Q value is the False Discovery Rate (FDR) analogue of the P value (Benjamini and Hochberg 1995), defined as the minimum FDR at which the test may be called significant. We used the 'Benjamini and Hochberg' method of 'p.adjust' function in R to convert P values into Q values.
This is an experimental feature. The full results of the analysis summarized in this report can be downloaded from the TCGA Data Coordination Center.