(primary blood tumor (peripheral) cohort)
This pipeline computes the correlation between significantly recurrent gene mutations and selected clinical features.
Testing the association between mutation status of 41 genes and 3 clinical features across 196 patients, 4 significant findings detected with Q value < 0.25.
-
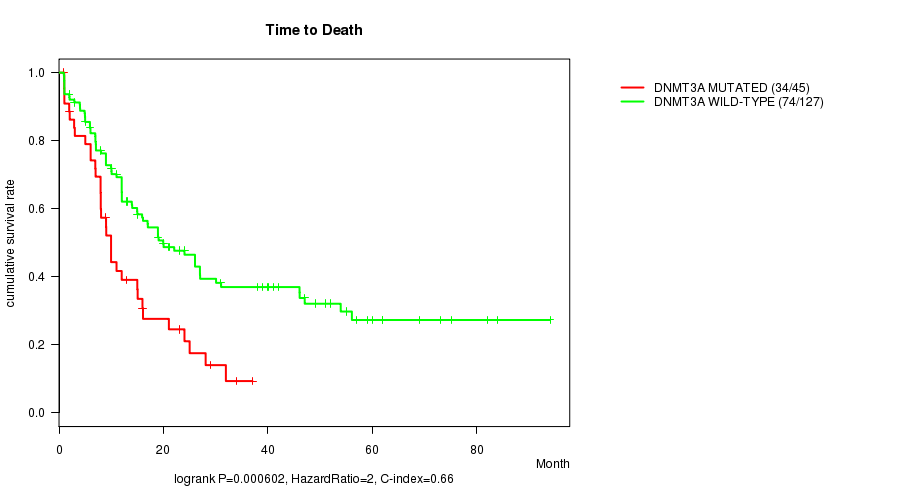
DNMT3A mutation correlated to 'Time to Death'.
-
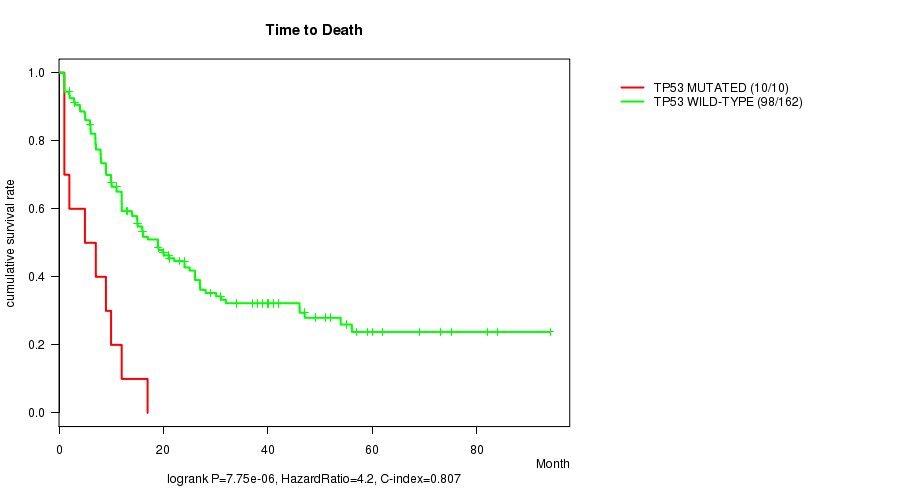
TP53 mutation correlated to 'Time to Death'.
-
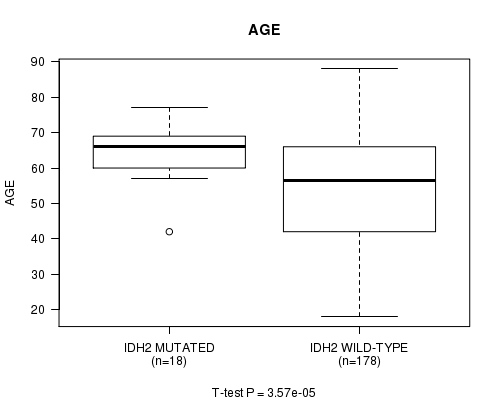
IDH2 mutation correlated to 'AGE'.
-
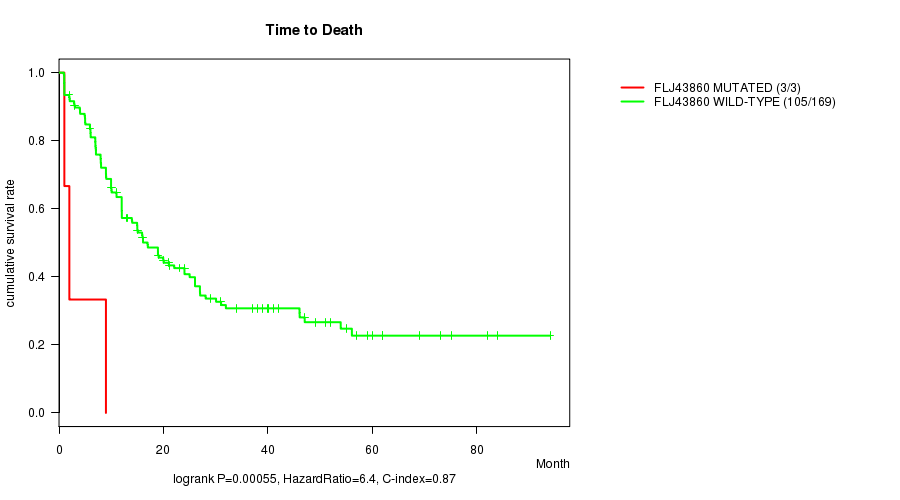
FLJ43860 mutation correlated to 'Time to Death'.
Table 1. Get Full Table Overview of the association between mutation status of 41 genes and 3 clinical features. Shown in the table are P values (Q values). Thresholded by Q value < 0.25, 4 significant findings detected.
|
Clinical Features |
Time to Death |
AGE | GENDER | ||
| nMutated (%) | nWild-Type | logrank test | t-test | Fisher's exact test | |
| DNMT3A | 49 (25%) | 147 |
0.000602 (0.0662) |
0.0517 (1.00) |
0.248 (1.00) |
| TP53 | 11 (6%) | 185 |
7.75e-06 (0.000876) |
0.00306 (0.334) |
0.351 (1.00) |
| IDH2 | 18 (9%) | 178 |
0.897 (1.00) |
3.57e-05 (0.004) |
1 (1.00) |
| FLJ43860 | 3 (2%) | 193 |
0.00055 (0.061) |
0.754 (1.00) |
0.253 (1.00) |
| NPM1 | 47 (24%) | 149 |
0.223 (1.00) |
0.985 (1.00) |
0.132 (1.00) |
| FLT3 | 52 (27%) | 144 |
0.204 (1.00) |
0.365 (1.00) |
0.516 (1.00) |
| IDH1 | 20 (10%) | 176 |
0.925 (1.00) |
0.339 (1.00) |
0.478 (1.00) |
| NRAS | 18 (9%) | 178 |
0.88 (1.00) |
0.523 (1.00) |
0.626 (1.00) |
| RUNX1 | 17 (9%) | 179 |
0.232 (1.00) |
0.106 (1.00) |
0.802 (1.00) |
| WT1 | 12 (6%) | 184 |
0.325 (1.00) |
0.0417 (1.00) |
0.773 (1.00) |
| KRAS | 8 (4%) | 188 |
0.498 (1.00) |
0.435 (1.00) |
0.472 (1.00) |
| TET2 | 15 (8%) | 181 |
0.869 (1.00) |
0.171 (1.00) |
0.286 (1.00) |
| U2AF1 | 10 (5%) | 186 |
0.462 (1.00) |
0.00354 (0.382) |
0.0234 (1.00) |
| PHF6 | 6 (3%) | 190 |
0.882 (1.00) |
0.234 (1.00) |
0.0328 (1.00) |
| PTPN11 | 7 (4%) | 189 |
0.373 (1.00) |
0.677 (1.00) |
1 (1.00) |
| KIT | 7 (4%) | 189 |
0.905 (1.00) |
0.485 (1.00) |
0.704 (1.00) |
| C17ORF97 | 5 (3%) | 191 |
0.631 (1.00) |
0.408 (1.00) |
0.379 (1.00) |
| ETV6 | 5 (3%) | 191 |
0.471 (1.00) |
0.278 (1.00) |
0.379 (1.00) |
| SMC3 | 6 (3%) | 190 |
0.178 (1.00) |
0.584 (1.00) |
0.413 (1.00) |
| FAM5C | 5 (3%) | 191 |
0.121 (1.00) |
0.044 (1.00) |
0.379 (1.00) |
| MUC4 | 7 (4%) | 189 |
0.149 (1.00) |
0.5 (1.00) |
1 (1.00) |
| CYP21A2 | 4 (2%) | 192 |
0.0175 (1.00) |
0.554 (1.00) |
1 (1.00) |
| NOTCH2NL | 3 (2%) | 193 |
0.807 (1.00) |
0.253 (1.00) |
|
| AP3S1 | 3 (2%) | 193 |
0.741 (1.00) |
0.534 (1.00) |
0.592 (1.00) |
| SMC1A | 5 (3%) | 191 |
0.479 (1.00) |
0.0219 (1.00) |
0.379 (1.00) |
| TRIM48 | 3 (2%) | 193 |
0.202 (1.00) |
0.592 (1.00) |
|
| C5ORF25 | 3 (2%) | 193 |
0.0882 (1.00) |
0.195 (1.00) |
0.0919 (1.00) |
| CCDC74A | 3 (2%) | 193 |
0.523 (1.00) |
0.347 (1.00) |
0.253 (1.00) |
| OR11H12 | 3 (2%) | 193 |
0.528 (1.00) |
0.374 (1.00) |
0.592 (1.00) |
| OR5H6 | 3 (2%) | 193 |
0.0468 (1.00) |
0.592 (1.00) |
|
| LILRA3 | 3 (2%) | 193 |
0.878 (1.00) |
0.592 (1.00) |
|
| NMUR2 | 3 (2%) | 193 |
0.928 (1.00) |
1 (1.00) |
|
| STAG2 | 4 (2%) | 192 |
0.397 (1.00) |
0.325 (1.00) |
0.331 (1.00) |
| SUZ12 | 3 (2%) | 193 |
0.879 (1.00) |
0.253 (1.00) |
|
| SCRN3 | 3 (2%) | 193 |
0.0536 (1.00) |
0.592 (1.00) |
|
| DIS3 | 3 (2%) | 193 |
0.724 (1.00) |
0.592 (1.00) |
|
| VPS26B | 3 (2%) | 193 |
0.588 (1.00) |
0.96 (1.00) |
0.253 (1.00) |
| ZNF275 | 3 (2%) | 193 |
0.0715 (1.00) |
0.592 (1.00) |
|
| EZH2 | 3 (2%) | 193 |
0.115 (1.00) |
1 (1.00) |
|
| ANKRD24 | 3 (2%) | 193 |
0.177 (1.00) |
0.761 (1.00) |
1 (1.00) |
| QRICH2 | 4 (2%) | 192 |
0.608 (1.00) |
0.0269 (1.00) |
1 (1.00) |
P value = 0.000602 (logrank test), Q value = 0.066
Table S1. Gene #1: 'DNMT3A MUTATION STATUS' versus Clinical Feature #1: 'Time to Death'
| nPatients | nDeath | Duration Range (Median), Month | |
|---|---|---|---|
| ALL | 172 | 108 | 0.9 - 94.1 (12.0) |
| DNMT3A MUTATED | 45 | 34 | 0.9 - 37.0 (9.0) |
| DNMT3A WILD-TYPE | 127 | 74 | 0.9 - 94.1 (15.0) |
Figure S1. Get High-res Image Gene #1: 'DNMT3A MUTATION STATUS' versus Clinical Feature #1: 'Time to Death'
P value = 7.75e-06 (logrank test), Q value = 0.00088
Table S2. Gene #5: 'TP53 MUTATION STATUS' versus Clinical Feature #1: 'Time to Death'
| nPatients | nDeath | Duration Range (Median), Month | |
|---|---|---|---|
| ALL | 172 | 108 | 0.9 - 94.1 (12.0) |
| TP53 MUTATED | 10 | 10 | 1.0 - 17.0 (6.0) |
| TP53 WILD-TYPE | 162 | 98 | 0.9 - 94.1 (13.0) |
Figure S2. Get High-res Image Gene #5: 'TP53 MUTATION STATUS' versus Clinical Feature #1: 'Time to Death'
P value = 3.57e-05 (t-test), Q value = 0.004
Table S3. Gene #6: 'IDH2 MUTATION STATUS' versus Clinical Feature #2: 'AGE'
| nPatients | Mean (Std.Dev) | |
|---|---|---|
| ALL | 196 | 55.0 (16.2) |
| IDH2 MUTATED | 18 | 64.6 (7.9) |
| IDH2 WILD-TYPE | 178 | 54.0 (16.5) |
Figure S3. Get High-res Image Gene #6: 'IDH2 MUTATION STATUS' versus Clinical Feature #2: 'AGE'
P value = 0.00055 (logrank test), Q value = 0.061
Table S4. Gene #34: 'FLJ43860 MUTATION STATUS' versus Clinical Feature #1: 'Time to Death'
| nPatients | nDeath | Duration Range (Median), Month | |
|---|---|---|---|
| ALL | 172 | 108 | 0.9 - 94.1 (12.0) |
| FLJ43860 MUTATED | 3 | 3 | 1.0 - 9.0 (2.0) |
| FLJ43860 WILD-TYPE | 169 | 105 | 0.9 - 94.1 (12.0) |
Figure S4. Get High-res Image Gene #34: 'FLJ43860 MUTATION STATUS' versus Clinical Feature #1: 'Time to Death'
-
Mutation data file = LAML-TB.mutsig.cluster.txt
-
Clinical data file = LAML-TP.clin.merged.picked.txt
-
Number of patients = 196
-
Number of significantly mutated genes = 41
-
Number of selected clinical features = 3
-
Exclude genes that fewer than K tumors have mutations, K = 3
For survival clinical features, the Kaplan-Meier survival curves of tumors with and without gene mutations were plotted and the statistical significance P values were estimated by logrank test (Bland and Altman 2004) using the 'survdiff' function in R
For continuous numerical clinical features, two-tailed Student's t test with unequal variance (Lehmann and Romano 2005) was applied to compare the clinical values between tumors with and without gene mutations using 't.test' function in R
For binary or multi-class clinical features (nominal or ordinal), two-tailed Fisher's exact tests (Fisher 1922) were used to estimate the P values using the 'fisher.test' function in R
For multiple hypothesis correction, Q value is the False Discovery Rate (FDR) analogue of the P value (Benjamini and Hochberg 1995), defined as the minimum FDR at which the test may be called significant. We used the 'Benjamini and Hochberg' method of 'p.adjust' function in R to convert P values into Q values.
This is an experimental feature. The full results of the analysis summarized in this report can be downloaded from the TCGA Data Coordination Center.