(primary solid tumor cohort)
This pipeline computes the correlation between significant arm-level copy number variations (cnvs) and selected clinical features.
Testing the association between copy number variation 49 arm-level results and 6 clinical features across 178 patients, 14 significant findings detected with Q value < 0.25.
-
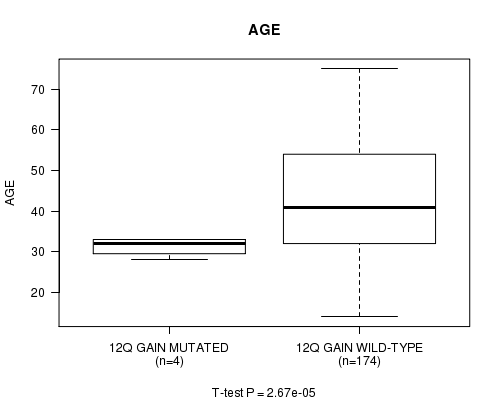
12q gain cnv correlated to 'AGE'.
-
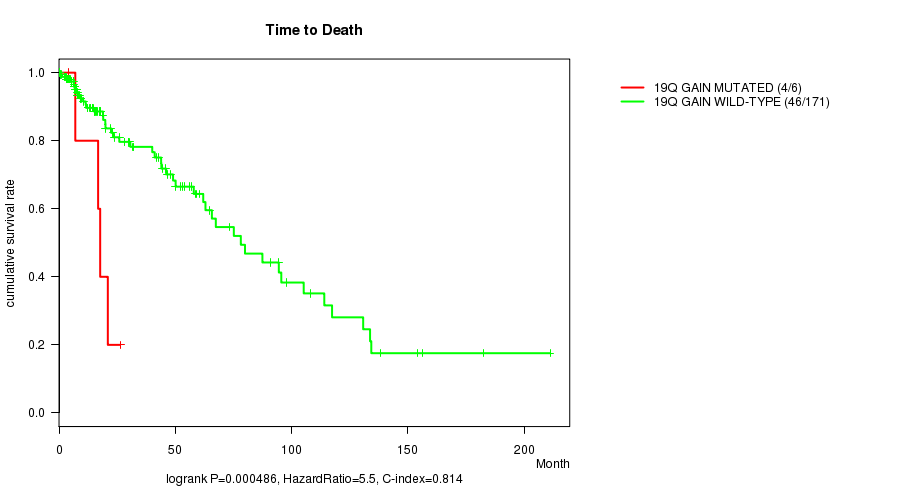
19q gain cnv correlated to 'Time to Death'.
-
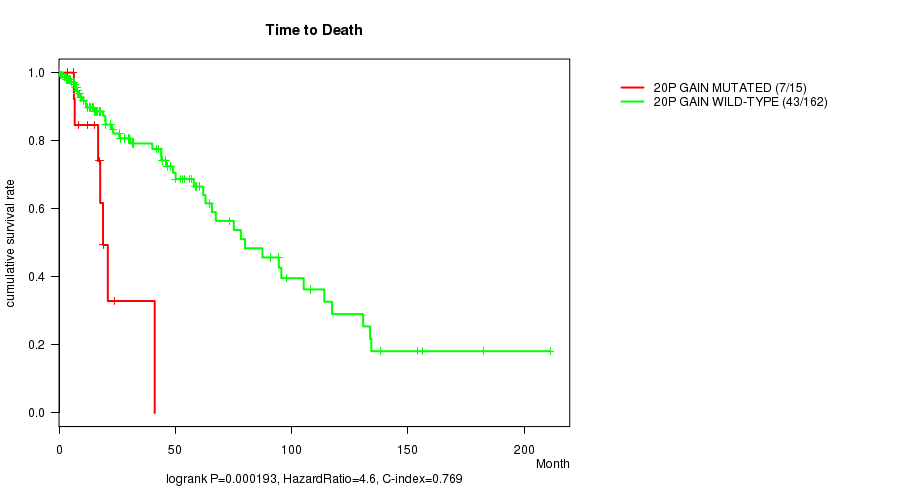
20p gain cnv correlated to 'Time to Death'.
-
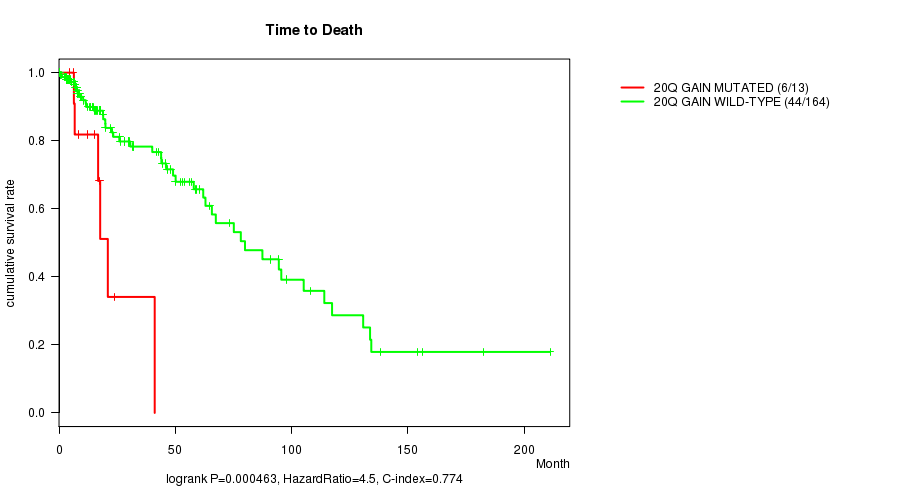
20q gain cnv correlated to 'Time to Death'.
-
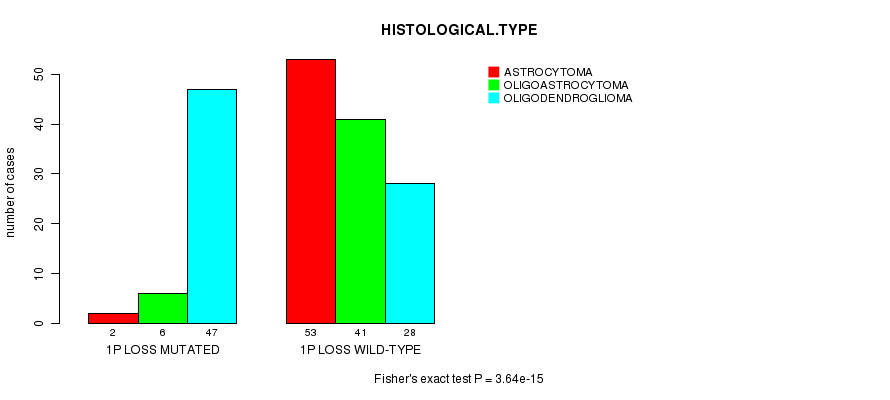
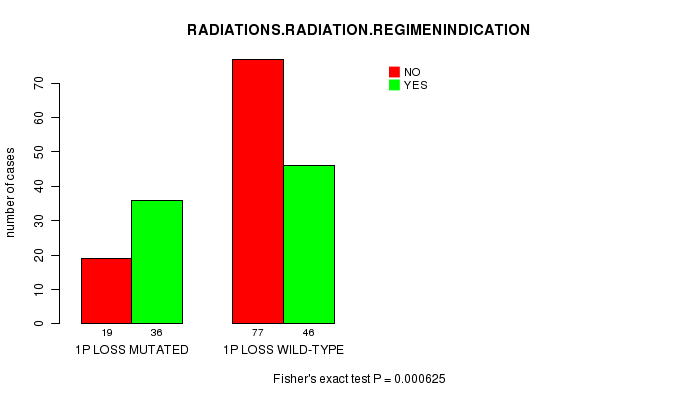
1p loss cnv correlated to 'HISTOLOGICAL.TYPE' and 'RADIATIONS.RADIATION.REGIMENINDICATION'.
-
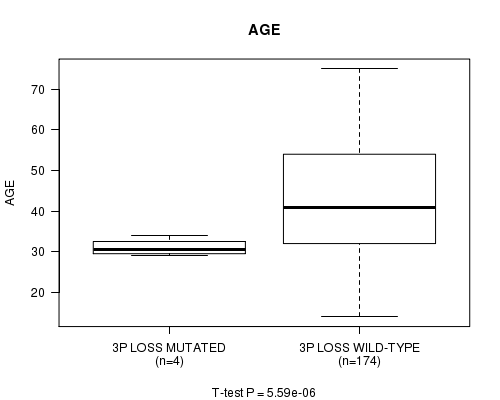
3p loss cnv correlated to 'AGE'.
-
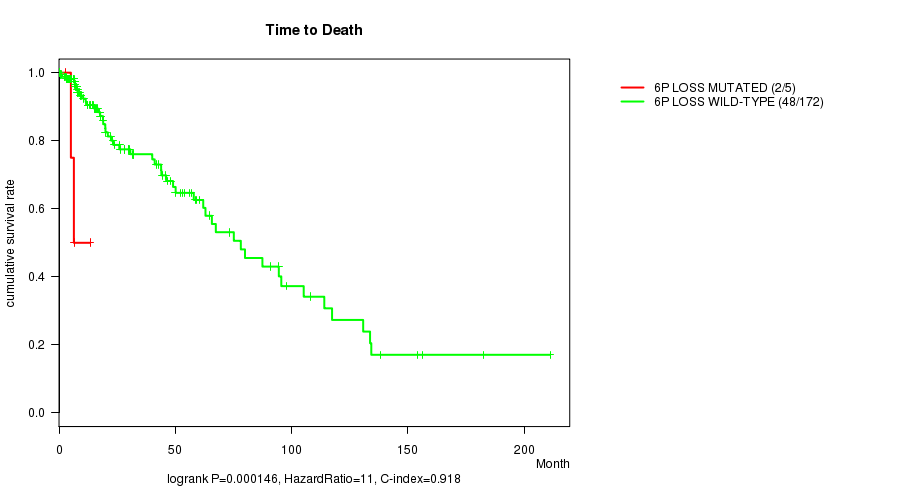
6p loss cnv correlated to 'Time to Death'.
-
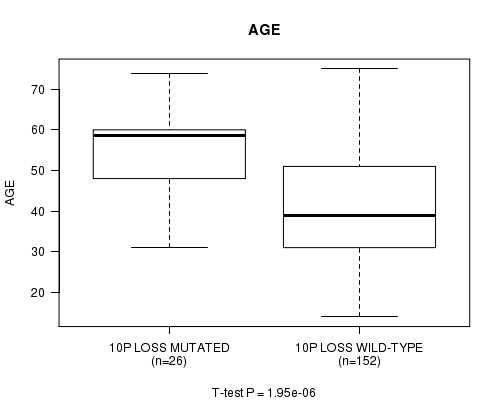
10p loss cnv correlated to 'Time to Death' and 'AGE'.
-
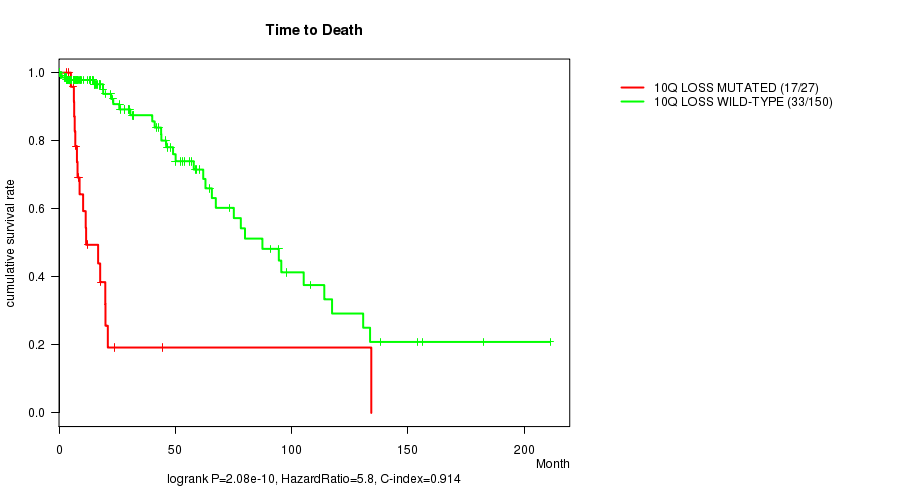
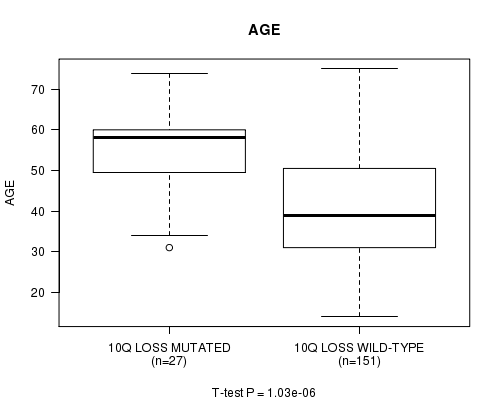
10q loss cnv correlated to 'Time to Death' and 'AGE'.
-
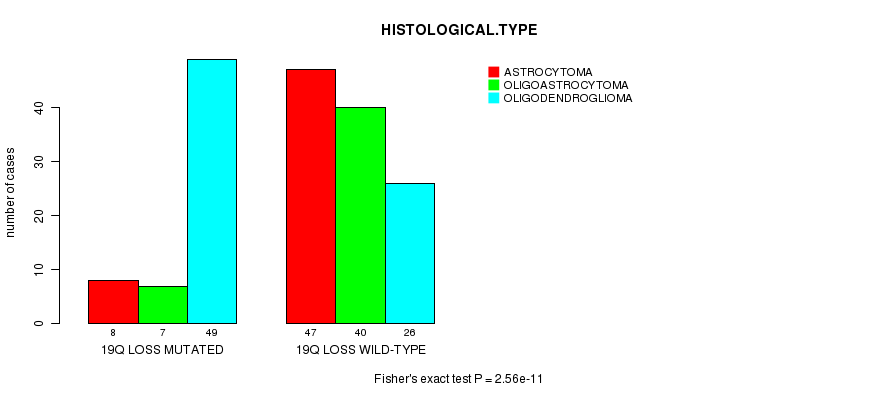
19q loss cnv correlated to 'HISTOLOGICAL.TYPE'.
-
22q loss cnv correlated to 'Time to Death'.
Table 1. Get Full Table Overview of the association between significant copy number variation of 49 arm-level results and 6 clinical features. Shown in the table are P values (Q values). Thresholded by Q value < 0.25, 14 significant findings detected.
|
Clinical Features |
Time to Death |
AGE | GENDER |
KARNOFSKY PERFORMANCE SCORE |
HISTOLOGICAL TYPE |
RADIATIONS RADIATION REGIMENINDICATION |
||
| nCNV (%) | nWild-Type | logrank test | t-test | Fisher's exact test | t-test | Fisher's exact test | Fisher's exact test | |
| 1p loss | 55 (31%) | 123 |
0.132 (1.00) |
0.019 (1.00) |
1 (1.00) |
0.78 (1.00) |
3.64e-15 (1.03e-12) |
0.000625 (0.168) |
| 10p loss | 26 (15%) | 152 |
9.19e-11 (2.57e-08) |
1.95e-06 (0.00054) |
0.0522 (1.00) |
0.838 (1.00) |
0.023 (1.00) |
0.832 (1.00) |
| 10q loss | 27 (15%) | 151 |
2.08e-10 (5.81e-08) |
1.03e-06 (0.000287) |
0.0332 (1.00) |
0.883 (1.00) |
0.0115 (1.00) |
0.676 (1.00) |
| 12q gain | 4 (2%) | 174 |
0.195 (1.00) |
2.67e-05 (0.00731) |
0.137 (1.00) |
0.819 (1.00) |
1 (1.00) |
|
| 19q gain | 6 (3%) | 172 |
0.000486 (0.131) |
0.0584 (1.00) |
0.241 (1.00) |
0.267 (1.00) |
0.496 (1.00) |
0.22 (1.00) |
| 20p gain | 15 (8%) | 163 |
0.000193 (0.0524) |
0.0246 (1.00) |
0.18 (1.00) |
0.937 (1.00) |
0.406 (1.00) |
0.419 (1.00) |
| 20q gain | 13 (7%) | 165 |
0.000463 (0.126) |
0.0479 (1.00) |
0.243 (1.00) |
0.847 (1.00) |
0.503 (1.00) |
0.774 (1.00) |
| 3p loss | 4 (2%) | 174 |
0.89 (1.00) |
5.59e-06 (0.00154) |
0.637 (1.00) |
0.686 (1.00) |
0.336 (1.00) |
|
| 6p loss | 5 (3%) | 173 |
0.000146 (0.0398) |
0.801 (1.00) |
1 (1.00) |
0.847 (1.00) |
0.449 (1.00) |
1 (1.00) |
| 19q loss | 64 (36%) | 114 |
0.175 (1.00) |
0.0498 (1.00) |
0.753 (1.00) |
0.911 (1.00) |
2.56e-11 (7.19e-09) |
0.00824 (1.00) |
| 22q loss | 13 (7%) | 165 |
1.61e-05 (0.00443) |
0.692 (1.00) |
0.562 (1.00) |
0.181 (1.00) |
0.00786 (1.00) |
0.264 (1.00) |
| 1p gain | 6 (3%) | 172 |
0.00803 (1.00) |
0.171 (1.00) |
0.085 (1.00) |
0.167 (1.00) |
0.0221 (1.00) |
1 (1.00) |
| 1q gain | 8 (4%) | 170 |
0.289 (1.00) |
0.00482 (1.00) |
0.289 (1.00) |
0.558 (1.00) |
0.486 (1.00) |
0.727 (1.00) |
| 7p gain | 31 (17%) | 147 |
0.0119 (1.00) |
0.0904 (1.00) |
0.0722 (1.00) |
0.992 (1.00) |
0.184 (1.00) |
0.113 (1.00) |
| 7q gain | 43 (24%) | 135 |
0.0189 (1.00) |
0.00311 (0.82) |
0.218 (1.00) |
0.665 (1.00) |
0.273 (1.00) |
0.22 (1.00) |
| 8p gain | 12 (7%) | 166 |
0.702 (1.00) |
0.859 (1.00) |
0.56 (1.00) |
0.652 (1.00) |
0.281 (1.00) |
0.0391 (1.00) |
| 8q gain | 15 (8%) | 163 |
0.932 (1.00) |
0.434 (1.00) |
1 (1.00) |
0.599 (1.00) |
0.097 (1.00) |
0.175 (1.00) |
| 9p gain | 4 (2%) | 174 |
0.17 (1.00) |
0.00546 (1.00) |
0.314 (1.00) |
0.819 (1.00) |
1 (1.00) |
|
| 9q gain | 4 (2%) | 174 |
0.0627 (1.00) |
0.0911 (1.00) |
0.314 (1.00) |
0.167 (1.00) |
0.219 (1.00) |
0.625 (1.00) |
| 10p gain | 18 (10%) | 160 |
0.454 (1.00) |
0.026 (1.00) |
0.215 (1.00) |
0.109 (1.00) |
0.395 (1.00) |
0.135 (1.00) |
| 11p gain | 9 (5%) | 169 |
0.606 (1.00) |
0.278 (1.00) |
1 (1.00) |
0.737 (1.00) |
0.467 (1.00) |
1 (1.00) |
| 11q gain | 13 (7%) | 165 |
0.765 (1.00) |
0.186 (1.00) |
0.562 (1.00) |
0.59 (1.00) |
0.817 (1.00) |
0.774 (1.00) |
| 12p gain | 9 (5%) | 169 |
0.761 (1.00) |
0.00201 (0.533) |
0.0108 (1.00) |
0.686 (1.00) |
1 (1.00) |
|
| 18p gain | 4 (2%) | 174 |
0.555 (1.00) |
0.753 (1.00) |
0.314 (1.00) |
0.219 (1.00) |
0.336 (1.00) |
|
| 19p gain | 8 (4%) | 170 |
0.182 (1.00) |
0.0121 (1.00) |
0.469 (1.00) |
0.0611 (1.00) |
0.332 (1.00) |
0.0709 (1.00) |
| 21q gain | 4 (2%) | 174 |
0.291 (1.00) |
0.964 (1.00) |
0.637 (1.00) |
0.469 (1.00) |
0.625 (1.00) |
|
| 1q loss | 7 (4%) | 171 |
0.497 (1.00) |
0.0369 (1.00) |
0.462 (1.00) |
0.114 (1.00) |
0.00523 (1.00) |
1 (1.00) |
| 2p loss | 4 (2%) | 174 |
0.0729 (1.00) |
0.67 (1.00) |
0.637 (1.00) |
0.686 (1.00) |
0.625 (1.00) |
|
| 2q loss | 3 (2%) | 175 |
0.521 (1.00) |
0.186 (1.00) |
0.262 (1.00) |
0.112 (1.00) |
0.595 (1.00) |
|
| 3q loss | 9 (5%) | 169 |
0.619 (1.00) |
0.863 (1.00) |
0.734 (1.00) |
0.223 (1.00) |
0.427 (1.00) |
1 (1.00) |
| 4p loss | 15 (8%) | 163 |
0.121 (1.00) |
0.255 (1.00) |
0.276 (1.00) |
0.554 (1.00) |
0.061 (1.00) |
0.289 (1.00) |
| 4q loss | 24 (13%) | 154 |
0.0928 (1.00) |
0.864 (1.00) |
0.661 (1.00) |
0.383 (1.00) |
0.273 (1.00) |
0.271 (1.00) |
| 5p loss | 10 (6%) | 168 |
0.242 (1.00) |
0.99 (1.00) |
0.52 (1.00) |
0.209 (1.00) |
0.00573 (1.00) |
0.345 (1.00) |
| 5q loss | 7 (4%) | 171 |
0.0138 (1.00) |
0.82 (1.00) |
0.462 (1.00) |
0.167 (1.00) |
0.374 (1.00) |
0.126 (1.00) |
| 6q loss | 19 (11%) | 159 |
0.00578 (1.00) |
0.134 (1.00) |
0.463 (1.00) |
0.185 (1.00) |
0.0305 (1.00) |
0.00633 (1.00) |
| 9p loss | 34 (19%) | 144 |
0.00826 (1.00) |
0.0866 (1.00) |
1 (1.00) |
0.57 (1.00) |
0.087 (1.00) |
0.0039 (1.00) |
| 9q loss | 6 (3%) | 172 |
0.918 (1.00) |
0.116 (1.00) |
0.404 (1.00) |
0.609 (1.00) |
0.576 (1.00) |
0.416 (1.00) |
| 11p loss | 17 (10%) | 161 |
0.13 (1.00) |
0.167 (1.00) |
0.798 (1.00) |
0.826 (1.00) |
0.00156 (0.415) |
0.202 (1.00) |
| 11q loss | 4 (2%) | 174 |
0.00128 (0.343) |
0.0652 (1.00) |
0.314 (1.00) |
0.219 (1.00) |
0.625 (1.00) |
|
| 12q loss | 8 (4%) | 170 |
0.428 (1.00) |
0.887 (1.00) |
0.725 (1.00) |
0.852 (1.00) |
0.238 (1.00) |
0.727 (1.00) |
| 13q loss | 27 (15%) | 151 |
0.229 (1.00) |
0.4 (1.00) |
0.836 (1.00) |
0.86 (1.00) |
1 (1.00) |
0.402 (1.00) |
| 14q loss | 21 (12%) | 157 |
0.00187 (0.498) |
0.0189 (1.00) |
0.0324 (1.00) |
0.481 (1.00) |
0.148 (1.00) |
0.353 (1.00) |
| 15q loss | 11 (6%) | 167 |
0.266 (1.00) |
0.575 (1.00) |
0.357 (1.00) |
0.807 (1.00) |
0.0536 (1.00) |
0.115 (1.00) |
| 16q loss | 6 (3%) | 172 |
0.998 (1.00) |
0.178 (1.00) |
0.701 (1.00) |
0.88 (1.00) |
0.22 (1.00) |
|
| 18p loss | 13 (7%) | 165 |
0.611 (1.00) |
0.245 (1.00) |
0.781 (1.00) |
0.491 (1.00) |
0.353 (1.00) |
1 (1.00) |
| 18q loss | 15 (8%) | 163 |
0.749 (1.00) |
0.37 (1.00) |
0.423 (1.00) |
0.713 (1.00) |
0.13 (1.00) |
0.788 (1.00) |
| 19p loss | 6 (3%) | 172 |
0.902 (1.00) |
0.625 (1.00) |
0.701 (1.00) |
0.114 (1.00) |
0.287 (1.00) |
1 (1.00) |
| 21q loss | 5 (3%) | 173 |
0.958 (1.00) |
0.79 (1.00) |
1 (1.00) |
0.449 (1.00) |
1 (1.00) |
|
| Xq loss | 4 (2%) | 174 |
0.333 (1.00) |
0.608 (1.00) |
1 (1.00) |
0.787 (1.00) |
0.125 (1.00) |
P value = 2.67e-05 (t-test), Q value = 0.0073
Table S1. Gene #13: '12q gain mutation analysis' versus Clinical Feature #2: 'AGE'
| nPatients | Mean (Std.Dev) | |
|---|---|---|
| ALL | 178 | 43.1 (13.4) |
| 12Q GAIN MUTATED | 4 | 31.2 (2.4) |
| 12Q GAIN WILD-TYPE | 174 | 43.4 (13.4) |
Figure S1. Get High-res Image Gene #13: '12q gain mutation analysis' versus Clinical Feature #2: 'AGE'
P value = 0.000486 (logrank test), Q value = 0.13
Table S2. Gene #16: '19q gain mutation analysis' versus Clinical Feature #1: 'Time to Death'
| nPatients | nDeath | Duration Range (Median), Month | |
|---|---|---|---|
| ALL | 177 | 50 | 0.0 - 211.2 (14.7) |
| 19Q GAIN MUTATED | 6 | 4 | 4.1 - 26.3 (17.2) |
| 19Q GAIN WILD-TYPE | 171 | 46 | 0.0 - 211.2 (14.5) |
Figure S2. Get High-res Image Gene #16: '19q gain mutation analysis' versus Clinical Feature #1: 'Time to Death'
P value = 0.000193 (logrank test), Q value = 0.052
Table S3. Gene #17: '20p gain mutation analysis' versus Clinical Feature #1: 'Time to Death'
| nPatients | nDeath | Duration Range (Median), Month | |
|---|---|---|---|
| ALL | 177 | 50 | 0.0 - 211.2 (14.7) |
| 20P GAIN MUTATED | 15 | 7 | 3.8 - 41.1 (16.8) |
| 20P GAIN WILD-TYPE | 162 | 43 | 0.0 - 211.2 (14.5) |
Figure S3. Get High-res Image Gene #17: '20p gain mutation analysis' versus Clinical Feature #1: 'Time to Death'
P value = 0.000463 (logrank test), Q value = 0.13
Table S4. Gene #18: '20q gain mutation analysis' versus Clinical Feature #1: 'Time to Death'
| nPatients | nDeath | Duration Range (Median), Month | |
|---|---|---|---|
| ALL | 177 | 50 | 0.0 - 211.2 (14.7) |
| 20Q GAIN MUTATED | 13 | 6 | 4.7 - 41.1 (15.3) |
| 20Q GAIN WILD-TYPE | 164 | 44 | 0.0 - 211.2 (14.6) |
Figure S4. Get High-res Image Gene #18: '20q gain mutation analysis' versus Clinical Feature #1: 'Time to Death'
P value = 3.64e-15 (Fisher's exact test), Q value = 1e-12
Table S5. Gene #20: '1p loss mutation analysis' versus Clinical Feature #5: 'HISTOLOGICAL.TYPE'
| nPatients | ASTROCYTOMA | OLIGOASTROCYTOMA | OLIGODENDROGLIOMA |
|---|---|---|---|
| ALL | 55 | 47 | 75 |
| 1P LOSS MUTATED | 2 | 6 | 47 |
| 1P LOSS WILD-TYPE | 53 | 41 | 28 |
Figure S5. Get High-res Image Gene #20: '1p loss mutation analysis' versus Clinical Feature #5: 'HISTOLOGICAL.TYPE'
P value = 0.000625 (Fisher's exact test), Q value = 0.17
Table S6. Gene #20: '1p loss mutation analysis' versus Clinical Feature #6: 'RADIATIONS.RADIATION.REGIMENINDICATION'
| nPatients | NO | YES |
|---|---|---|
| ALL | 96 | 82 |
| 1P LOSS MUTATED | 19 | 36 |
| 1P LOSS WILD-TYPE | 77 | 46 |
Figure S6. Get High-res Image Gene #20: '1p loss mutation analysis' versus Clinical Feature #6: 'RADIATIONS.RADIATION.REGIMENINDICATION'
P value = 5.59e-06 (t-test), Q value = 0.0015
Table S7. Gene #24: '3p loss mutation analysis' versus Clinical Feature #2: 'AGE'
| nPatients | Mean (Std.Dev) | |
|---|---|---|
| ALL | 178 | 43.1 (13.4) |
| 3P LOSS MUTATED | 4 | 31.0 (2.2) |
| 3P LOSS WILD-TYPE | 174 | 43.4 (13.4) |
Figure S7. Get High-res Image Gene #24: '3p loss mutation analysis' versus Clinical Feature #2: 'AGE'
P value = 0.000146 (logrank test), Q value = 0.04
Table S8. Gene #30: '6p loss mutation analysis' versus Clinical Feature #1: 'Time to Death'
| nPatients | nDeath | Duration Range (Median), Month | |
|---|---|---|---|
| ALL | 177 | 50 | 0.0 - 211.2 (14.7) |
| 6P LOSS MUTATED | 5 | 2 | 3.0 - 13.4 (6.4) |
| 6P LOSS WILD-TYPE | 172 | 48 | 0.0 - 211.2 (15.2) |
Figure S8. Get High-res Image Gene #30: '6p loss mutation analysis' versus Clinical Feature #1: 'Time to Death'
P value = 9.19e-11 (logrank test), Q value = 2.6e-08
Table S9. Gene #34: '10p loss mutation analysis' versus Clinical Feature #1: 'Time to Death'
| nPatients | nDeath | Duration Range (Median), Month | |
|---|---|---|---|
| ALL | 177 | 50 | 0.0 - 211.2 (14.7) |
| 10P LOSS MUTATED | 26 | 17 | 0.1 - 134.3 (8.6) |
| 10P LOSS WILD-TYPE | 151 | 33 | 0.0 - 211.2 (15.8) |
Figure S9. Get High-res Image Gene #34: '10p loss mutation analysis' versus Clinical Feature #1: 'Time to Death'

P value = 1.95e-06 (t-test), Q value = 0.00054
Table S10. Gene #34: '10p loss mutation analysis' versus Clinical Feature #2: 'AGE'
| nPatients | Mean (Std.Dev) | |
|---|---|---|
| ALL | 178 | 43.1 (13.4) |
| 10P LOSS MUTATED | 26 | 54.8 (11.1) |
| 10P LOSS WILD-TYPE | 152 | 41.2 (12.8) |
Figure S10. Get High-res Image Gene #34: '10p loss mutation analysis' versus Clinical Feature #2: 'AGE'
P value = 2.08e-10 (logrank test), Q value = 5.8e-08
Table S11. Gene #35: '10q loss mutation analysis' versus Clinical Feature #1: 'Time to Death'
| nPatients | nDeath | Duration Range (Median), Month | |
|---|---|---|---|
| ALL | 177 | 50 | 0.0 - 211.2 (14.7) |
| 10Q LOSS MUTATED | 27 | 17 | 0.1 - 134.3 (8.8) |
| 10Q LOSS WILD-TYPE | 150 | 33 | 0.0 - 211.2 (16.0) |
Figure S11. Get High-res Image Gene #35: '10q loss mutation analysis' versus Clinical Feature #1: 'Time to Death'
P value = 1.03e-06 (t-test), Q value = 0.00029
Table S12. Gene #35: '10q loss mutation analysis' versus Clinical Feature #2: 'AGE'
| nPatients | Mean (Std.Dev) | |
|---|---|---|
| ALL | 178 | 43.1 (13.4) |
| 10Q LOSS MUTATED | 27 | 54.6 (10.9) |
| 10Q LOSS WILD-TYPE | 151 | 41.1 (12.8) |
Figure S12. Get High-res Image Gene #35: '10q loss mutation analysis' versus Clinical Feature #2: 'AGE'
P value = 2.56e-11 (Fisher's exact test), Q value = 7.2e-09
Table S13. Gene #46: '19q loss mutation analysis' versus Clinical Feature #5: 'HISTOLOGICAL.TYPE'
| nPatients | ASTROCYTOMA | OLIGOASTROCYTOMA | OLIGODENDROGLIOMA |
|---|---|---|---|
| ALL | 55 | 47 | 75 |
| 19Q LOSS MUTATED | 8 | 7 | 49 |
| 19Q LOSS WILD-TYPE | 47 | 40 | 26 |
Figure S13. Get High-res Image Gene #46: '19q loss mutation analysis' versus Clinical Feature #5: 'HISTOLOGICAL.TYPE'
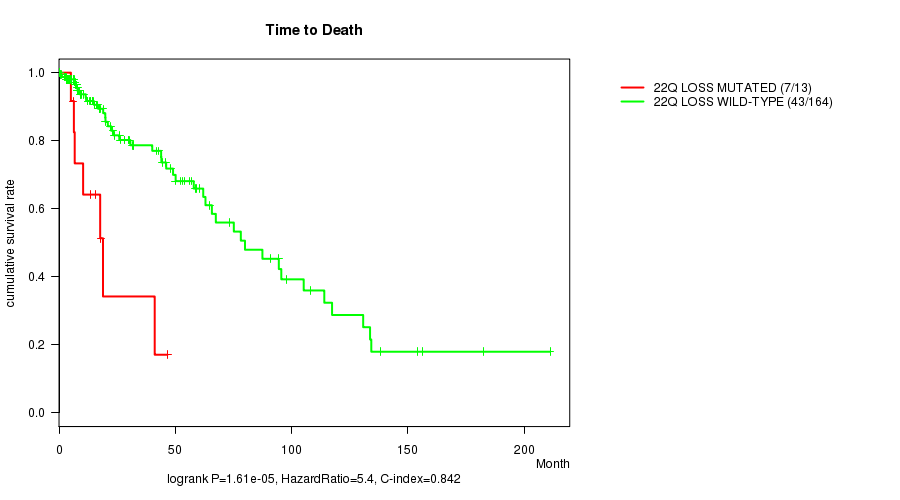
P value = 1.61e-05 (logrank test), Q value = 0.0044
Table S14. Gene #48: '22q loss mutation analysis' versus Clinical Feature #1: 'Time to Death'
| nPatients | nDeath | Duration Range (Median), Month | |
|---|---|---|---|
| ALL | 177 | 50 | 0.0 - 211.2 (14.7) |
| 22Q LOSS MUTATED | 13 | 7 | 0.1 - 46.6 (13.4) |
| 22Q LOSS WILD-TYPE | 164 | 43 | 0.0 - 211.2 (14.8) |
Figure S14. Get High-res Image Gene #48: '22q loss mutation analysis' versus Clinical Feature #1: 'Time to Death'
-
Mutation data file = broad_values_by_arm.mutsig.cluster.txt
-
Clinical data file = LGG-TP.clin.merged.picked.txt
-
Number of patients = 178
-
Number of significantly arm-level cnvs = 49
-
Number of selected clinical features = 6
-
Exclude genes that fewer than K tumors have mutations, K = 3
For survival clinical features, the Kaplan-Meier survival curves of tumors with and without gene mutations were plotted and the statistical significance P values were estimated by logrank test (Bland and Altman 2004) using the 'survdiff' function in R
For continuous numerical clinical features, two-tailed Student's t test with unequal variance (Lehmann and Romano 2005) was applied to compare the clinical values between tumors with and without gene mutations using 't.test' function in R
For binary or multi-class clinical features (nominal or ordinal), two-tailed Fisher's exact tests (Fisher 1922) were used to estimate the P values using the 'fisher.test' function in R
For multiple hypothesis correction, Q value is the False Discovery Rate (FDR) analogue of the P value (Benjamini and Hochberg 1995), defined as the minimum FDR at which the test may be called significant. We used the 'Benjamini and Hochberg' method of 'p.adjust' function in R to convert P values into Q values.
This is an experimental feature. The full results of the analysis summarized in this report can be downloaded from the TCGA Data Coordination Center.