(primary solid tumor cohort)
This pipeline uses various statistical tests to identify mRNAs whose expression levels correlated to selected clinical features.
Testing the association between 18308 genes and 6 clinical features across 110 samples, statistically thresholded by Q value < 0.05, 5 clinical features related to at least one genes.
-
100 genes correlated to 'Time to Death'.
-
PGAM1|5223 , CBARA1|10367 , CCNY|219771 , PPA1|5464 , CUEDC2|79004 , ...
-
13 genes correlated to 'AGE'.
-
TRMT2B|79979 , SAR1A|56681 , NBL1|4681 , CCNY|219771 , CDC123|8872 , ...
-
23 genes correlated to 'GENDER'.
-
XIST|7503 , ZFY|7544 , PRKY|5616 , RPS4Y1|6192 , KDM5D|8284 , ...
-
1138 genes correlated to 'HISTOLOGICAL.TYPE'.
-
AK2|204 , LRRC42|115353 , TXNDC12|51060 , ZNF691|51058 , TMEM69|51249 , ...
-
31 genes correlated to 'RADIATIONS.RADIATION.REGIMENINDICATION'.
-
C9ORF93|203238 , LMBRD2|92255 , SLC25A46|91137 , ZDHHC21|340481 , POLR2J|5439 , ...
-
No genes correlated to 'KARNOFSKY.PERFORMANCE.SCORE'
Complete statistical result table is provided in Supplement Table 1
Table 1. Get Full Table This table shows the clinical features, statistical methods used, and the number of genes that are significantly associated with each clinical feature at Q value < 0.05.
| Clinical feature | Statistical test | Significant genes | Associated with | Associated with | ||
|---|---|---|---|---|---|---|
| Time to Death | Cox regression test | N=100 | shorter survival | N=24 | longer survival | N=76 |
| AGE | Spearman correlation test | N=13 | older | N=1 | younger | N=12 |
| GENDER | t test | N=23 | male | N=15 | female | N=8 |
| KARNOFSKY PERFORMANCE SCORE | Spearman correlation test | N=0 | ||||
| HISTOLOGICAL TYPE | ANOVA test | N=1138 | ||||
| RADIATIONS RADIATION REGIMENINDICATION | t test | N=31 | yes | N=20 | no | N=11 |
Table S1. Basic characteristics of clinical feature: 'Time to Death'
| Time to Death | Duration (Months) | 0-211.2 (median=19) |
| censored | N = 69 | |
| death | N = 41 | |
| Significant markers | N = 100 | |
| associated with shorter survival | 24 | |
| associated with longer survival | 76 |
Table S2. Get Full Table List of top 10 genes significantly associated with 'Time to Death' by Cox regression test
| HazardRatio | Wald_P | Q | C_index | |
|---|---|---|---|---|
| PGAM1|5223 | 0.15 | 6.68e-09 | 0.00012 | 0.214 |
| CBARA1|10367 | 0.12 | 7.695e-09 | 0.00014 | 0.257 |
| CCNY|219771 | 0.07 | 1e-08 | 0.00018 | 0.226 |
| PPA1|5464 | 0.14 | 1.253e-08 | 0.00023 | 0.25 |
| CUEDC2|79004 | 0.08 | 1.67e-08 | 0.00031 | 0.261 |
| ZRANB1|54764 | 0.13 | 1.819e-08 | 0.00033 | 0.223 |
| CGREF1|10669 | 0.4 | 2.253e-08 | 0.00041 | 0.308 |
| ARL3|403 | 0.15 | 2.536e-08 | 0.00046 | 0.209 |
| SLITRK5|26050 | 0.33 | 2.869e-08 | 0.00052 | 0.284 |
| LOC254559|254559 | 0.5 | 3.272e-08 | 6e-04 | 0.283 |
Figure S1. Get High-res Image As an example, this figure shows the association of PGAM1|5223 to 'Time to Death'. four curves present the cumulative survival rates of 4 quartile subsets of patients. P value = 6.68e-09 with univariate Cox regression analysis using continuous log-2 expression values.
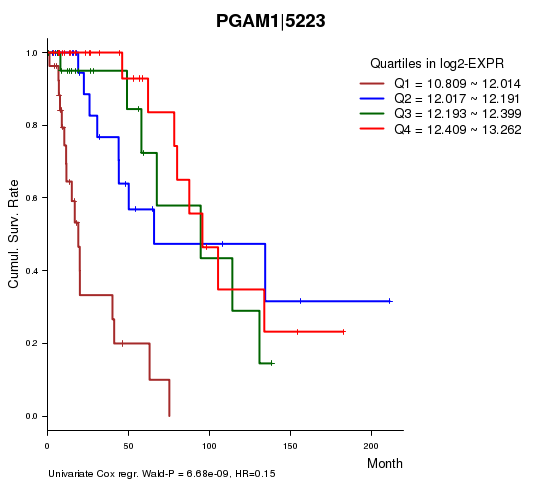
Table S3. Basic characteristics of clinical feature: 'AGE'
| AGE | Mean (SD) | 42.95 (13) |
| Significant markers | N = 13 | |
| pos. correlated | 1 | |
| neg. correlated | 12 |
Table S4. Get Full Table List of top 10 genes significantly correlated to 'AGE' by Spearman correlation test
| SpearmanCorr | corrP | Q | |
|---|---|---|---|
| TRMT2B|79979 | 0.4893 | 5.819e-08 | 0.00107 |
| SAR1A|56681 | -0.4886 | 6.138e-08 | 0.00112 |
| NBL1|4681 | -0.4805 | 1.079e-07 | 0.00198 |
| CCNY|219771 | -0.4796 | 1.149e-07 | 0.0021 |
| CDC123|8872 | -0.4768 | 1.393e-07 | 0.00255 |
| RBM17|84991 | -0.4692 | 2.339e-07 | 0.00428 |
| DTX4|23220 | -0.4663 | 2.834e-07 | 0.00519 |
| MKX|283078 | -0.4592 | 4.509e-07 | 0.00825 |
| LOC100128292|100128292 | -0.4565 | 5.363e-07 | 0.00981 |
| OTUD1|220213 | -0.4491 | 8.621e-07 | 0.0158 |
Figure S2. Get High-res Image As an example, this figure shows the association of TRMT2B|79979 to 'AGE'. P value = 5.82e-08 with Spearman correlation analysis. The straight line presents the best linear regression.
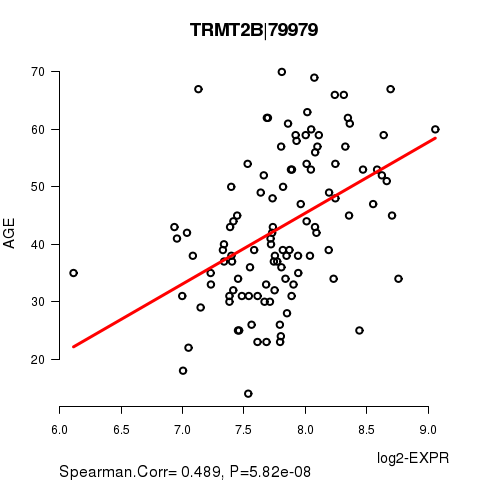
Table S5. Basic characteristics of clinical feature: 'GENDER'
| GENDER | Labels | N |
| FEMALE | 50 | |
| MALE | 60 | |
| Significant markers | N = 23 | |
| Higher in MALE | 15 | |
| Higher in FEMALE | 8 |
Table S6. Get Full Table List of top 10 genes differentially expressed by 'GENDER'
| T(pos if higher in 'MALE') | ttestP | Q | AUC | |
|---|---|---|---|---|
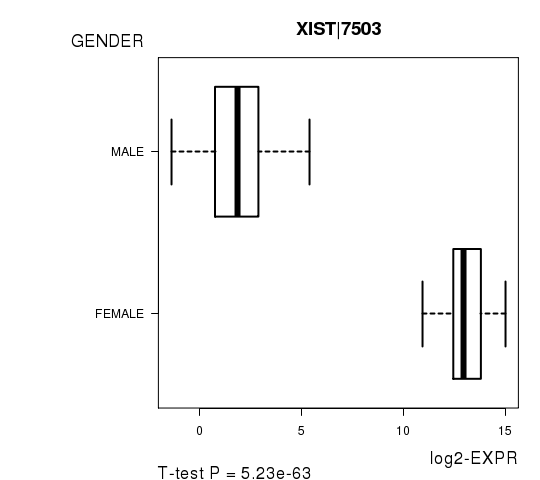
| XIST|7503 | -39.21 | 5.231e-63 | 9.57e-59 | 1 |
| ZFY|7544 | 47.2 | 2.525e-59 | 4.62e-55 | 1 |
| PRKY|5616 | 25.31 | 2.249e-43 | 4.12e-39 | 0.9996 |
| RPS4Y1|6192 | 38.96 | 4.013e-42 | 7.34e-38 | 1 |
| KDM5D|8284 | 52.17 | 6.693e-39 | 1.22e-34 | 1 |
| NLGN4Y|22829 | 24.17 | 1.097e-37 | 2.01e-33 | 0.9966 |
| TSIX|9383 | -20.98 | 9.775e-37 | 1.79e-32 | 1 |
| USP9Y|8287 | 45.68 | 8.53e-33 | 1.56e-28 | 1 |
| DDX3Y|8653 | 46.36 | 4.11e-32 | 7.52e-28 | 1 |
| EIF1AY|9086 | 44.86 | 4.043e-19 | 7.4e-15 | 1 |
Figure S3. Get High-res Image As an example, this figure shows the association of XIST|7503 to 'GENDER'. P value = 5.23e-63 with T-test analysis.
No gene related to 'KARNOFSKY.PERFORMANCE.SCORE'.
Table S7. Basic characteristics of clinical feature: 'KARNOFSKY.PERFORMANCE.SCORE'
| KARNOFSKY.PERFORMANCE.SCORE | Mean (SD) | 88.62 (11) |
| Score | N | |
| 50 | 2 | |
| 70 | 3 | |
| 80 | 10 | |
| 90 | 27 | |
| 100 | 16 | |
| Significant markers | N = 0 |
Table S8. Basic characteristics of clinical feature: 'HISTOLOGICAL.TYPE'
| HISTOLOGICAL.TYPE | Labels | N |
| ASTROCYTOMA | 36 | |
| OLIGOASTROCYTOMA | 27 | |
| OLIGODENDROGLIOMA | 46 | |
| Significant markers | N = 1138 |
Table S9. Get Full Table List of top 10 genes differentially expressed by 'HISTOLOGICAL.TYPE'
| ANOVA_P | Q | |
|---|---|---|
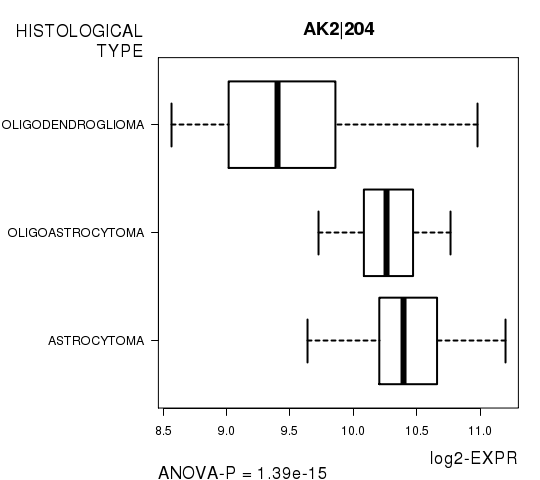
| AK2|204 | 1.386e-15 | 2.54e-11 |
| LRRC42|115353 | 4.533e-15 | 8.3e-11 |
| TXNDC12|51060 | 4.792e-15 | 8.77e-11 |
| ZNF691|51058 | 1.226e-14 | 2.24e-10 |
| TMEM69|51249 | 2.538e-14 | 4.65e-10 |
| FPGT|8790 | 5.019e-14 | 9.19e-10 |
| ADPRHL2|54936 | 5.25e-14 | 9.61e-10 |
| TAF12|6883 | 5.598e-14 | 1.02e-09 |
| TRAPPC3|27095 | 5.733e-14 | 1.05e-09 |
| CAP1|10487 | 6.023e-14 | 1.1e-09 |
Figure S4. Get High-res Image As an example, this figure shows the association of AK2|204 to 'HISTOLOGICAL.TYPE'. P value = 1.39e-15 with ANOVA analysis.
31 genes related to 'RADIATIONS.RADIATION.REGIMENINDICATION'.
Table S10. Basic characteristics of clinical feature: 'RADIATIONS.RADIATION.REGIMENINDICATION'
| RADIATIONS.RADIATION.REGIMENINDICATION | Labels | N |
| NO | 66 | |
| YES | 44 | |
| Significant markers | N = 31 | |
| Higher in YES | 20 | |
| Higher in NO | 11 |
Table S11. Get Full Table List of top 10 genes differentially expressed by 'RADIATIONS.RADIATION.REGIMENINDICATION'
| T(pos if higher in 'YES') | ttestP | Q | AUC | |
|---|---|---|---|---|
| C9ORF93|203238 | 5.95 | 3.383e-08 | 0.000619 | 0.8034 |
| LMBRD2|92255 | 5.89 | 4.679e-08 | 0.000857 | 0.7837 |
| SLC25A46|91137 | 5.64 | 1.444e-07 | 0.00264 | 0.7738 |
| ZDHHC21|340481 | 5.59 | 1.753e-07 | 0.00321 | 0.7855 |
| POLR2J|5439 | -5.61 | 1.786e-07 | 0.00327 | 0.7724 |
| TTBK2|146057 | 5.54 | 2.397e-07 | 0.00439 | 0.7824 |
| ZNHIT1|10467 | -5.46 | 3.39e-07 | 0.0062 | 0.77 |
| ADAM22|53616 | 5.43 | 3.525e-07 | 0.00645 | 0.7769 |
| PTPN4|5775 | 5.37 | 4.716e-07 | 0.00863 | 0.7603 |
| MYCBP2|23077 | 5.3 | 6.736e-07 | 0.0123 | 0.7534 |
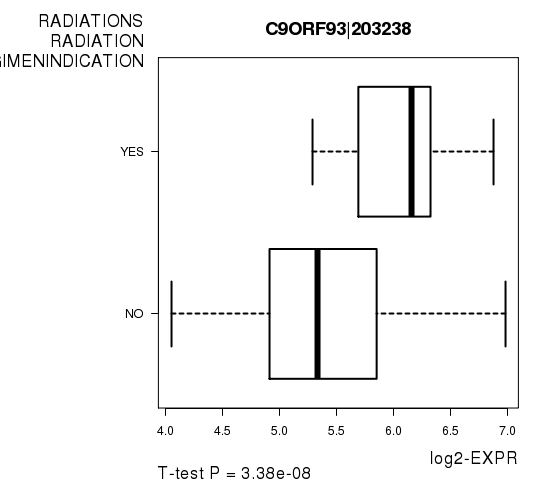
Figure S5. Get High-res Image As an example, this figure shows the association of C9ORF93|203238 to 'RADIATIONS.RADIATION.REGIMENINDICATION'. P value = 3.38e-08 with T-test analysis.
-
Expresson data file = LGG-TP.uncv2.mRNAseq_RSEM_normalized_log2.txt
-
Clinical data file = LGG-TP.clin.merged.picked.txt
-
Number of patients = 110
-
Number of genes = 18308
-
Number of clinical features = 6
For survival clinical features, Wald's test in univariate Cox regression analysis with proportional hazards model (Andersen and Gill 1982) was used to estimate the P values using the 'coxph' function in R. Kaplan-Meier survival curves were plot using the four quartile subgroups of patients based on expression levels
For continuous numerical clinical features, Spearman's rank correlation coefficients (Spearman 1904) and two-tailed P values were estimated using 'cor.test' function in R
For two-class clinical features, two-tailed Student's t test with unequal variance (Lehmann and Romano 2005) was applied to compare the log2-expression levels between the two clinical classes using 't.test' function in R
For multi-class clinical features (ordinal or nominal), one-way analysis of variance (Howell 2002) was applied to compare the log2-expression levels between different clinical classes using 'anova' function in R
For multiple hypothesis correction, Q value is the False Discovery Rate (FDR) analogue of the P value (Benjamini and Hochberg 1995), defined as the minimum FDR at which the test may be called significant. We used the 'Benjamini and Hochberg' method of 'p.adjust' function in R to convert P values into Q values.
This is an experimental feature. The full results of the analysis summarized in this report can be downloaded from the TCGA Data Coordination Center.