(primary solid tumor cohort)
This pipeline uses various statistical tests to identify genes whose promoter methylation levels correlated to selected clinical features.
Testing the association between 17352 genes and 6 clinical features across 104 samples, statistically thresholded by Q value < 0.05, 4 clinical features related to at least one genes.
-
163 genes correlated to 'Time to Death'.
-
LOC254559 , HS3ST4 , SYNPR , HPD , ZNF492 , ...
-
22 genes correlated to 'AGE'.
-
PAX9 , ADAMTSL3 , RAB11FIP1 , FAM83H , RAB6C , ...
-
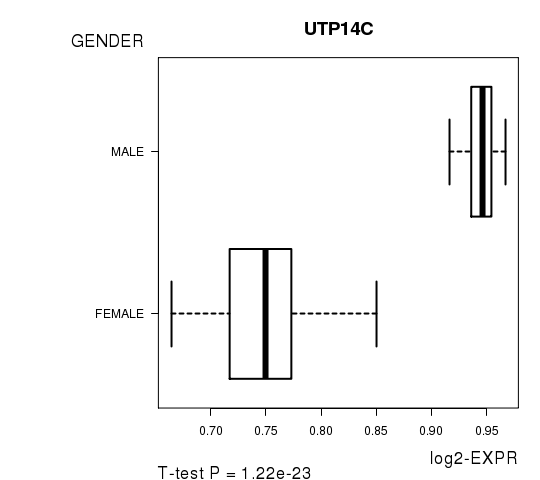
7 genes correlated to 'GENDER'.
-
UTP14C , POLDIP3 , FDPS , GLUD1 , ATAD5 , ...
-
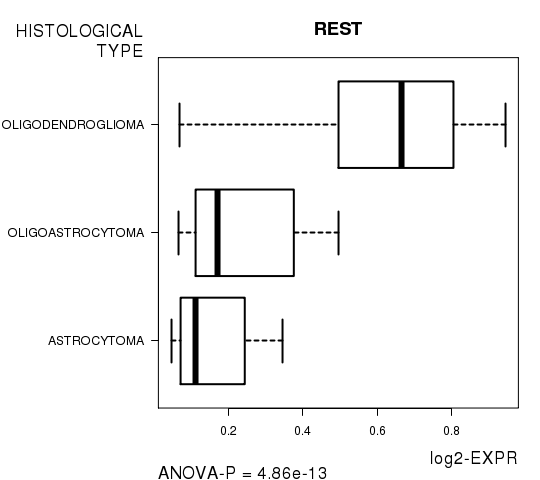
249 genes correlated to 'HISTOLOGICAL.TYPE'.
-
REST , BVES , SMAD6 , KDM4A , SNAPC2 , ...
-
No genes correlated to 'KARNOFSKY.PERFORMANCE.SCORE', and 'RADIATIONS.RADIATION.REGIMENINDICATION'.
Complete statistical result table is provided in Supplement Table 1
Table 1. Get Full Table This table shows the clinical features, statistical methods used, and the number of genes that are significantly associated with each clinical feature at Q value < 0.05.
| Clinical feature | Statistical test | Significant genes | Associated with | Associated with | ||
|---|---|---|---|---|---|---|
| Time to Death | Cox regression test | N=163 | shorter survival | N=32 | longer survival | N=131 |
| AGE | Spearman correlation test | N=22 | older | N=20 | younger | N=2 |
| GENDER | t test | N=7 | male | N=4 | female | N=3 |
| KARNOFSKY PERFORMANCE SCORE | Spearman correlation test | N=0 | ||||
| HISTOLOGICAL TYPE | ANOVA test | N=249 | ||||
| RADIATIONS RADIATION REGIMENINDICATION | t test | N=0 |
Table S1. Basic characteristics of clinical feature: 'Time to Death'
| Time to Death | Duration (Months) | 0-211.2 (median=18.9) |
| censored | N = 69 | |
| death | N = 35 | |
| Significant markers | N = 163 | |
| associated with shorter survival | 32 | |
| associated with longer survival | 131 |
Table S2. Get Full Table List of top 10 genes significantly associated with 'Time to Death' by Cox regression test
| HazardRatio | Wald_P | Q | C_index | |
|---|---|---|---|---|
| LOC254559 | 5101 | 4.725e-10 | 8.2e-06 | 0.714 |
| HS3ST4 | 231 | 8.371e-10 | 1.5e-05 | 0.777 |
| SYNPR | 19001 | 7.387e-09 | 0.00013 | 0.732 |
| HPD | 0 | 1.039e-08 | 0.00018 | 0.318 |
| ZNF492 | 101 | 1.07e-08 | 0.00019 | 0.678 |
| PI15 | 0 | 1.417e-08 | 0.00025 | 0.271 |
| NEIL3 | 0 | 1.847e-08 | 0.00032 | 0.252 |
| SSTR1 | 231 | 2.361e-08 | 0.00041 | 0.738 |
| HIST3H2A | 431 | 2.551e-08 | 0.00044 | 0.734 |
| ATF3 | 0 | 2.737e-08 | 0.00047 | 0.325 |
Figure S1. Get High-res Image As an example, this figure shows the association of LOC254559 to 'Time to Death'. four curves present the cumulative survival rates of 4 quartile subsets of patients. P value = 4.72e-10 with univariate Cox regression analysis using continuous log-2 expression values.
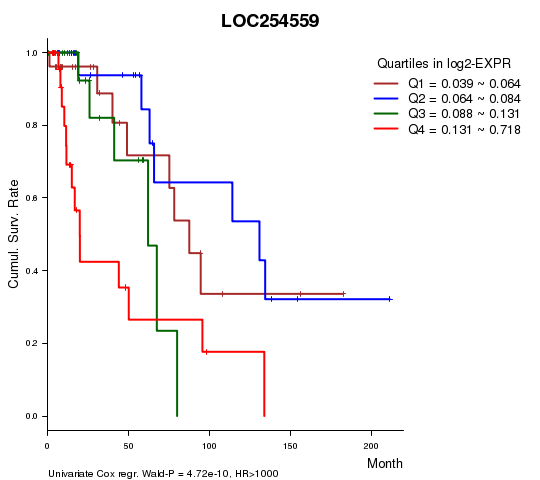
Table S3. Basic characteristics of clinical feature: 'AGE'
| AGE | Mean (SD) | 42.67 (13) |
| Significant markers | N = 22 | |
| pos. correlated | 20 | |
| neg. correlated | 2 |
Table S4. Get Full Table List of top 10 genes significantly correlated to 'AGE' by Spearman correlation test
| SpearmanCorr | corrP | Q | |
|---|---|---|---|
| PAX9 | 0.6093 | 6.749e-12 | 1.17e-07 |
| ADAMTSL3 | 0.5799 | 1.116e-10 | 1.94e-06 |
| RAB11FIP1 | 0.5486 | 1.645e-09 | 2.85e-05 |
| FAM83H | 0.5285 | 8.124e-09 | 0.000141 |
| RAB6C | 0.5271 | 9.029e-09 | 0.000157 |
| LOC150786 | 0.5208 | 1.447e-08 | 0.000251 |
| BATF2 | -0.4911 | 1.204e-07 | 0.00209 |
| SSTR4 | 0.49 | 1.295e-07 | 0.00225 |
| SLC18A2 | 0.4889 | 1.397e-07 | 0.00242 |
| GALNT14 | 0.488 | 1.483e-07 | 0.00257 |
Figure S2. Get High-res Image As an example, this figure shows the association of PAX9 to 'AGE'. P value = 6.75e-12 with Spearman correlation analysis. The straight line presents the best linear regression.
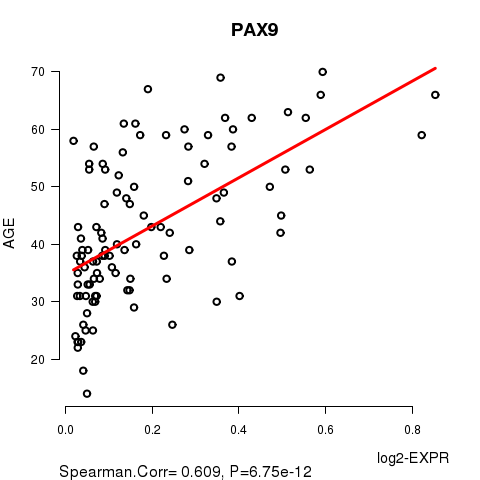
Table S5. Basic characteristics of clinical feature: 'GENDER'
| GENDER | Labels | N |
| FEMALE | 49 | |
| MALE | 55 | |
| Significant markers | N = 7 | |
| Higher in MALE | 4 | |
| Higher in FEMALE | 3 |
Table S6. Get Full Table List of 7 genes differentially expressed by 'GENDER'
| T(pos if higher in 'MALE') | ttestP | Q | AUC | |
|---|---|---|---|---|
| UTP14C | 16.39 | 1.218e-23 | 2.11e-19 | 0.9781 |
| POLDIP3 | -10.28 | 1.431e-16 | 2.48e-12 | 0.9213 |
| FDPS | 8.65 | 2.04e-13 | 3.54e-09 | 0.902 |
| GLUD1 | -7.29 | 8.352e-11 | 1.45e-06 | 0.8219 |
| ATAD5 | 6.82 | 6.646e-10 | 1.15e-05 | 0.8579 |
| TFDP1 | -5.44 | 4.306e-07 | 0.00747 | 0.8538 |
| WBP11P1 | 5.3 | 7.239e-07 | 0.0126 | 0.8048 |
Figure S3. Get High-res Image As an example, this figure shows the association of UTP14C to 'GENDER'. P value = 1.22e-23 with T-test analysis.
No gene related to 'KARNOFSKY.PERFORMANCE.SCORE'.
Table S7. Basic characteristics of clinical feature: 'KARNOFSKY.PERFORMANCE.SCORE'
| KARNOFSKY.PERFORMANCE.SCORE | Mean (SD) | 88.73 (11) |
| Score | N | |
| 50 | 2 | |
| 70 | 3 | |
| 80 | 9 | |
| 90 | 25 | |
| 100 | 16 | |
| Significant markers | N = 0 |
Table S8. Basic characteristics of clinical feature: 'HISTOLOGICAL.TYPE'
| HISTOLOGICAL.TYPE | Labels | N |
| ASTROCYTOMA | 33 | |
| OLIGOASTROCYTOMA | 26 | |
| OLIGODENDROGLIOMA | 44 | |
| Significant markers | N = 249 |
Table S9. Get Full Table List of top 10 genes differentially expressed by 'HISTOLOGICAL.TYPE'
| ANOVA_P | Q | |
|---|---|---|
| REST | 4.86e-13 | 8.43e-09 |
| BVES | 7.225e-13 | 1.25e-08 |
| SMAD6 | 1.117e-11 | 1.94e-07 |
| KDM4A | 2.154e-11 | 3.74e-07 |
| SNAPC2 | 1.255e-10 | 2.18e-06 |
| SLC2A4RG | 1.469e-10 | 2.55e-06 |
| CEPT1 | 2.598e-10 | 4.51e-06 |
| DRAM2 | 2.598e-10 | 4.51e-06 |
| NRAS | 4.566e-10 | 7.92e-06 |
| DDX20 | 4.935e-10 | 8.56e-06 |
Figure S4. Get High-res Image As an example, this figure shows the association of REST to 'HISTOLOGICAL.TYPE'. P value = 4.86e-13 with ANOVA analysis.
No gene related to 'RADIATIONS.RADIATION.REGIMENINDICATION'.
Table S10. Basic characteristics of clinical feature: 'RADIATIONS.RADIATION.REGIMENINDICATION'
| RADIATIONS.RADIATION.REGIMENINDICATION | Labels | N |
| NO | 62 | |
| YES | 42 | |
| Significant markers | N = 0 |
-
Expresson data file = LGG-TP.meth.for_correlation.filtered_data.txt
-
Clinical data file = LGG-TP.clin.merged.picked.txt
-
Number of patients = 104
-
Number of genes = 17352
-
Number of clinical features = 6
For survival clinical features, Wald's test in univariate Cox regression analysis with proportional hazards model (Andersen and Gill 1982) was used to estimate the P values using the 'coxph' function in R. Kaplan-Meier survival curves were plot using the four quartile subgroups of patients based on expression levels
For continuous numerical clinical features, Spearman's rank correlation coefficients (Spearman 1904) and two-tailed P values were estimated using 'cor.test' function in R
For two-class clinical features, two-tailed Student's t test with unequal variance (Lehmann and Romano 2005) was applied to compare the log2-expression levels between the two clinical classes using 't.test' function in R
For multi-class clinical features (ordinal or nominal), one-way analysis of variance (Howell 2002) was applied to compare the log2-expression levels between different clinical classes using 'anova' function in R
For multiple hypothesis correction, Q value is the False Discovery Rate (FDR) analogue of the P value (Benjamini and Hochberg 1995), defined as the minimum FDR at which the test may be called significant. We used the 'Benjamini and Hochberg' method of 'p.adjust' function in R to convert P values into Q values.
This is an experimental feature. The full results of the analysis summarized in this report can be downloaded from the TCGA Data Coordination Center.