(primary solid tumor cohort)
This pipeline uses various statistical tests to identify miRs whose expression levels correlated to selected clinical features.
Testing the association between 560 genes and 6 clinical features across 178 samples, statistically thresholded by Q value < 0.05, 4 clinical features related to at least one genes.
-
6 genes correlated to 'Time to Death'.
-
HSA-MIR-10A , HSA-MIR-346 , HSA-MIR-155 , HSA-MIR-15B , HSA-MIR-200B , ...
-
1 gene correlated to 'AGE'.
-
HSA-MIR-195
-
29 genes correlated to 'HISTOLOGICAL.TYPE'.
-
HSA-MIR-1262 , HSA-MIR-23A , HSA-MIR-186 , HSA-MIR-455 , HSA-MIR-3074 , ...
-
1 gene correlated to 'RADIATIONS.RADIATION.REGIMENINDICATION'.
-
HSA-MIR-1262
-
No genes correlated to 'GENDER', and 'KARNOFSKY.PERFORMANCE.SCORE'.
Complete statistical result table is provided in Supplement Table 1
Table 1. Get Full Table This table shows the clinical features, statistical methods used, and the number of genes that are significantly associated with each clinical feature at Q value < 0.05.
| Clinical feature | Statistical test | Significant genes | Associated with | Associated with | ||
|---|---|---|---|---|---|---|
| Time to Death | Cox regression test | N=6 | shorter survival | N=5 | longer survival | N=1 |
| AGE | Spearman correlation test | N=1 | older | N=1 | younger | N=0 |
| GENDER | t test | N=0 | ||||
| KARNOFSKY PERFORMANCE SCORE | Spearman correlation test | N=0 | ||||
| HISTOLOGICAL TYPE | ANOVA test | N=29 | ||||
| RADIATIONS RADIATION REGIMENINDICATION | t test | N=1 | yes | N=0 | no | N=1 |
Table S1. Basic characteristics of clinical feature: 'Time to Death'
| Time to Death | Duration (Months) | 0-211.2 (median=14.7) |
| censored | N = 128 | |
| death | N = 49 | |
| Significant markers | N = 6 | |
| associated with shorter survival | 5 | |
| associated with longer survival | 1 |
Table S2. Get Full Table List of 6 genes significantly associated with 'Time to Death' by Cox regression test
| HazardRatio | Wald_P | Q | C_index | |
|---|---|---|---|---|
| HSA-MIR-10A | 1.46 | 1.163e-08 | 6.5e-06 | 0.733 |
| HSA-MIR-346 | 0.52 | 2.484e-08 | 1.4e-05 | 0.286 |
| HSA-MIR-155 | 1.88 | 5.733e-08 | 3.2e-05 | 0.753 |
| HSA-MIR-15B | 1.71 | 8.888e-06 | 0.005 | 0.777 |
| HSA-MIR-200B | 1.68 | 4.82e-05 | 0.027 | 0.715 |
| HSA-MIR-196B | 1.18 | 7.547e-05 | 0.042 | 0.655 |
Figure S1. Get High-res Image As an example, this figure shows the association of HSA-MIR-10A to 'Time to Death'. four curves present the cumulative survival rates of 4 quartile subsets of patients. P value = 1.16e-08 with univariate Cox regression analysis using continuous log-2 expression values.
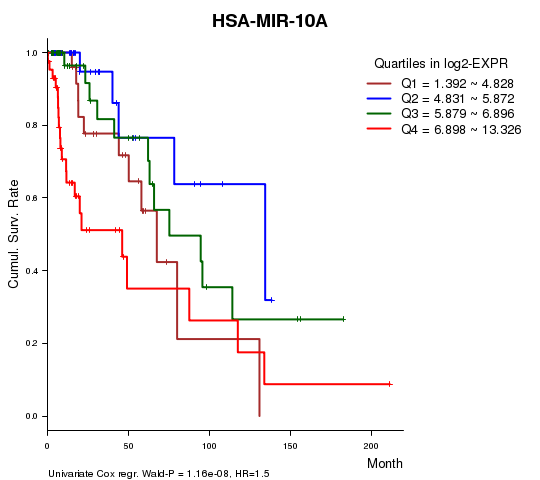
Table S3. Basic characteristics of clinical feature: 'AGE'
| AGE | Mean (SD) | 43.28 (13) |
| Significant markers | N = 1 | |
| pos. correlated | 1 | |
| neg. correlated | 0 |
Table S4. Get Full Table List of one gene significantly correlated to 'AGE' by Spearman correlation test
| SpearmanCorr | corrP | Q | |
|---|---|---|---|
| HSA-MIR-195 | 0.323 | 1.092e-05 | 0.00612 |
Figure S2. Get High-res Image As an example, this figure shows the association of HSA-MIR-195 to 'AGE'. P value = 1.09e-05 with Spearman correlation analysis. The straight line presents the best linear regression.
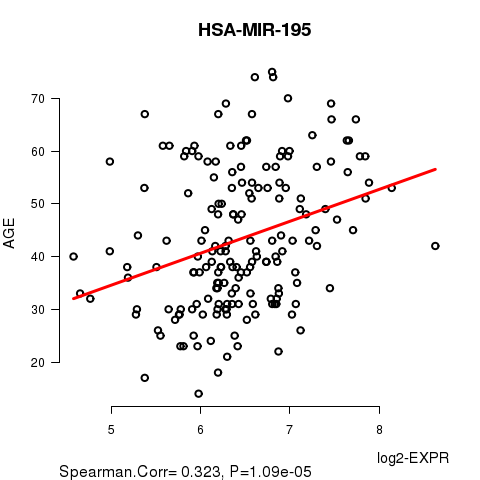
Table S5. Basic characteristics of clinical feature: 'GENDER'
| GENDER | Labels | N |
| FEMALE | 76 | |
| MALE | 102 | |
| Significant markers | N = 0 |
No gene related to 'KARNOFSKY.PERFORMANCE.SCORE'.
Table S6. Basic characteristics of clinical feature: 'KARNOFSKY.PERFORMANCE.SCORE'
| KARNOFSKY.PERFORMANCE.SCORE | Mean (SD) | 88.57 (10) |
| Significant markers | N = 0 |
Table S7. Basic characteristics of clinical feature: 'HISTOLOGICAL.TYPE'
| HISTOLOGICAL.TYPE | Labels | N |
| ASTROCYTOMA | 55 | |
| OLIGOASTROCYTOMA | 47 | |
| OLIGODENDROGLIOMA | 75 | |
| Significant markers | N = 29 |
Table S8. Get Full Table List of top 10 genes differentially expressed by 'HISTOLOGICAL.TYPE'
| ANOVA_P | Q | |
|---|---|---|
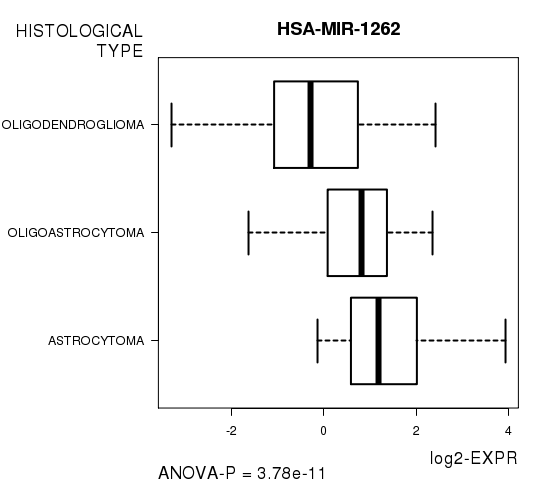
| HSA-MIR-1262 | 3.785e-11 | 2.12e-08 |
| HSA-MIR-23A | 1.901e-08 | 1.06e-05 |
| HSA-MIR-186 | 2.203e-08 | 1.23e-05 |
| HSA-MIR-455 | 6.408e-08 | 3.57e-05 |
| HSA-MIR-3074 | 1.926e-07 | 0.000107 |
| HSA-MIR-1226 | 2.41e-07 | 0.000134 |
| HSA-MIR-3127 | 4.343e-07 | 0.000241 |
| HSA-MIR-576 | 1.312e-06 | 0.000726 |
| HSA-MIR-30C-2 | 1.335e-06 | 0.000737 |
| HSA-MIR-28 | 2.475e-06 | 0.00136 |
Figure S3. Get High-res Image As an example, this figure shows the association of HSA-MIR-1262 to 'HISTOLOGICAL.TYPE'. P value = 3.78e-11 with ANOVA analysis.
One gene related to 'RADIATIONS.RADIATION.REGIMENINDICATION'.
Table S9. Basic characteristics of clinical feature: 'RADIATIONS.RADIATION.REGIMENINDICATION'
| RADIATIONS.RADIATION.REGIMENINDICATION | Labels | N |
| NO | 95 | |
| YES | 83 | |
| Significant markers | N = 1 | |
| Higher in YES | 0 | |
| Higher in NO | 1 |
Table S10. Get Full Table List of one gene differentially expressed by 'RADIATIONS.RADIATION.REGIMENINDICATION'
| T(pos if higher in 'YES') | ttestP | Q | AUC | |
|---|---|---|---|---|
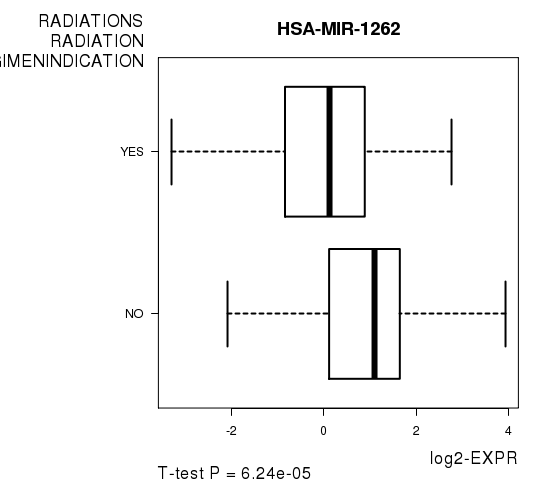
| HSA-MIR-1262 | -4.11 | 6.236e-05 | 0.0349 | 0.68 |
Figure S4. Get High-res Image As an example, this figure shows the association of HSA-MIR-1262 to 'RADIATIONS.RADIATION.REGIMENINDICATION'. P value = 6.24e-05 with T-test analysis.
-
Expresson data file = LGG-TP.miRseq_RPKM_log2.txt
-
Clinical data file = LGG-TP.clin.merged.picked.txt
-
Number of patients = 178
-
Number of genes = 560
-
Number of clinical features = 6
For survival clinical features, Wald's test in univariate Cox regression analysis with proportional hazards model (Andersen and Gill 1982) was used to estimate the P values using the 'coxph' function in R. Kaplan-Meier survival curves were plot using the four quartile subgroups of patients based on expression levels
For continuous numerical clinical features, Spearman's rank correlation coefficients (Spearman 1904) and two-tailed P values were estimated using 'cor.test' function in R
For two-class clinical features, two-tailed Student's t test with unequal variance (Lehmann and Romano 2005) was applied to compare the log2-expression levels between the two clinical classes using 't.test' function in R
For multi-class clinical features (ordinal or nominal), one-way analysis of variance (Howell 2002) was applied to compare the log2-expression levels between different clinical classes using 'anova' function in R
For multiple hypothesis correction, Q value is the False Discovery Rate (FDR) analogue of the P value (Benjamini and Hochberg 1995), defined as the minimum FDR at which the test may be called significant. We used the 'Benjamini and Hochberg' method of 'p.adjust' function in R to convert P values into Q values.
This is an experimental feature. The full results of the analysis summarized in this report can be downloaded from the TCGA Data Coordination Center.