(primary solid tumor cohort)
This pipeline computes the correlation between significantly recurrent gene mutations and selected clinical features.
Testing the association between mutation status of 51 genes and 6 clinical features across 168 patients, 10 significant findings detected with Q value < 0.25.
-
ATRX mutation correlated to 'AGE'.
-
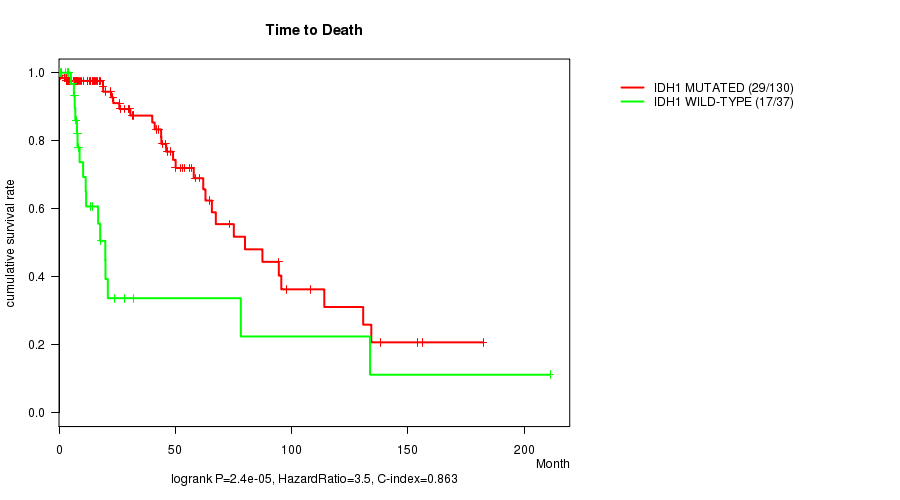
IDH1 mutation correlated to 'Time to Death'.
-
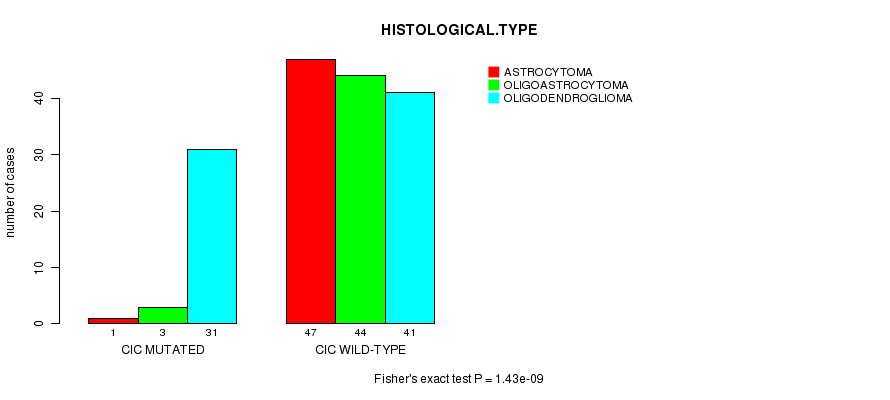
CIC mutation correlated to 'HISTOLOGICAL.TYPE'.
-
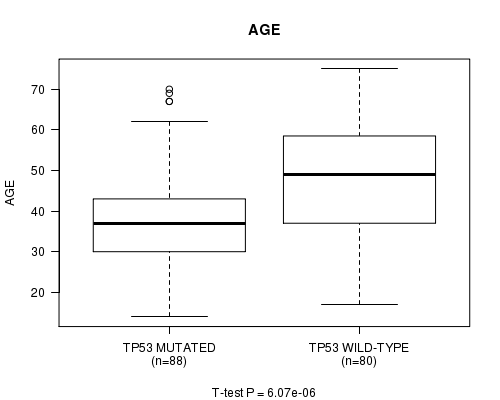
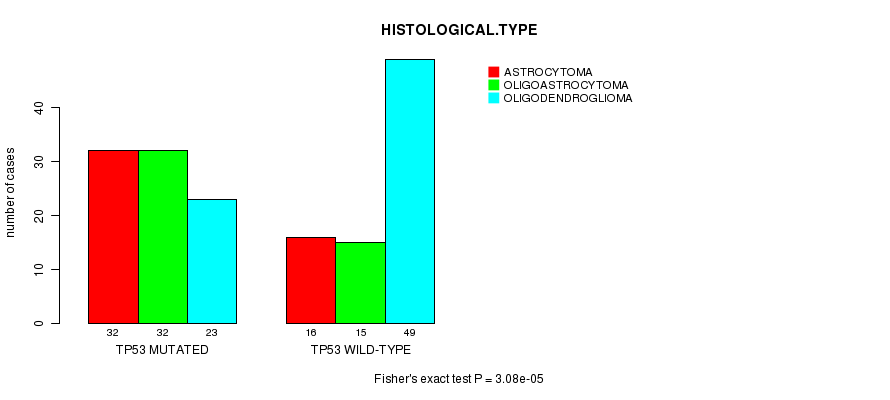
TP53 mutation correlated to 'AGE', 'HISTOLOGICAL.TYPE', and 'RADIATIONS.RADIATION.REGIMENINDICATION'.
-
FUBP1 mutation correlated to 'HISTOLOGICAL.TYPE'.
-
NOTCH1 mutation correlated to 'HISTOLOGICAL.TYPE'.
-
EGFR mutation correlated to 'KARNOFSKY.PERFORMANCE.SCORE'.
-
PAX4 mutation correlated to 'AGE'.
Table 1. Get Full Table Overview of the association between mutation status of 51 genes and 6 clinical features. Shown in the table are P values (Q values). Thresholded by Q value < 0.25, 10 significant findings detected.
|
Clinical Features |
Time to Death |
AGE | GENDER |
KARNOFSKY PERFORMANCE SCORE |
HISTOLOGICAL TYPE |
RADIATIONS RADIATION REGIMENINDICATION |
||
| nMutated (%) | nWild-Type | logrank test | t-test | Fisher's exact test | t-test | Fisher's exact test | Fisher's exact test | |
| TP53 | 88 (52%) | 80 |
0.101 (1.00) |
6.07e-06 (0.00168) |
0.276 (1.00) |
0.592 (1.00) |
3.08e-05 (0.00848) |
0.000344 (0.0941) |
| ATRX | 73 (43%) | 95 |
0.124 (1.00) |
0.000623 (0.168) |
0.53 (1.00) |
0.69 (1.00) |
0.00168 (0.451) |
0.019 (1.00) |
| IDH1 | 131 (78%) | 37 |
2.4e-05 (0.00663) |
0.113 (1.00) |
0.0246 (1.00) |
0.892 (1.00) |
0.0133 (1.00) |
1 (1.00) |
| CIC | 35 (21%) | 133 |
0.0537 (1.00) |
0.437 (1.00) |
0.706 (1.00) |
0.535 (1.00) |
1.43e-09 (3.98e-07) |
0.087 (1.00) |
| FUBP1 | 19 (11%) | 149 |
0.775 (1.00) |
0.00573 (1.00) |
0.806 (1.00) |
0.694 (1.00) |
0.000607 (0.165) |
0.334 (1.00) |
| NOTCH1 | 16 (10%) | 152 |
0.859 (1.00) |
0.0196 (1.00) |
0.115 (1.00) |
0.111 (1.00) |
0.000574 (0.156) |
0.44 (1.00) |
| EGFR | 8 (5%) | 160 |
0.0261 (1.00) |
0.00243 (0.648) |
0.29 (1.00) |
6.32e-11 (1.76e-08) |
0.0689 (1.00) |
1 (1.00) |
| PAX4 | 4 (2%) | 164 |
0.367 (1.00) |
0.000438 (0.12) |
0.315 (1.00) |
0.816 (1.00) |
1 (1.00) |
|
| PIK3CA | 15 (9%) | 153 |
0.915 (1.00) |
0.558 (1.00) |
1 (1.00) |
0.36 (1.00) |
0.337 (1.00) |
0.292 (1.00) |
| PIK3R1 | 12 (7%) | 156 |
0.239 (1.00) |
0.0323 (1.00) |
0.559 (1.00) |
0.696 (1.00) |
0.745 (1.00) |
0.773 (1.00) |
| PTEN | 7 (4%) | 161 |
0.194 (1.00) |
0.365 (1.00) |
0.463 (1.00) |
0.0355 (1.00) |
0.452 (1.00) |
|
| ARID1A | 11 (7%) | 157 |
0.058 (1.00) |
0.794 (1.00) |
0.118 (1.00) |
0.353 (1.00) |
0.622 (1.00) |
0.547 (1.00) |
| TIMD4 | 5 (3%) | 163 |
0.1 (1.00) |
0.173 (1.00) |
0.652 (1.00) |
0.132 (1.00) |
1 (1.00) |
0.184 (1.00) |
| NF1 | 11 (7%) | 157 |
0.0464 (1.00) |
0.725 (1.00) |
1 (1.00) |
0.776 (1.00) |
0.0514 (1.00) |
0.0641 (1.00) |
| IDH2 | 6 (4%) | 162 |
0.684 (1.00) |
0.13 (1.00) |
0.701 (1.00) |
0.175 (1.00) |
1 (1.00) |
|
| ZNF844 | 4 (2%) | 164 |
0.35 (1.00) |
0.997 (1.00) |
1 (1.00) |
0.693 (1.00) |
1 (1.00) |
|
| IL32 | 4 (2%) | 164 |
0.015 (1.00) |
0.254 (1.00) |
1 (1.00) |
0.132 (1.00) |
1 (1.00) |
0.0445 (1.00) |
| TCF12 | 6 (4%) | 162 |
0.972 (1.00) |
0.554 (1.00) |
0.085 (1.00) |
0.671 (1.00) |
1 (1.00) |
0.418 (1.00) |
| ZBTB20 | 7 (4%) | 161 |
0.163 (1.00) |
0.64 (1.00) |
0.7 (1.00) |
0.488 (1.00) |
0.0503 (1.00) |
|
| MUC7 | 4 (2%) | 164 |
0.147 (1.00) |
0.46 (1.00) |
1 (1.00) |
0.816 (1.00) |
1 (1.00) |
|
| ZNF57 | 6 (4%) | 162 |
0.247 (1.00) |
0.756 (1.00) |
0.404 (1.00) |
0.151 (1.00) |
1 (1.00) |
|
| PRAMEF11 | 5 (3%) | 163 |
0.129 (1.00) |
0.981 (1.00) |
1 (1.00) |
1 (1.00) |
1 (1.00) |
|
| ANKRD30A | 7 (4%) | 161 |
0.274 (1.00) |
0.0454 (1.00) |
0.241 (1.00) |
0.0647 (1.00) |
1 (1.00) |
|
| ZNF91 | 5 (3%) | 163 |
0.968 (1.00) |
0.793 (1.00) |
0.652 (1.00) |
0.519 (1.00) |
0.184 (1.00) |
|
| ZNF845 | 6 (4%) | 162 |
0.347 (1.00) |
0.796 (1.00) |
1 (1.00) |
0.885 (1.00) |
0.218 (1.00) |
|
| SPDYE5 | 3 (2%) | 165 |
0.00205 (0.548) |
0.226 (1.00) |
0.577 (1.00) |
0.671 (1.00) |
0.362 (1.00) |
0.098 (1.00) |
| TPTE | 6 (4%) | 162 |
0.694 (1.00) |
0.407 (1.00) |
0.701 (1.00) |
0.132 (1.00) |
0.0149 (1.00) |
0.218 (1.00) |
| C9ORF79 | 7 (4%) | 161 |
0.389 (1.00) |
0.535 (1.00) |
0.463 (1.00) |
0.0673 (1.00) |
0.885 (1.00) |
0.124 (1.00) |
| OR5A1 | 4 (2%) | 164 |
0.17 (1.00) |
0.657 (1.00) |
0.636 (1.00) |
0.693 (1.00) |
0.624 (1.00) |
|
| NOX4 | 5 (3%) | 163 |
0.483 (1.00) |
0.493 (1.00) |
1 (1.00) |
0.735 (1.00) |
1 (1.00) |
|
| DDX5 | 5 (3%) | 163 |
0.157 (1.00) |
0.965 (1.00) |
1 (1.00) |
0.398 (1.00) |
0.605 (1.00) |
0.664 (1.00) |
| PSD3 | 6 (4%) | 162 |
0.959 (1.00) |
0.604 (1.00) |
0.404 (1.00) |
0.875 (1.00) |
0.575 (1.00) |
0.687 (1.00) |
| KLKB1 | 5 (3%) | 163 |
0.161 (1.00) |
0.196 (1.00) |
1 (1.00) |
0.22 (1.00) |
1 (1.00) |
0.374 (1.00) |
| CYP2C19 | 3 (2%) | 165 |
0.433 (1.00) |
0.00646 (1.00) |
0.261 (1.00) |
0.787 (1.00) |
0.249 (1.00) |
|
| OR4A16 | 4 (2%) | 164 |
0.497 (1.00) |
0.225 (1.00) |
1 (1.00) |
0.482 (1.00) |
0.624 (1.00) |
|
| RPTN | 5 (3%) | 163 |
0.169 (1.00) |
0.969 (1.00) |
1 (1.00) |
0.735 (1.00) |
1 (1.00) |
|
| MYH2 | 7 (4%) | 161 |
0.0858 (1.00) |
0.388 (1.00) |
1 (1.00) |
0.132 (1.00) |
0.0355 (1.00) |
0.124 (1.00) |
| OR52B6 | 3 (2%) | 165 |
0.915 (1.00) |
0.8 (1.00) |
1 (1.00) |
0.26 (1.00) |
0.598 (1.00) |
|
| SERPINB7 | 4 (2%) | 164 |
0.822 (1.00) |
0.19 (1.00) |
0.636 (1.00) |
0.574 (1.00) |
0.624 (1.00) |
|
| PRDM9 | 5 (3%) | 163 |
0.259 (1.00) |
0.0461 (1.00) |
0.652 (1.00) |
0.389 (1.00) |
0.374 (1.00) |
|
| ATG5 | 3 (2%) | 165 |
0.849 (1.00) |
0.546 (1.00) |
0.577 (1.00) |
0.517 (1.00) |
0.626 (1.00) |
1 (1.00) |
| C3ORF35 | 3 (2%) | 165 |
0.495 (1.00) |
0.724 (1.00) |
1 (1.00) |
1 (1.00) |
0.249 (1.00) |
|
| SPRYD5 | 4 (2%) | 164 |
0.403 (1.00) |
0.657 (1.00) |
1 (1.00) |
0.0628 (1.00) |
0.624 (1.00) |
|
| ZNF292 | 8 (5%) | 160 |
0.725 (1.00) |
0.0228 (1.00) |
0.29 (1.00) |
0.523 (1.00) |
0.727 (1.00) |
0.474 (1.00) |
| CREBZF | 4 (2%) | 164 |
0.722 (1.00) |
0.22 (1.00) |
0.315 (1.00) |
0.297 (1.00) |
0.482 (1.00) |
1 (1.00) |
| MAX | 4 (2%) | 164 |
0.35 (1.00) |
0.679 (1.00) |
0.315 (1.00) |
0.574 (1.00) |
0.624 (1.00) |
|
| TPM1 | 4 (2%) | 164 |
0.143 (1.00) |
0.388 (1.00) |
1 (1.00) |
0.693 (1.00) |
0.338 (1.00) |
|
| FSTL5 | 5 (3%) | 163 |
0.938 (1.00) |
0.634 (1.00) |
1 (1.00) |
0.277 (1.00) |
0.374 (1.00) |
|
| C15ORF2 | 6 (4%) | 162 |
0.628 (1.00) |
0.379 (1.00) |
0.701 (1.00) |
0.33 (1.00) |
0.687 (1.00) |
|
| ZNF860 | 4 (2%) | 164 |
0.447 (1.00) |
0.0606 (1.00) |
0.636 (1.00) |
0.482 (1.00) |
0.624 (1.00) |
|
| OR9G9 | 3 (2%) | 165 |
0.183 (1.00) |
0.0207 (1.00) |
1 (1.00) |
0.468 (1.00) |
0.249 (1.00) |
P value = 0.000623 (t-test), Q value = 0.17
Table S1. Gene #1: 'ATRX MUTATION STATUS' versus Clinical Feature #2: 'AGE'
| nPatients | Mean (Std.Dev) | |
|---|---|---|
| ALL | 168 | 43.0 (13.4) |
| ATRX MUTATED | 73 | 39.1 (12.6) |
| ATRX WILD-TYPE | 95 | 46.1 (13.3) |
Figure S1. Get High-res Image Gene #1: 'ATRX MUTATION STATUS' versus Clinical Feature #2: 'AGE'

P value = 2.4e-05 (logrank test), Q value = 0.0066
Table S2. Gene #2: 'IDH1 MUTATION STATUS' versus Clinical Feature #1: 'Time to Death'
| nPatients | nDeath | Duration Range (Median), Month | |
|---|---|---|---|
| ALL | 167 | 46 | 0.0 - 211.2 (15.1) |
| IDH1 MUTATED | 130 | 29 | 0.0 - 182.3 (17.4) |
| IDH1 WILD-TYPE | 37 | 17 | 0.1 - 211.2 (8.4) |
Figure S2. Get High-res Image Gene #2: 'IDH1 MUTATION STATUS' versus Clinical Feature #1: 'Time to Death'
P value = 1.43e-09 (Fisher's exact test), Q value = 4e-07
Table S3. Gene #3: 'CIC MUTATION STATUS' versus Clinical Feature #5: 'HISTOLOGICAL.TYPE'
| nPatients | ASTROCYTOMA | OLIGOASTROCYTOMA | OLIGODENDROGLIOMA |
|---|---|---|---|
| ALL | 48 | 47 | 72 |
| CIC MUTATED | 1 | 3 | 31 |
| CIC WILD-TYPE | 47 | 44 | 41 |
Figure S3. Get High-res Image Gene #3: 'CIC MUTATION STATUS' versus Clinical Feature #5: 'HISTOLOGICAL.TYPE'
P value = 6.07e-06 (t-test), Q value = 0.0017
Table S4. Gene #4: 'TP53 MUTATION STATUS' versus Clinical Feature #2: 'AGE'
| nPatients | Mean (Std.Dev) | |
|---|---|---|
| ALL | 168 | 43.0 (13.4) |
| TP53 MUTATED | 88 | 38.7 (12.2) |
| TP53 WILD-TYPE | 80 | 47.8 (13.1) |
Figure S4. Get High-res Image Gene #4: 'TP53 MUTATION STATUS' versus Clinical Feature #2: 'AGE'
P value = 3.08e-05 (Fisher's exact test), Q value = 0.0085
Table S5. Gene #4: 'TP53 MUTATION STATUS' versus Clinical Feature #5: 'HISTOLOGICAL.TYPE'
| nPatients | ASTROCYTOMA | OLIGOASTROCYTOMA | OLIGODENDROGLIOMA |
|---|---|---|---|
| ALL | 48 | 47 | 72 |
| TP53 MUTATED | 32 | 32 | 23 |
| TP53 WILD-TYPE | 16 | 15 | 49 |
Figure S5. Get High-res Image Gene #4: 'TP53 MUTATION STATUS' versus Clinical Feature #5: 'HISTOLOGICAL.TYPE'
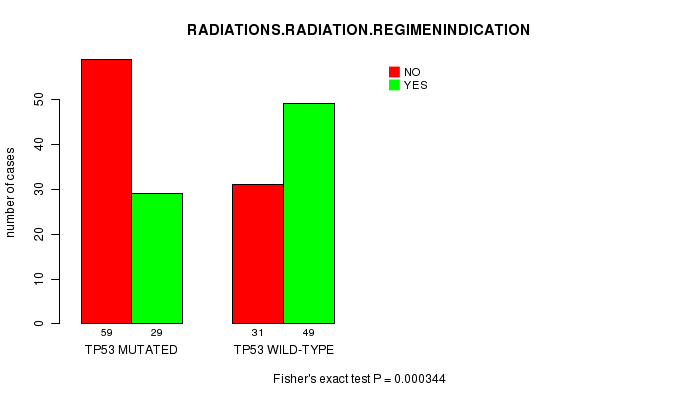
P value = 0.000344 (Fisher's exact test), Q value = 0.094
Table S6. Gene #4: 'TP53 MUTATION STATUS' versus Clinical Feature #6: 'RADIATIONS.RADIATION.REGIMENINDICATION'
| nPatients | NO | YES |
|---|---|---|
| ALL | 90 | 78 |
| TP53 MUTATED | 59 | 29 |
| TP53 WILD-TYPE | 31 | 49 |
Figure S6. Get High-res Image Gene #4: 'TP53 MUTATION STATUS' versus Clinical Feature #6: 'RADIATIONS.RADIATION.REGIMENINDICATION'
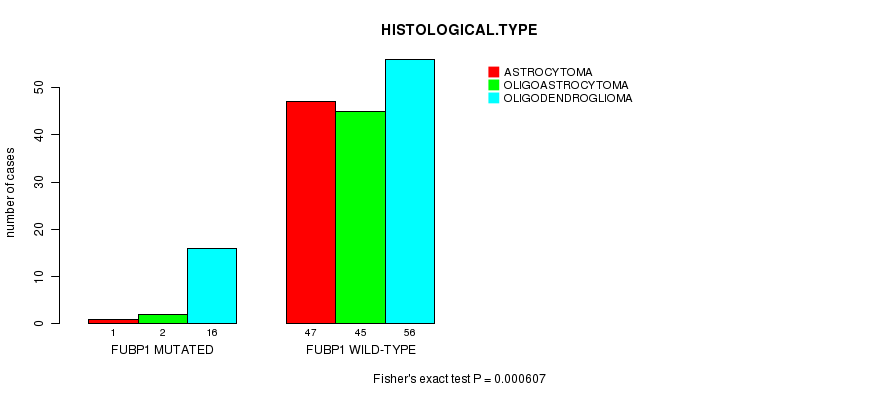
P value = 0.000607 (Fisher's exact test), Q value = 0.16
Table S7. Gene #5: 'FUBP1 MUTATION STATUS' versus Clinical Feature #5: 'HISTOLOGICAL.TYPE'
| nPatients | ASTROCYTOMA | OLIGOASTROCYTOMA | OLIGODENDROGLIOMA |
|---|---|---|---|
| ALL | 48 | 47 | 72 |
| FUBP1 MUTATED | 1 | 2 | 16 |
| FUBP1 WILD-TYPE | 47 | 45 | 56 |
Figure S7. Get High-res Image Gene #5: 'FUBP1 MUTATION STATUS' versus Clinical Feature #5: 'HISTOLOGICAL.TYPE'
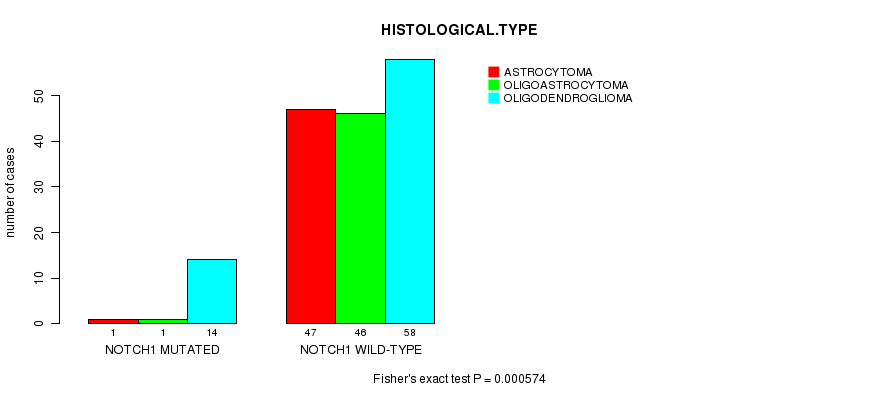
P value = 0.000574 (Fisher's exact test), Q value = 0.16
Table S8. Gene #8: 'NOTCH1 MUTATION STATUS' versus Clinical Feature #5: 'HISTOLOGICAL.TYPE'
| nPatients | ASTROCYTOMA | OLIGOASTROCYTOMA | OLIGODENDROGLIOMA |
|---|---|---|---|
| ALL | 48 | 47 | 72 |
| NOTCH1 MUTATED | 1 | 1 | 14 |
| NOTCH1 WILD-TYPE | 47 | 46 | 58 |
Figure S8. Get High-res Image Gene #8: 'NOTCH1 MUTATION STATUS' versus Clinical Feature #5: 'HISTOLOGICAL.TYPE'
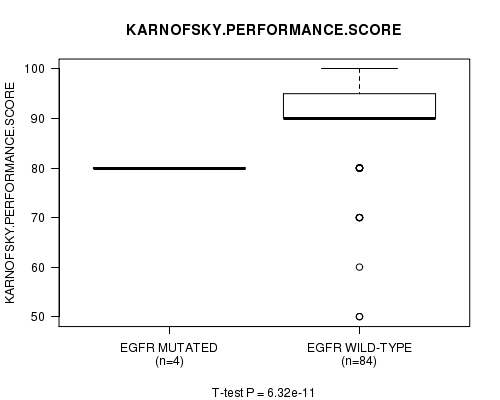
P value = 6.32e-11 (t-test), Q value = 1.8e-08
Table S9. Gene #20: 'EGFR MUTATION STATUS' versus Clinical Feature #4: 'KARNOFSKY.PERFORMANCE.SCORE'
| nPatients | Mean (Std.Dev) | |
|---|---|---|
| ALL | 88 | 88.3 (10.5) |
| EGFR MUTATED | 4 | 80.0 (0.0) |
| EGFR WILD-TYPE | 84 | 88.7 (10.6) |
Figure S9. Get High-res Image Gene #20: 'EGFR MUTATION STATUS' versus Clinical Feature #4: 'KARNOFSKY.PERFORMANCE.SCORE'
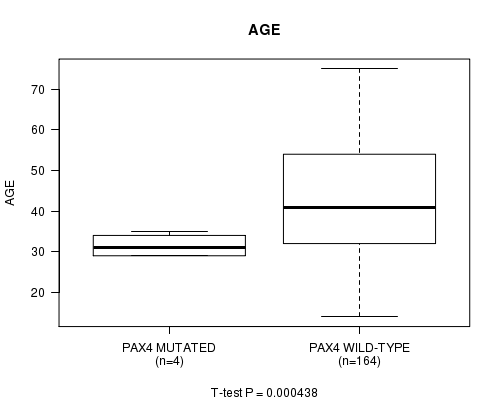
P value = 0.000438 (t-test), Q value = 0.12
Table S10. Gene #39: 'PAX4 MUTATION STATUS' versus Clinical Feature #2: 'AGE'
| nPatients | Mean (Std.Dev) | |
|---|---|---|
| ALL | 168 | 43.0 (13.4) |
| PAX4 MUTATED | 4 | 31.5 (3.0) |
| PAX4 WILD-TYPE | 164 | 43.3 (13.4) |
Figure S10. Get High-res Image Gene #39: 'PAX4 MUTATION STATUS' versus Clinical Feature #2: 'AGE'
-
Mutation data file = LGG-TP.mutsig.cluster.txt
-
Clinical data file = LGG-TP.clin.merged.picked.txt
-
Number of patients = 168
-
Number of significantly mutated genes = 51
-
Number of selected clinical features = 6
-
Exclude genes that fewer than K tumors have mutations, K = 3
For survival clinical features, the Kaplan-Meier survival curves of tumors with and without gene mutations were plotted and the statistical significance P values were estimated by logrank test (Bland and Altman 2004) using the 'survdiff' function in R
For continuous numerical clinical features, two-tailed Student's t test with unequal variance (Lehmann and Romano 2005) was applied to compare the clinical values between tumors with and without gene mutations using 't.test' function in R
For binary or multi-class clinical features (nominal or ordinal), two-tailed Fisher's exact tests (Fisher 1922) were used to estimate the P values using the 'fisher.test' function in R
For multiple hypothesis correction, Q value is the False Discovery Rate (FDR) analogue of the P value (Benjamini and Hochberg 1995), defined as the minimum FDR at which the test may be called significant. We used the 'Benjamini and Hochberg' method of 'p.adjust' function in R to convert P values into Q values.
This is an experimental feature. The full results of the analysis summarized in this report can be downloaded from the TCGA Data Coordination Center.