(primary solid tumor cohort)
This report serves to describe the mutational landscape and properties of a given individual set, as well as rank genes and genesets according to mutational significance. MutSig v2.0 was used to generate the results found in this report.
-
Working with individual set: LGG-TP
-
Number of patients in set: 170
The input for this pipeline is a set of individuals with the following files associated for each:
-
An annotated .maf file describing the mutations called for the respective individual, and their properties.
-
A .wig file that contains information about the coverage of the sample.
-
MAF used for this analysis:LGG-TP.final_analysis_set.maf
-
Significantly mutated genes (q ≤ 0.1): 41
-
Mutations seen in COSMIC: 331
-
Significantly mutated genes in COSMIC territory: 12
-
Genes with clustered mutations (≤ 3 aa apart): 143
-
Significantly mutated genesets: 95
-
Significantly mutated genesets: (excluding sig. mutated genes):0
-
Read 170 MAFs of type "Broad"
-
Total number of mutations in input MAFs: 24649
-
After removing 12 mutations outside chr1-24: 24637
-
After removing 468 blacklisted mutations: 24169
-
After removing 446 noncoding mutations: 23723
-
After collapsing adjacent/redundant mutations: 23722
-
Number of mutations before filtering: 23722
-
After removing 302 mutations outside gene set: 23420
-
After removing 96 mutations outside category set: 23324
-
After removing 3 "impossible" mutations in
-
gene-patient-category bins of zero coverage: 22923
Table 1. Get Full Table Table representing breakdown of mutations by type.
| type | count |
|---|---|
| Frame_Shift_Del | 441 |
| Frame_Shift_Ins | 246 |
| In_Frame_Del | 226 |
| In_Frame_Ins | 10 |
| Missense_Mutation | 15136 |
| Nonsense_Mutation | 938 |
| Nonstop_Mutation | 12 |
| Silent | 5858 |
| Splice_Site | 416 |
| Translation_Start_Site | 41 |
| Total | 23324 |
Table 2. Get Full Table A breakdown of mutation rates per category discovered for this individual set.
| category | n | N | rate | rate_per_mb | relative_rate | exp_ns_s_ratio |
|---|---|---|---|---|---|---|
| *CpG->T | 4768 | 274694298 | 0.000017 | 17 | 5 | 2.1 |
| *Cp(A/C/T)->T | 3403 | 2262327426 | 1.5e-06 | 1.5 | 0.43 | 1.7 |
| A->G | 2059 | 2444442244 | 8.4e-07 | 0.84 | 0.24 | 2.3 |
| transver | 4945 | 4981463968 | 9.9e-07 | 0.99 | 0.28 | 5 |
| indel+null | 2205 | 4981463968 | 4.4e-07 | 0.44 | 0.13 | NaN |
| double_null | 84 | 4981463968 | 1.7e-08 | 0.017 | 0.0048 | NaN |
| Total | 17464 | 4981463968 | 3.5e-06 | 3.5 | 1 | 3.5 |
The x axis represents the samples. The y axis represents the exons, one row per exon, and they are sorted by average coverage across samples. For exons with exactly the same average coverage, they are sorted next by the %GC of the exon. (The secondary sort is especially useful for the zero-coverage exons at the bottom).
Figure 1.
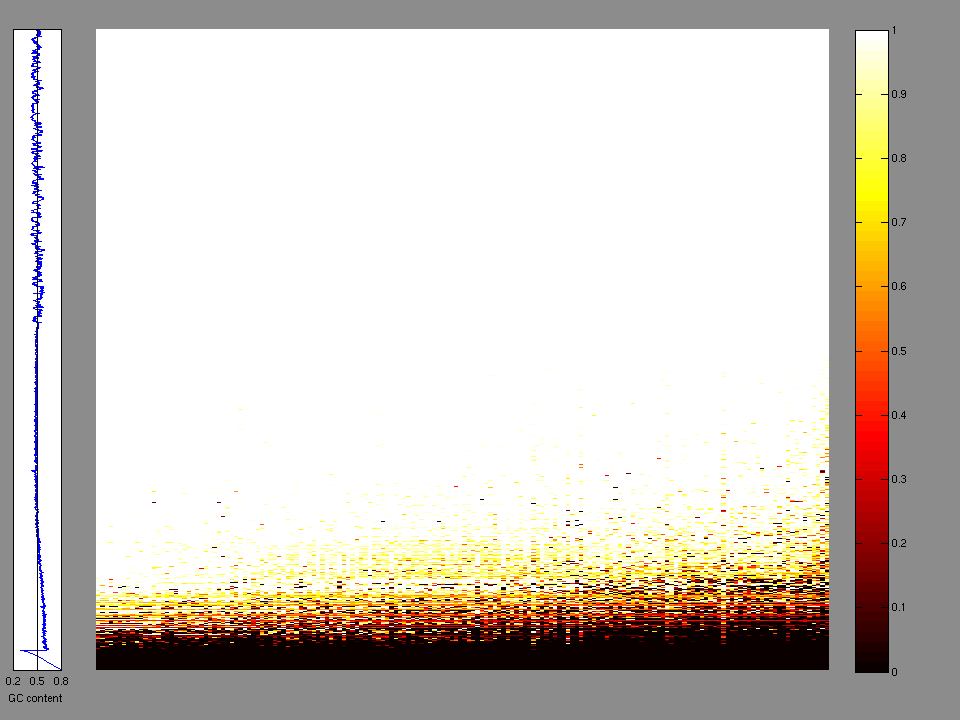
Figure 2. Patients counts and rates file used to generate this plot: LGG-TP.patients.counts_and_rates.txt
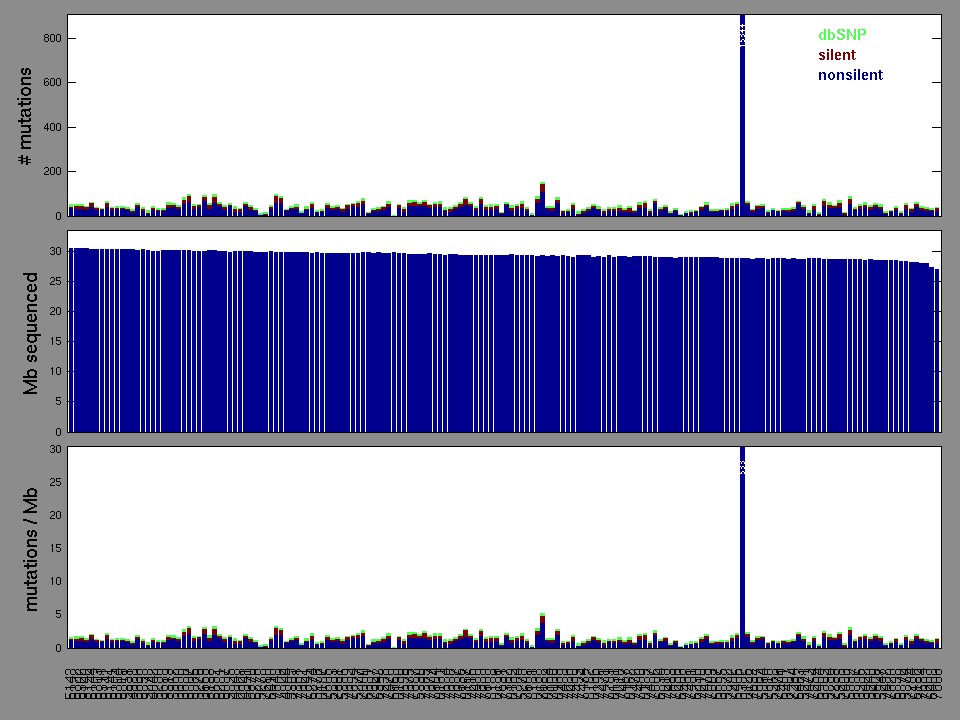
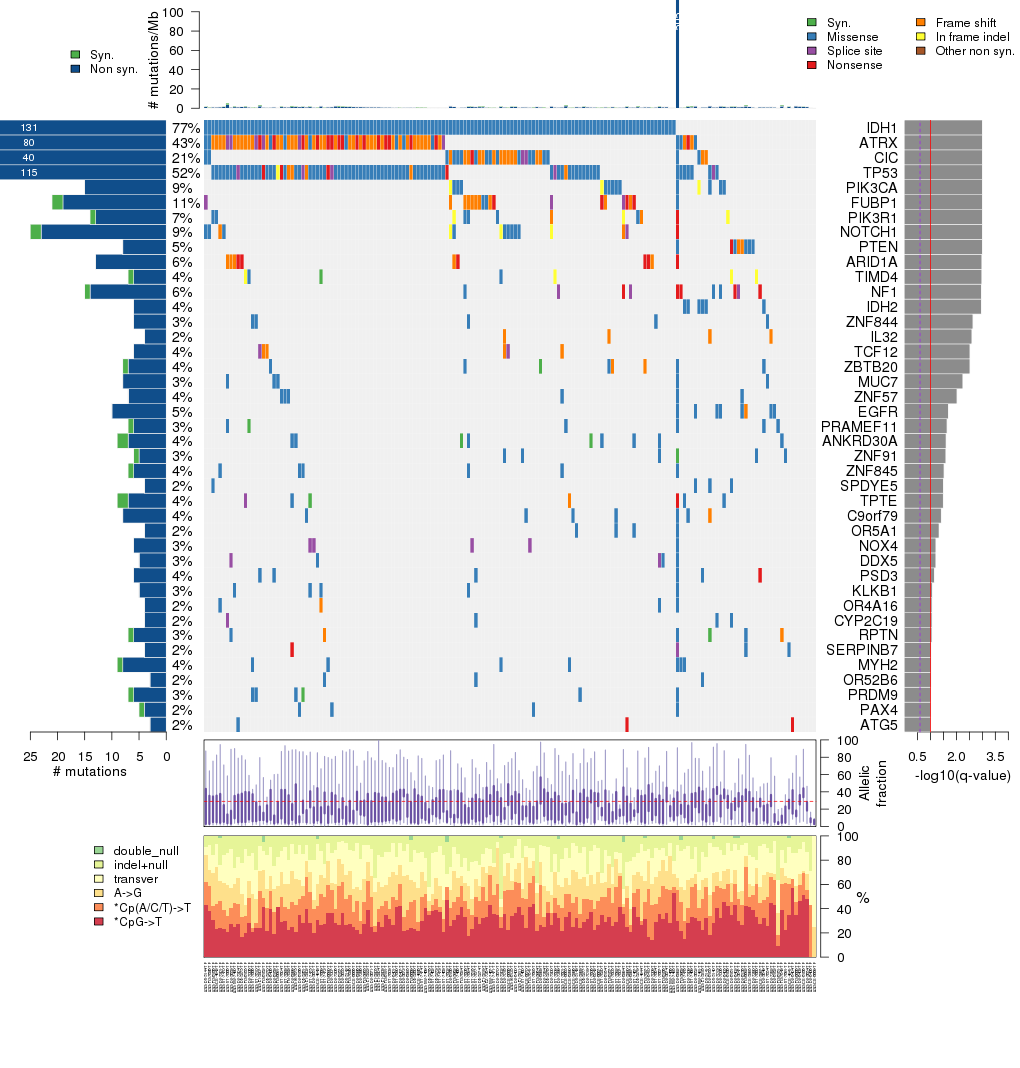
Figure 3. Get High-res Image The matrix in the center of the figure represents individual mutations in patient samples, color-coded by type of mutation, for the significantly mutated genes. The rate of synonymous and non-synonymous mutations is displayed at the top of the matrix. The barplot on the left of the matrix shows the number of mutations in each gene. The percentages represent the fraction of tumors with at least one mutation in the specified gene. The barplot to the right of the matrix displays the q-values for the most significantly mutated genes. The purple boxplots below the matrix (only displayed if required columns are present in the provided MAF) represent the distributions of allelic fractions observed in each sample. The plot at the bottom represents the base substitution distribution of individual samples, using the same categories that were used to calculate significance.
Column Descriptions:
-
N = number of sequenced bases in this gene across the individual set
-
n = number of (nonsilent) mutations in this gene across the individual set
-
npat = number of patients (individuals) with at least one nonsilent mutation
-
nsite = number of unique sites having a non-silent mutation
-
nsil = number of silent mutations in this gene across the individual set
-
n1 = number of nonsilent mutations of type: *CpG->T
-
n2 = number of nonsilent mutations of type: *Cp(A/C/T)->T
-
n3 = number of nonsilent mutations of type: A->G
-
n4 = number of nonsilent mutations of type: transver
-
n5 = number of nonsilent mutations of type: indel+null
-
n6 = number of nonsilent mutations of type: double_null
-
p_classic = p-value for the observed amount of nonsilent mutations being elevated in this gene
-
p_ns_s = p-value for the observed nonsilent/silent ratio being elevated in this gene
-
p_cons = p-value for enrichment of mutations at evolutionarily most-conserved sites in gene
-
p_joint = p-value for clustering + conservation
-
p = p-value (overall)
-
q = q-value, False Discovery Rate (Benjamini-Hochberg procedure)
Table 3. Get Full Table A Ranked List of Significantly Mutated Genes. Number of significant genes found: 41. Number of genes displayed: 35. Click on a gene name to display its stick figure depicting the distribution of mutations and mutation types across the chosen gene (this feature may not be available for all significant genes).
| rank | gene | description | N | n | npat | nsite | nsil | n1 | n2 | n3 | n4 | n5 | n6 | p_classic | p_ns_s | p_cons | p_joint | p | q |
|---|---|---|---|---|---|---|---|---|---|---|---|---|---|---|---|---|---|---|---|
| 1 | IDH1 | isocitrate dehydrogenase 1 (NADP+), soluble | 216008 | 131 | 131 | 2 | 0 | 123 | 0 | 0 | 8 | 0 | 0 | <1.00e-15 | 1.6e-15 | NaN | NaN | <1.00e-15 | <1.20e-11 |
| 2 | ATRX | alpha thalassemia/mental retardation syndrome X-linked (RAD54 homolog, S. cerevisiae) | 1280217 | 78 | 73 | 70 | 2 | 2 | 3 | 6 | 6 | 58 | 3 | 1.33e-15 | 0.0024 | NaN | NaN | 1.33e-15 | 1.20e-11 |
| 3 | CIC | capicua homolog (Drosophila) | 702843 | 40 | 35 | 34 | 0 | 15 | 1 | 1 | 5 | 18 | 0 | 2.11e-15 | 0.00012 | NaN | NaN | 2.11e-15 | 1.27e-11 |
| 4 | TP53 | tumor protein p53 | 209503 | 113 | 88 | 63 | 2 | 46 | 12 | 14 | 25 | 13 | 3 | 3.00e-15 | 1.1e-11 | NaN | NaN | 3.00e-15 | 1.36e-11 |
| 5 | PIK3CA | phosphoinositide-3-kinase, catalytic, alpha polypeptide | 558011 | 15 | 15 | 10 | 0 | 0 | 5 | 5 | 2 | 3 | 0 | 8.22e-15 | 0.014 | NaN | NaN | 8.22e-15 | 2.64e-11 |
| 6 | FUBP1 | far upstream element (FUSE) binding protein 1 | 335021 | 19 | 19 | 18 | 2 | 0 | 0 | 1 | 2 | 16 | 0 | 8.77e-15 | 0.66 | NaN | NaN | 8.77e-15 | 2.64e-11 |
| 7 | PIK3R1 | phosphoinositide-3-kinase, regulatory subunit 1 (alpha) | 401699 | 13 | 12 | 11 | 1 | 1 | 2 | 3 | 0 | 7 | 0 | 1.18e-13 | 0.26 | NaN | NaN | 1.18e-13 | 3.06e-10 |
| 8 | NOTCH1 | Notch homolog 1, translocation-associated (Drosophila) | 1034775 | 23 | 16 | 20 | 2 | 4 | 3 | 1 | 6 | 7 | 2 | 1.58e-10 | 0.029 | NaN | NaN | 1.58e-10 | 3.58e-07 |
| 9 | PTEN | phosphatase and tensin homolog (mutated in multiple advanced cancers 1) | 206544 | 8 | 8 | 8 | 0 | 1 | 1 | 0 | 3 | 3 | 0 | 2.93e-10 | 0.25 | NaN | NaN | 2.93e-10 | 5.89e-07 |
| 10 | ARID1A | AT rich interactive domain 1A (SWI-like) | 986587 | 13 | 11 | 13 | 0 | 1 | 0 | 0 | 1 | 10 | 1 | 3.35e-08 | 0.077 | NaN | NaN | 3.35e-08 | 6.05e-05 |
| 11 | TIMD4 | T-cell immunoglobulin and mucin domain containing 4 | 199368 | 6 | 6 | 3 | 1 | 0 | 1 | 0 | 1 | 4 | 0 | 4.11e-08 | 0.82 | NaN | NaN | 4.11e-08 | 6.76e-05 |
| 12 | NF1 | neurofibromin 1 (neurofibromatosis, von Recklinghausen disease, Watson disease) | 1473142 | 14 | 11 | 14 | 1 | 1 | 2 | 1 | 2 | 3 | 5 | 5.77e-08 | 0.096 | NaN | NaN | 5.77e-08 | 8.69e-05 |
| 13 | IDH2 | isocitrate dehydrogenase 2 (NADP+), mitochondrial | 198137 | 6 | 6 | 2 | 0 | 0 | 4 | 0 | 2 | 0 | 0 | 6.51e-08 | 0.058 | NaN | NaN | 6.51e-08 | 9.06e-05 |
| 14 | ZNF844 | zinc finger protein 844 | 212375 | 6 | 5 | 2 | 0 | 0 | 0 | 2 | 4 | 0 | 0 | 1.02e-06 | 0.23 | NaN | NaN | 1.02e-06 | 0.00132 |
| 15 | IL32 | interleukin 32 | 87796 | 4 | 4 | 1 | 0 | 0 | 0 | 0 | 0 | 4 | 0 | 1.28e-06 | 1 | NaN | NaN | 1.28e-06 | 0.00155 |
| 16 | TCF12 | transcription factor 12 (HTF4, helix-loop-helix transcription factors 4) | 385695 | 6 | 6 | 5 | 0 | 0 | 0 | 0 | 0 | 6 | 0 | 1.83e-06 | 0.75 | NaN | NaN | 1.83e-06 | 0.00204 |
| 17 | ZBTB20 | zinc finger and BTB domain containing 20 | 345917 | 7 | 7 | 7 | 1 | 1 | 0 | 3 | 1 | 2 | 0 | 1.92e-06 | 0.5 | NaN | NaN | 1.92e-06 | 0.00204 |
| 18 | MUC7 | mucin 7, secreted | 194133 | 8 | 5 | 7 | 0 | 1 | 2 | 5 | 0 | 0 | 0 | 4.66e-06 | 0.018 | NaN | NaN | 4.66e-06 | 0.00469 |
| 19 | ZNF57 | zinc finger protein 57 | 284991 | 7 | 6 | 4 | 0 | 1 | 1 | 1 | 4 | 0 | 0 | 8.97e-06 | 0.16 | NaN | NaN | 8.97e-06 | 0.00854 |
| 20 | EGFR | epidermal growth factor receptor (erythroblastic leukemia viral (v-erb-b) oncogene homolog, avian) | 669290 | 10 | 8 | 8 | 0 | 1 | 2 | 0 | 6 | 1 | 0 | 2.15e-05 | 0.08 | NaN | NaN | 2.15e-05 | 0.0194 |
| 21 | PRAMEF11 | PRAME family member 11 | 208592 | 6 | 5 | 6 | 1 | 0 | 2 | 2 | 2 | 0 | 0 | 2.55e-05 | 0.4 | NaN | NaN | 2.55e-05 | 0.0220 |
| 22 | ANKRD30A | ankyrin repeat domain 30A | 634412 | 7 | 7 | 5 | 2 | 2 | 0 | 0 | 5 | 0 | 0 | 2.92e-05 | 0.56 | NaN | NaN | 2.92e-05 | 0.0240 |
| 23 | ZNF91 | zinc finger protein 91 | 598251 | 5 | 5 | 4 | 1 | 2 | 1 | 2 | 0 | 0 | 0 | 3.15e-05 | 0.4 | NaN | NaN | 3.15e-05 | 0.0247 |
| 24 | ZNF845 | zinc finger protein 845 | 472789 | 6 | 6 | 4 | 1 | 0 | 3 | 2 | 1 | 0 | 0 | 3.85e-05 | 0.32 | NaN | NaN | 3.85e-05 | 0.0290 |
| 25 | SPDYE5 | speedy homolog E5 (Xenopus laevis) | 144980 | 4 | 4 | 3 | 0 | 3 | 0 | 1 | 0 | 0 | 0 | 4.19e-05 | 0.38 | NaN | NaN | 4.19e-05 | 0.0303 |
| 26 | TPTE | transmembrane phosphatase with tensin homology | 295452 | 7 | 6 | 7 | 2 | 0 | 0 | 1 | 3 | 3 | 0 | 4.46e-05 | 0.76 | NaN | NaN | 4.46e-05 | 0.0310 |
| 27 | C9orf79 | chromosome 9 open reading frame 79 | 713528 | 8 | 7 | 8 | 0 | 2 | 3 | 1 | 1 | 1 | 0 | 5.54e-05 | 0.06 | NaN | NaN | 5.54e-05 | 0.0371 |
| 28 | OR5A1 | olfactory receptor, family 5, subfamily A, member 1 | 161840 | 4 | 4 | 4 | 0 | 1 | 1 | 1 | 1 | 0 | 0 | 7.04e-05 | 0.22 | NaN | NaN | 7.04e-05 | 0.0455 |
| 29 | NOX4 | NADPH oxidase 4 | 305569 | 6 | 5 | 3 | 0 | 0 | 1 | 1 | 0 | 4 | 0 | 9.77e-05 | 0.45 | NaN | NaN | 9.77e-05 | 0.0610 |
| 30 | DDX5 | DEAD (Asp-Glu-Ala-Asp) box polypeptide 5 | 320234 | 5 | 5 | 4 | 0 | 0 | 2 | 0 | 1 | 2 | 0 | 0.000103 | 0.46 | NaN | NaN | 0.000103 | 0.0618 |
| 31 | PSD3 | pleckstrin and Sec7 domain containing 3 | 548440 | 6 | 6 | 6 | 0 | 0 | 1 | 4 | 0 | 1 | 0 | 0.000118 | 0.1 | NaN | NaN | 0.000118 | 0.0689 |
| 32 | KLKB1 | kallikrein B, plasma (Fletcher factor) 1 | 334402 | 5 | 5 | 5 | 0 | 2 | 1 | 1 | 1 | 0 | 0 | 0.000148 | 0.21 | NaN | NaN | 0.000148 | 0.0836 |
| 33 | OR4A16 | olfactory receptor, family 4, subfamily A, member 16 | 167440 | 4 | 4 | 4 | 0 | 0 | 1 | 1 | 1 | 1 | 0 | 0.000161 | 0.36 | NaN | NaN | 0.000161 | 0.0858 |
| 34 | CYP2C19 | cytochrome P450, family 2, subfamily C, polypeptide 19 | 256162 | 4 | 4 | 4 | 0 | 2 | 1 | 0 | 0 | 1 | 0 | 0.000161 | 0.32 | NaN | NaN | 0.000161 | 0.0858 |
| 35 | RPTN | repetin | 401710 | 6 | 5 | 6 | 1 | 2 | 1 | 0 | 1 | 2 | 0 | 0.000168 | 0.58 | NaN | NaN | 0.000168 | 0.0868 |
Figure S1. This figure depicts the distribution of mutations and mutation types across the IDH1 significant gene.
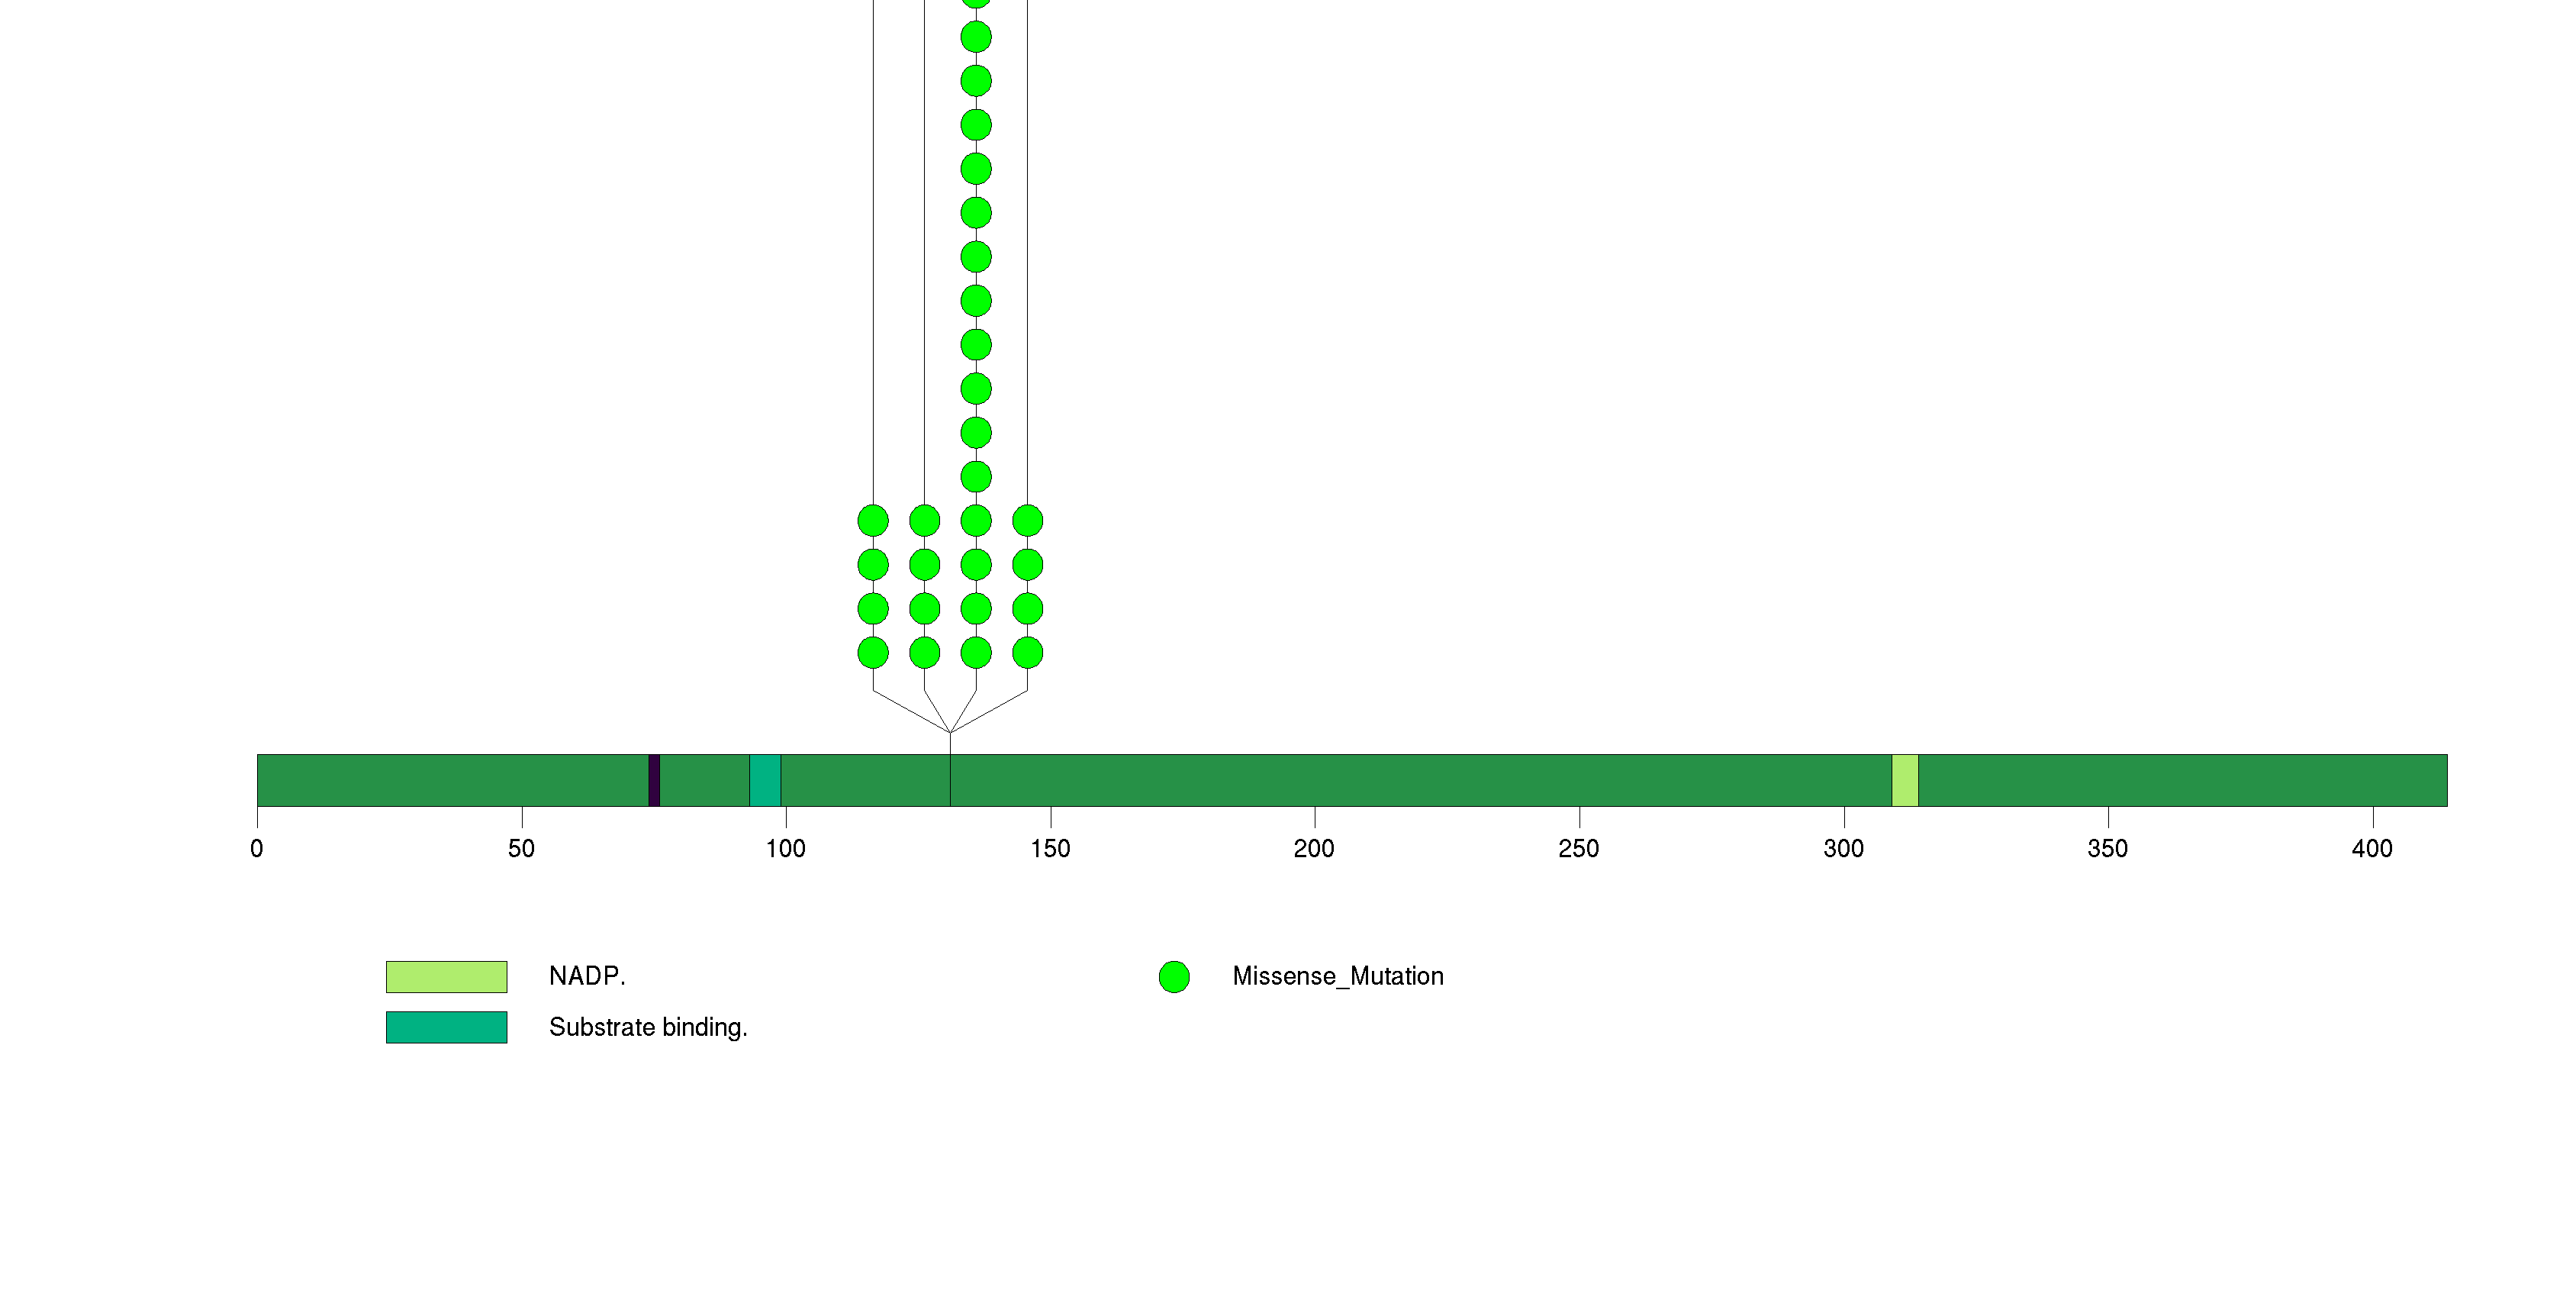
Figure S2. This figure depicts the distribution of mutations and mutation types across the ATRX significant gene.
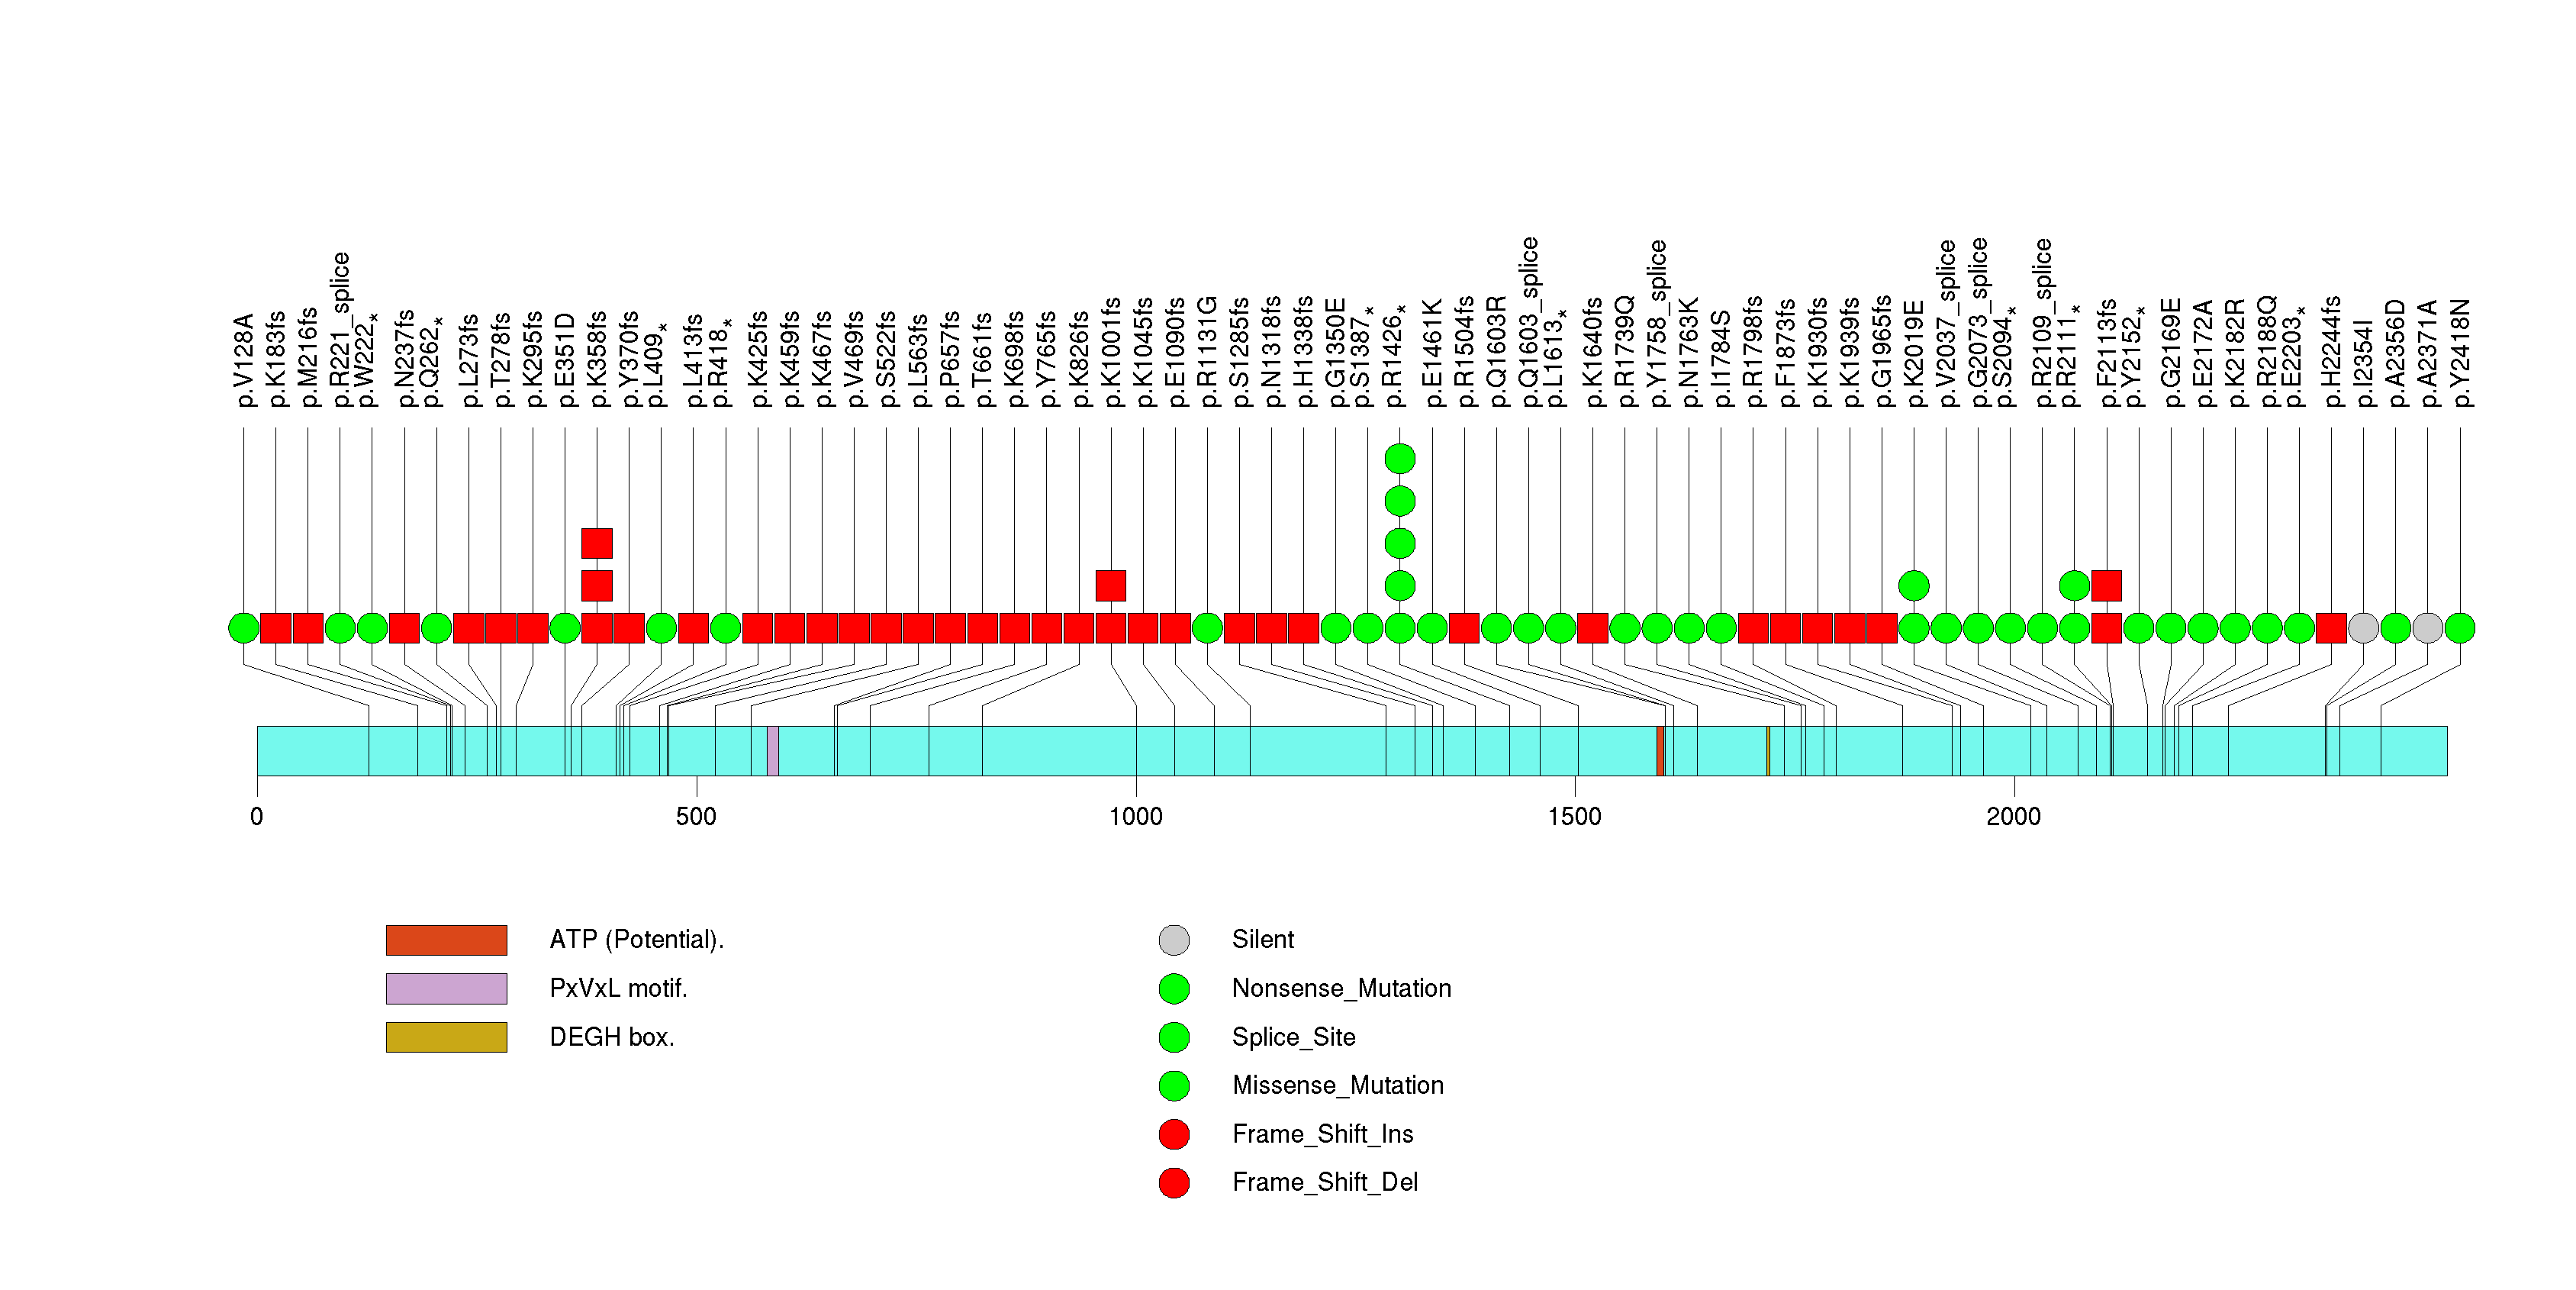
Figure S3. This figure depicts the distribution of mutations and mutation types across the CIC significant gene.
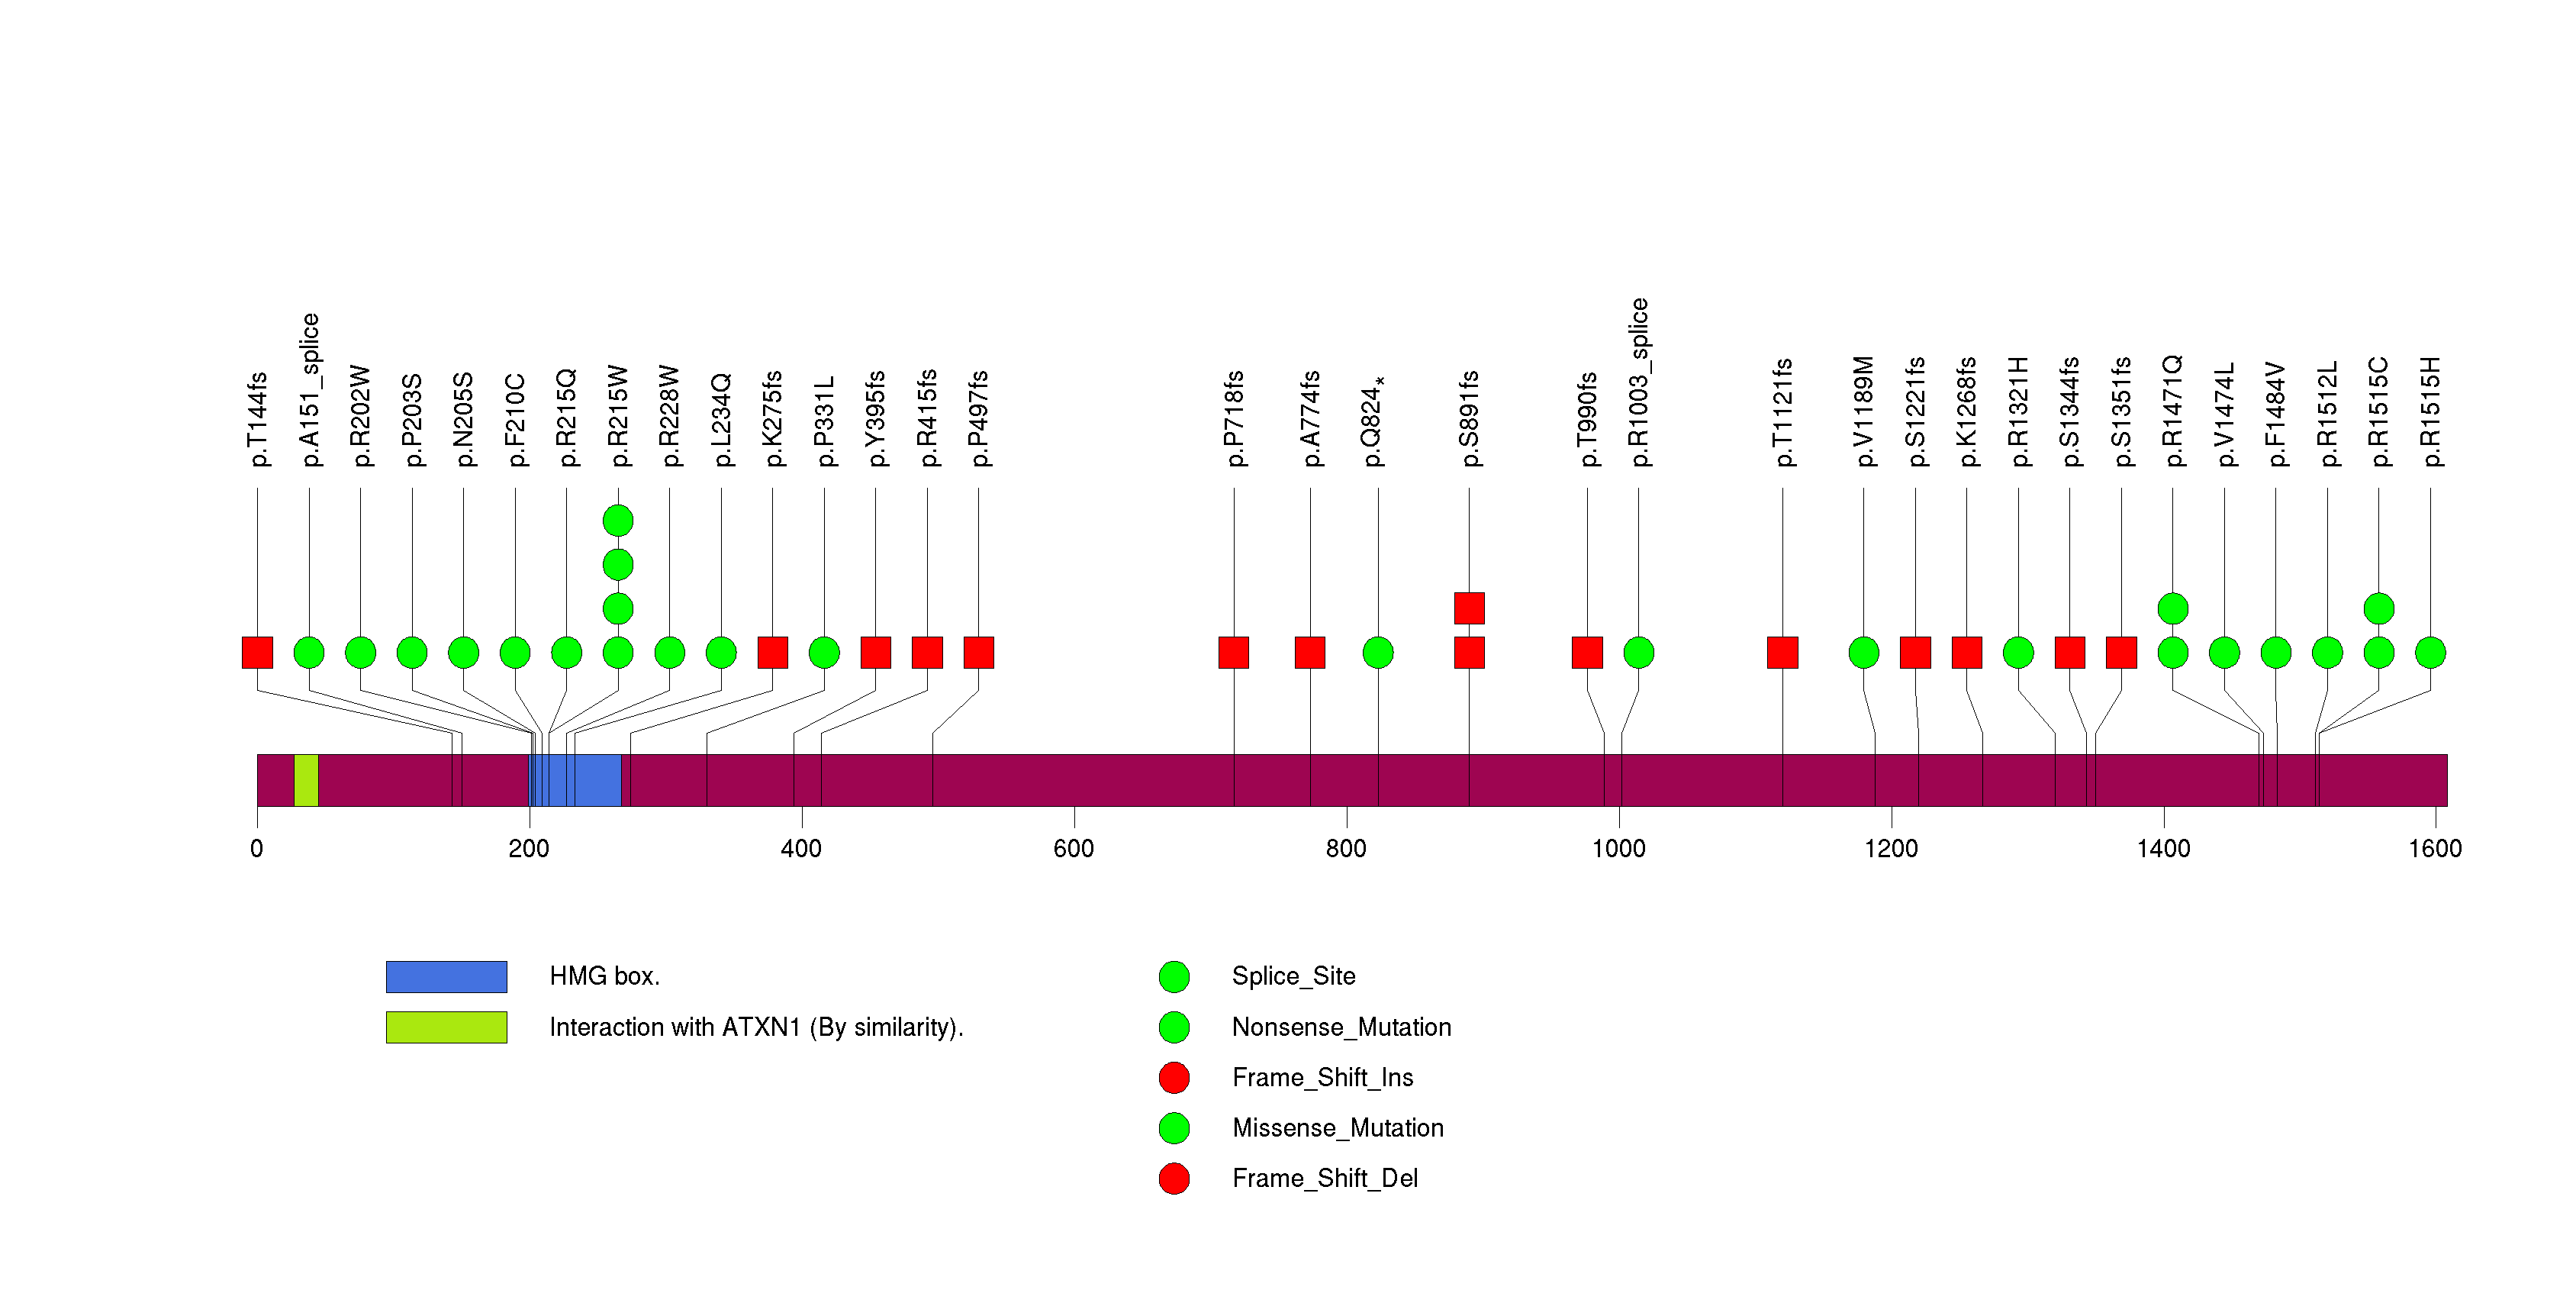
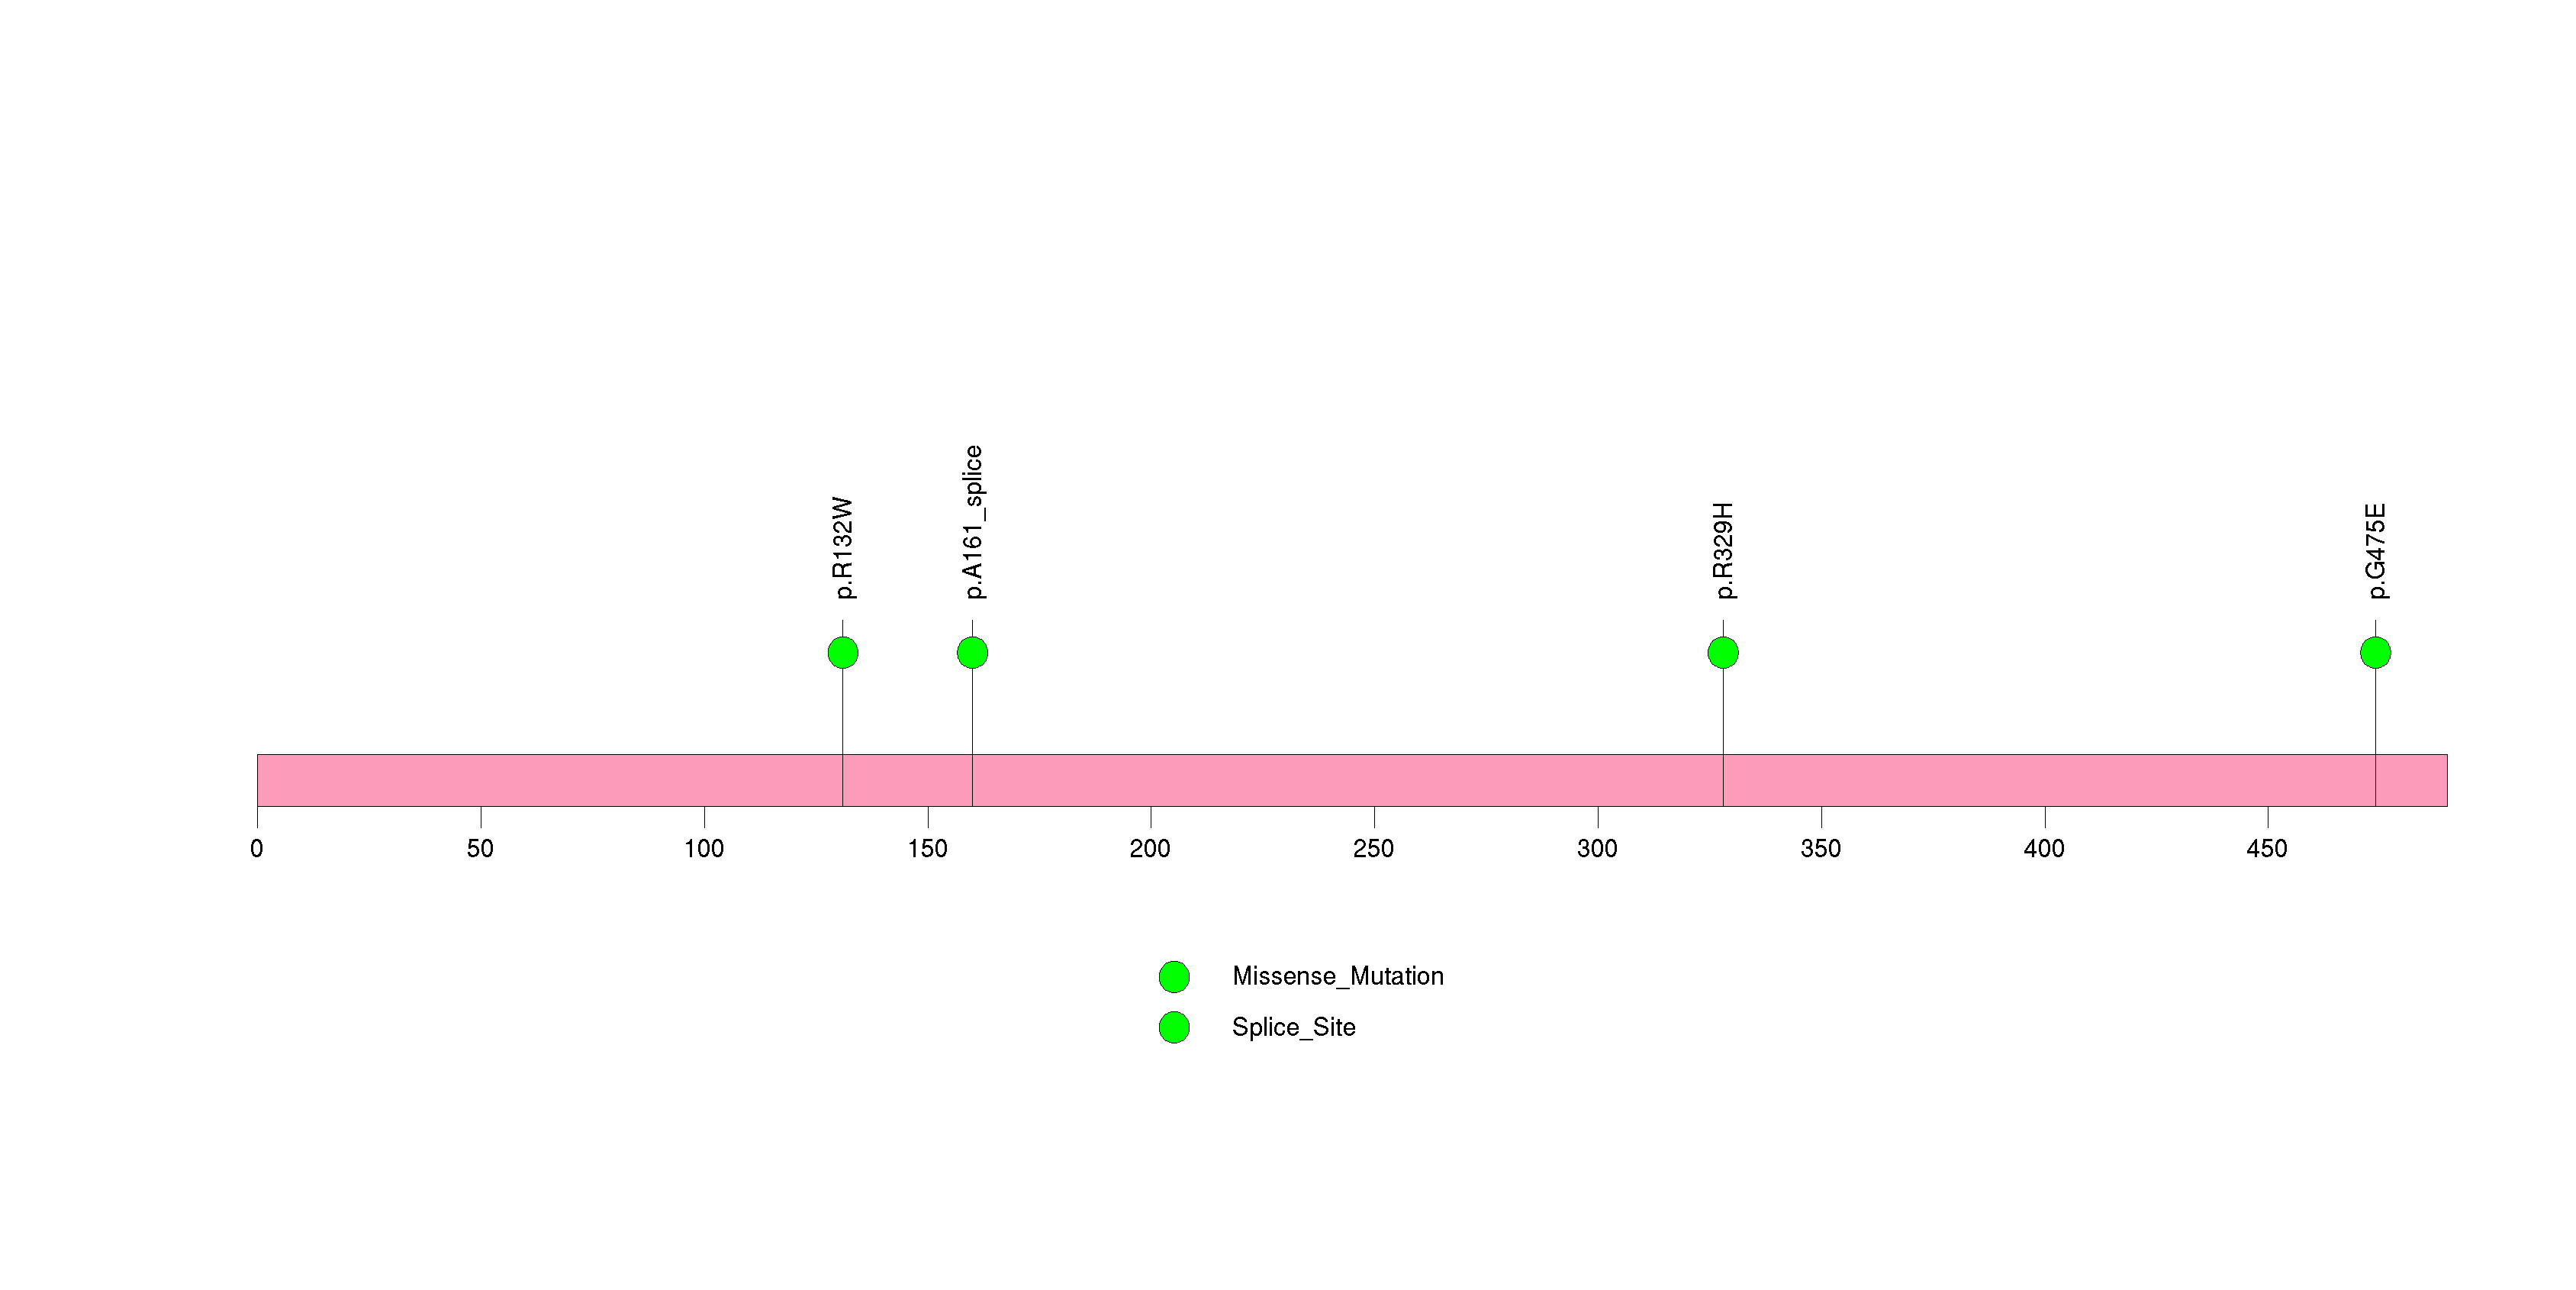
Figure S4. This figure depicts the distribution of mutations and mutation types across the TP53 significant gene.
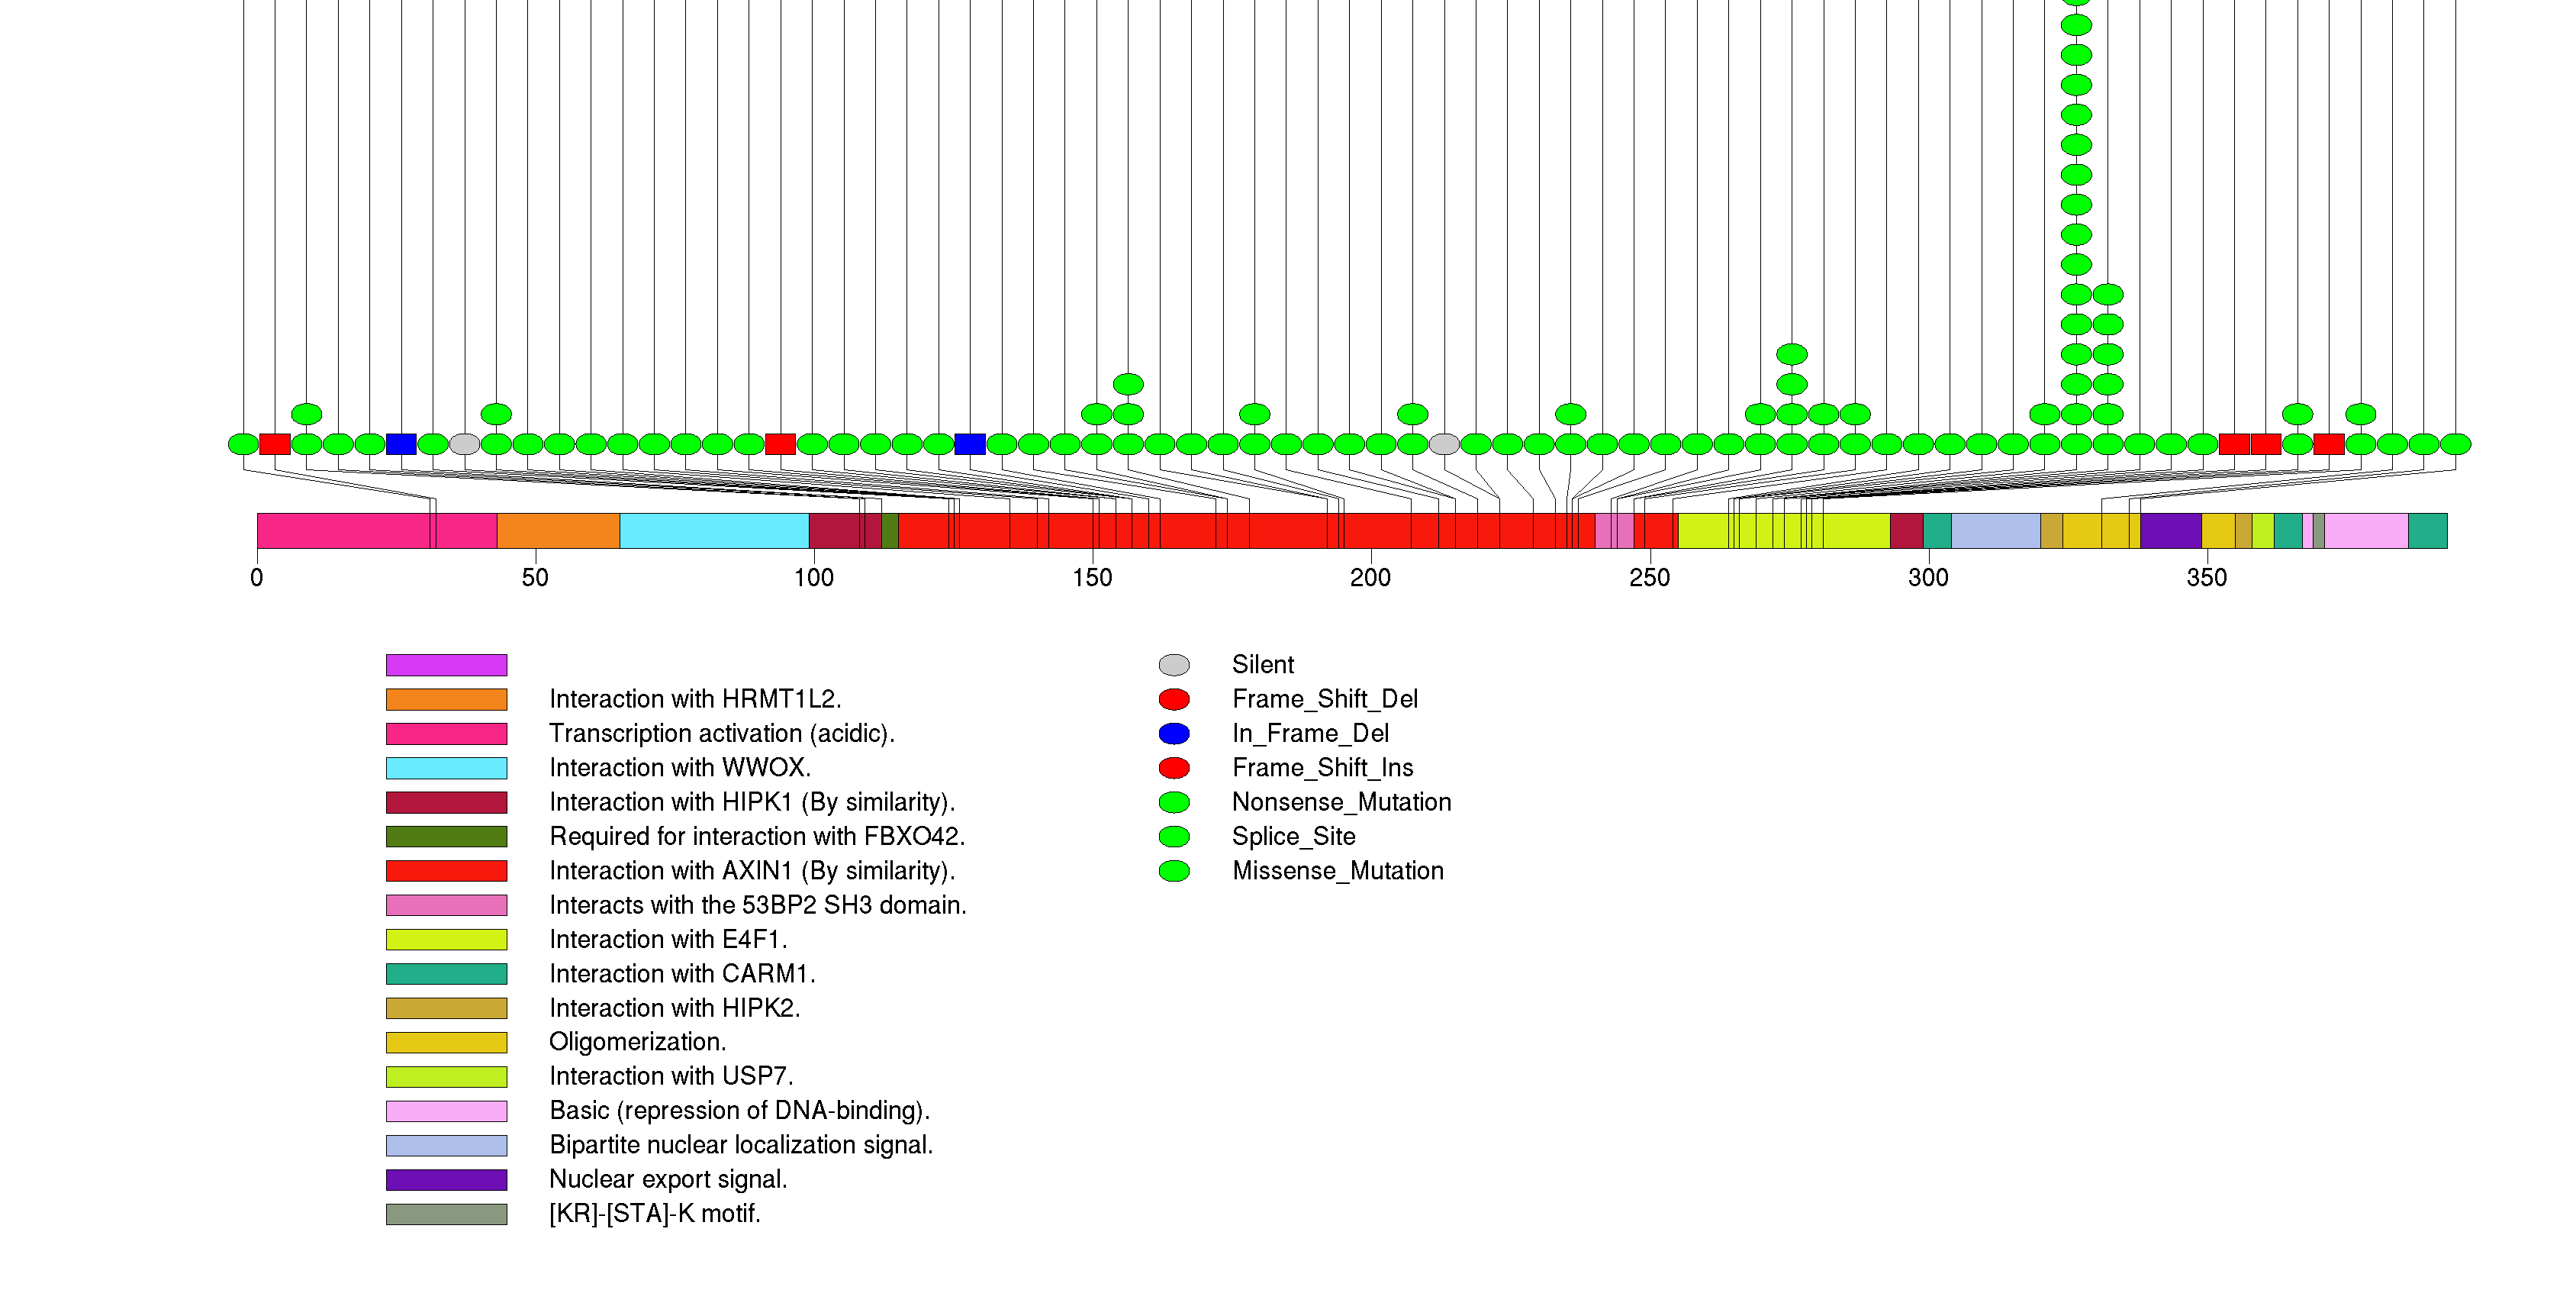
Figure S5. This figure depicts the distribution of mutations and mutation types across the PIK3CA significant gene.
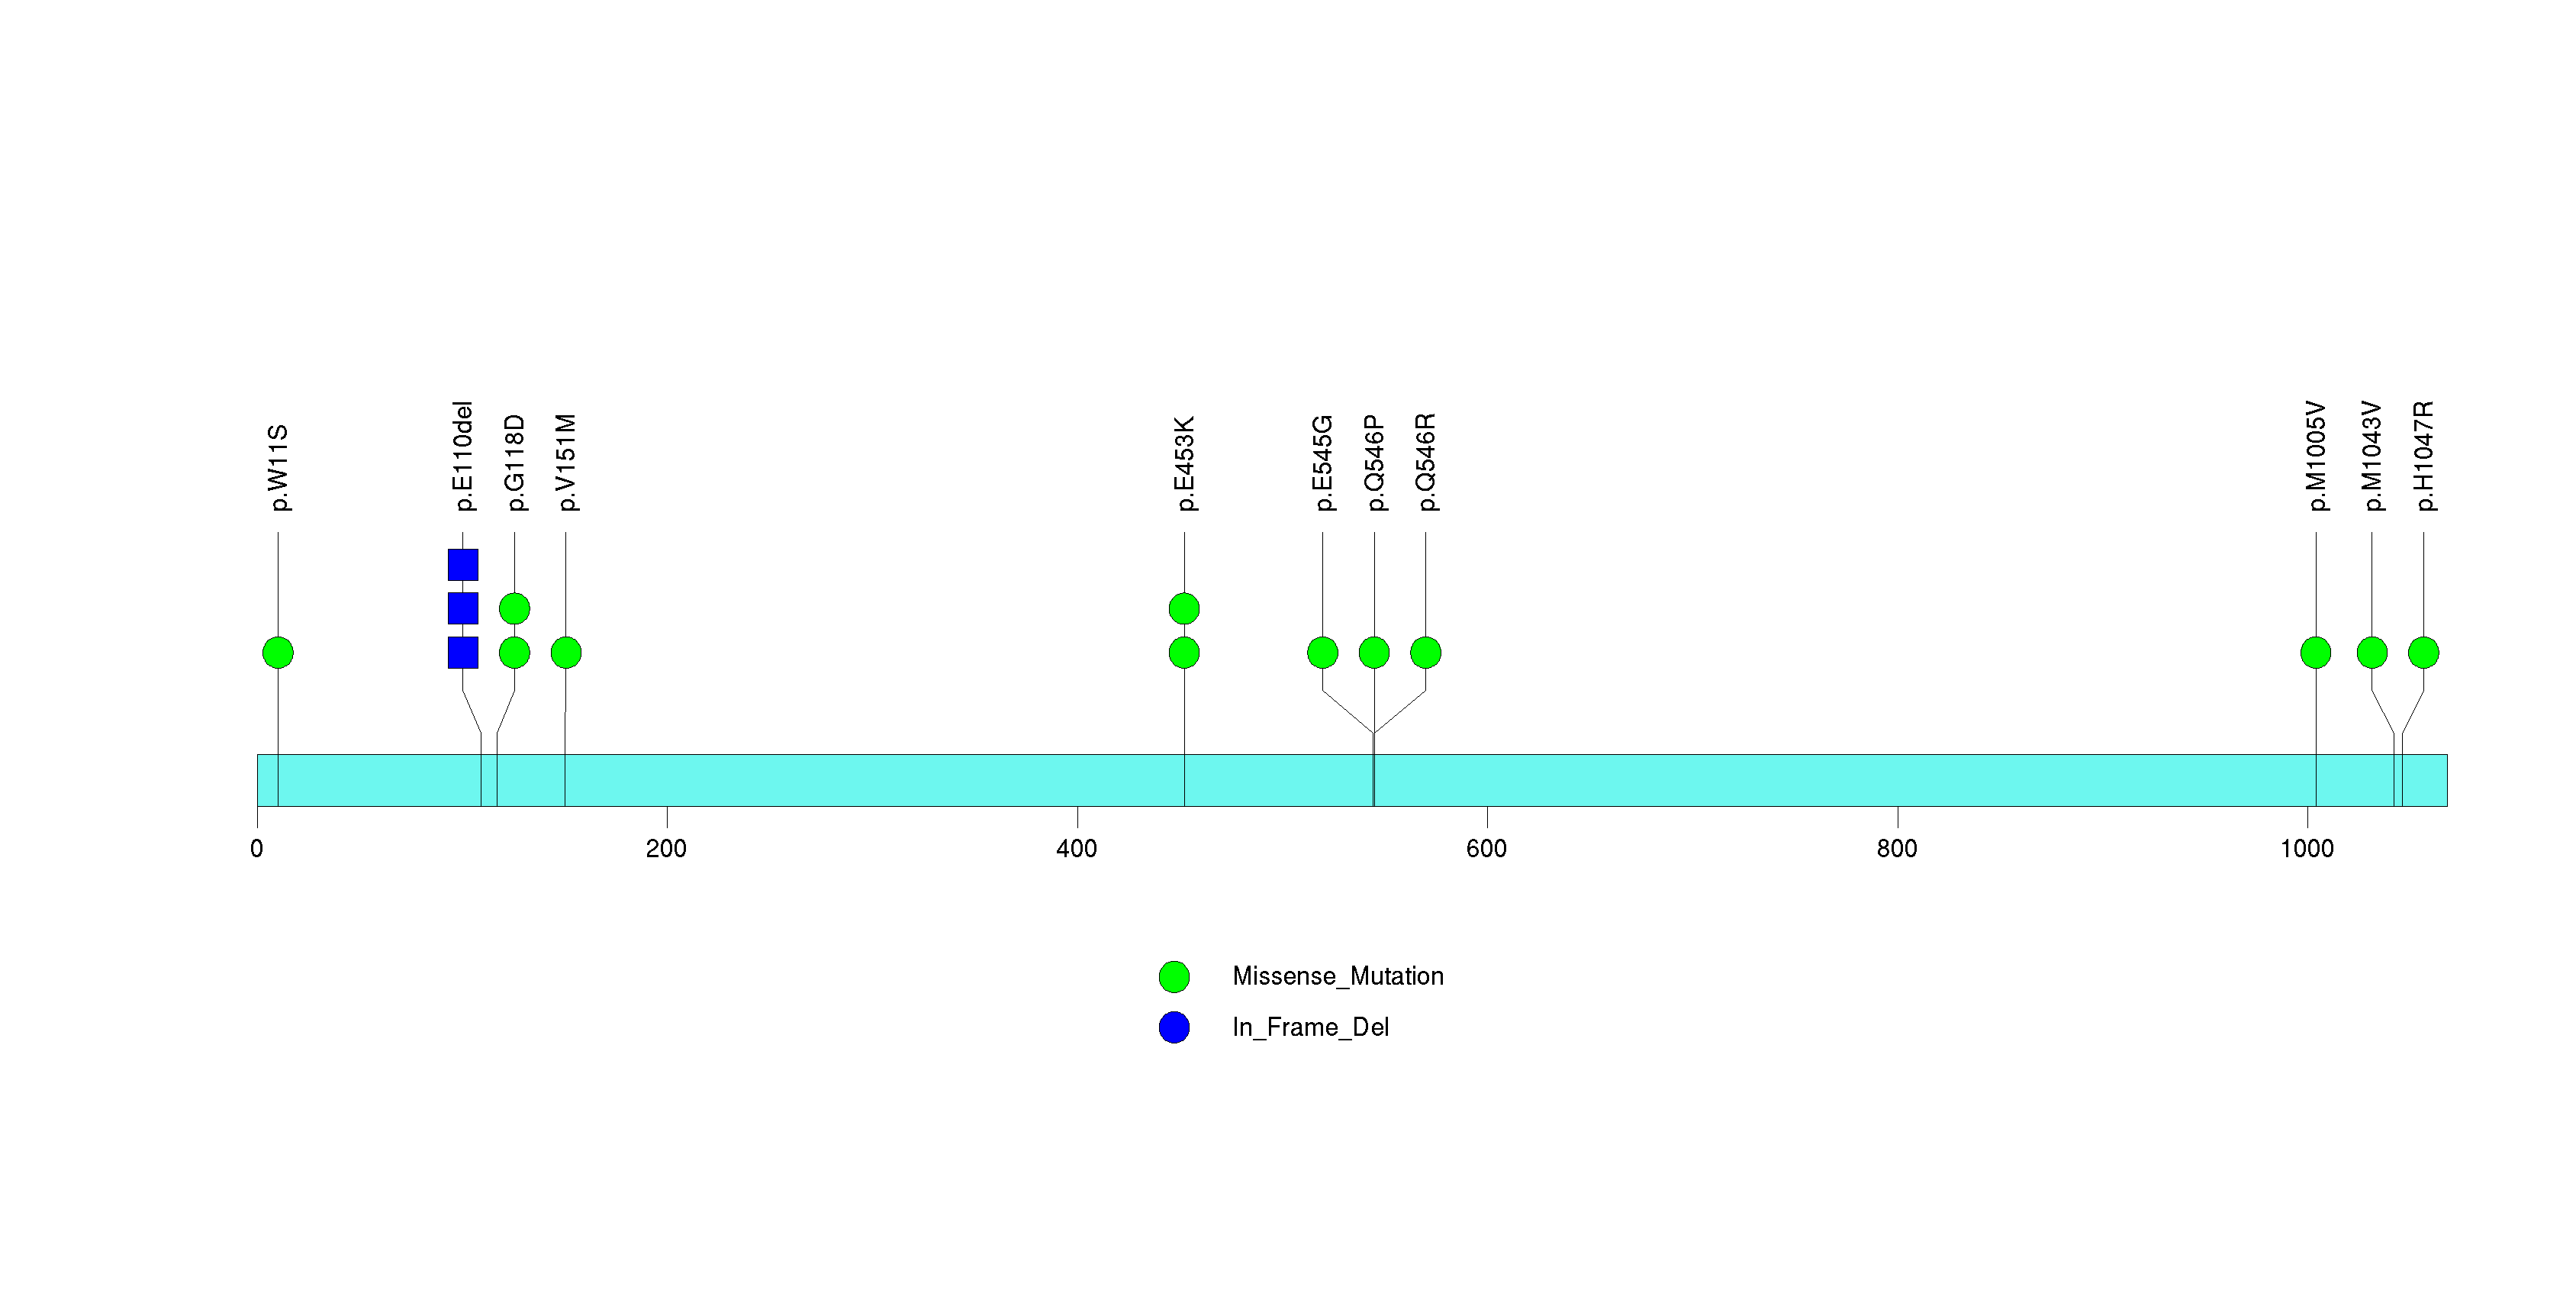
Figure S6. This figure depicts the distribution of mutations and mutation types across the FUBP1 significant gene.
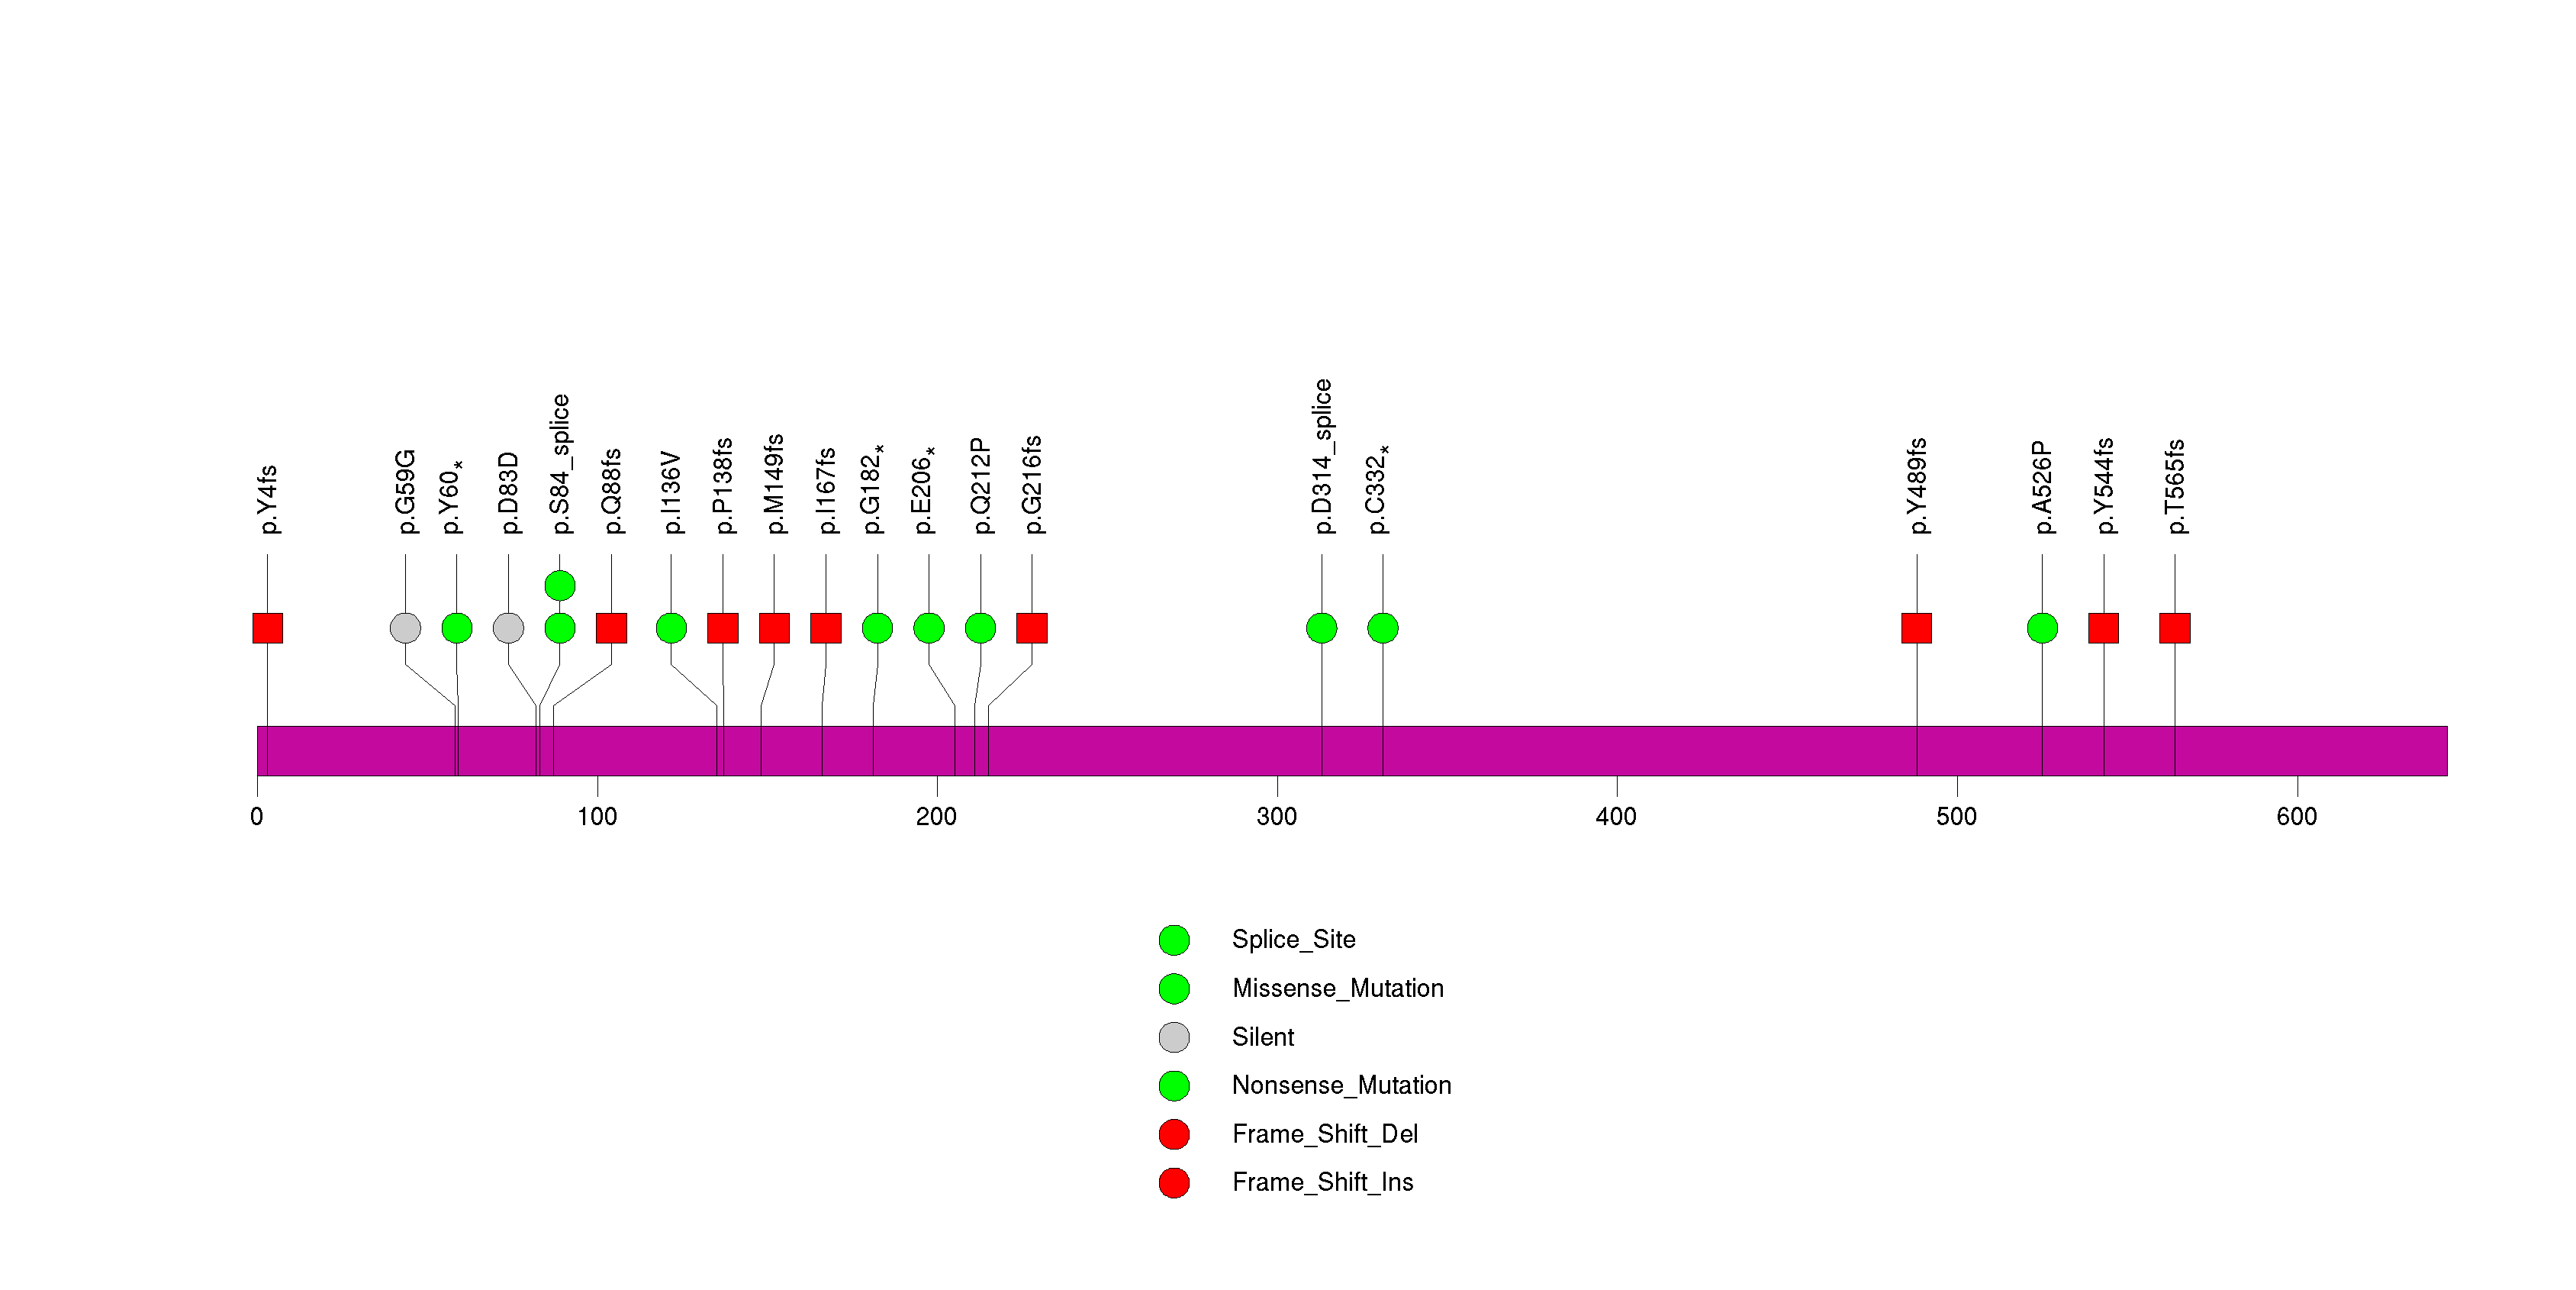
Figure S7. This figure depicts the distribution of mutations and mutation types across the PIK3R1 significant gene.
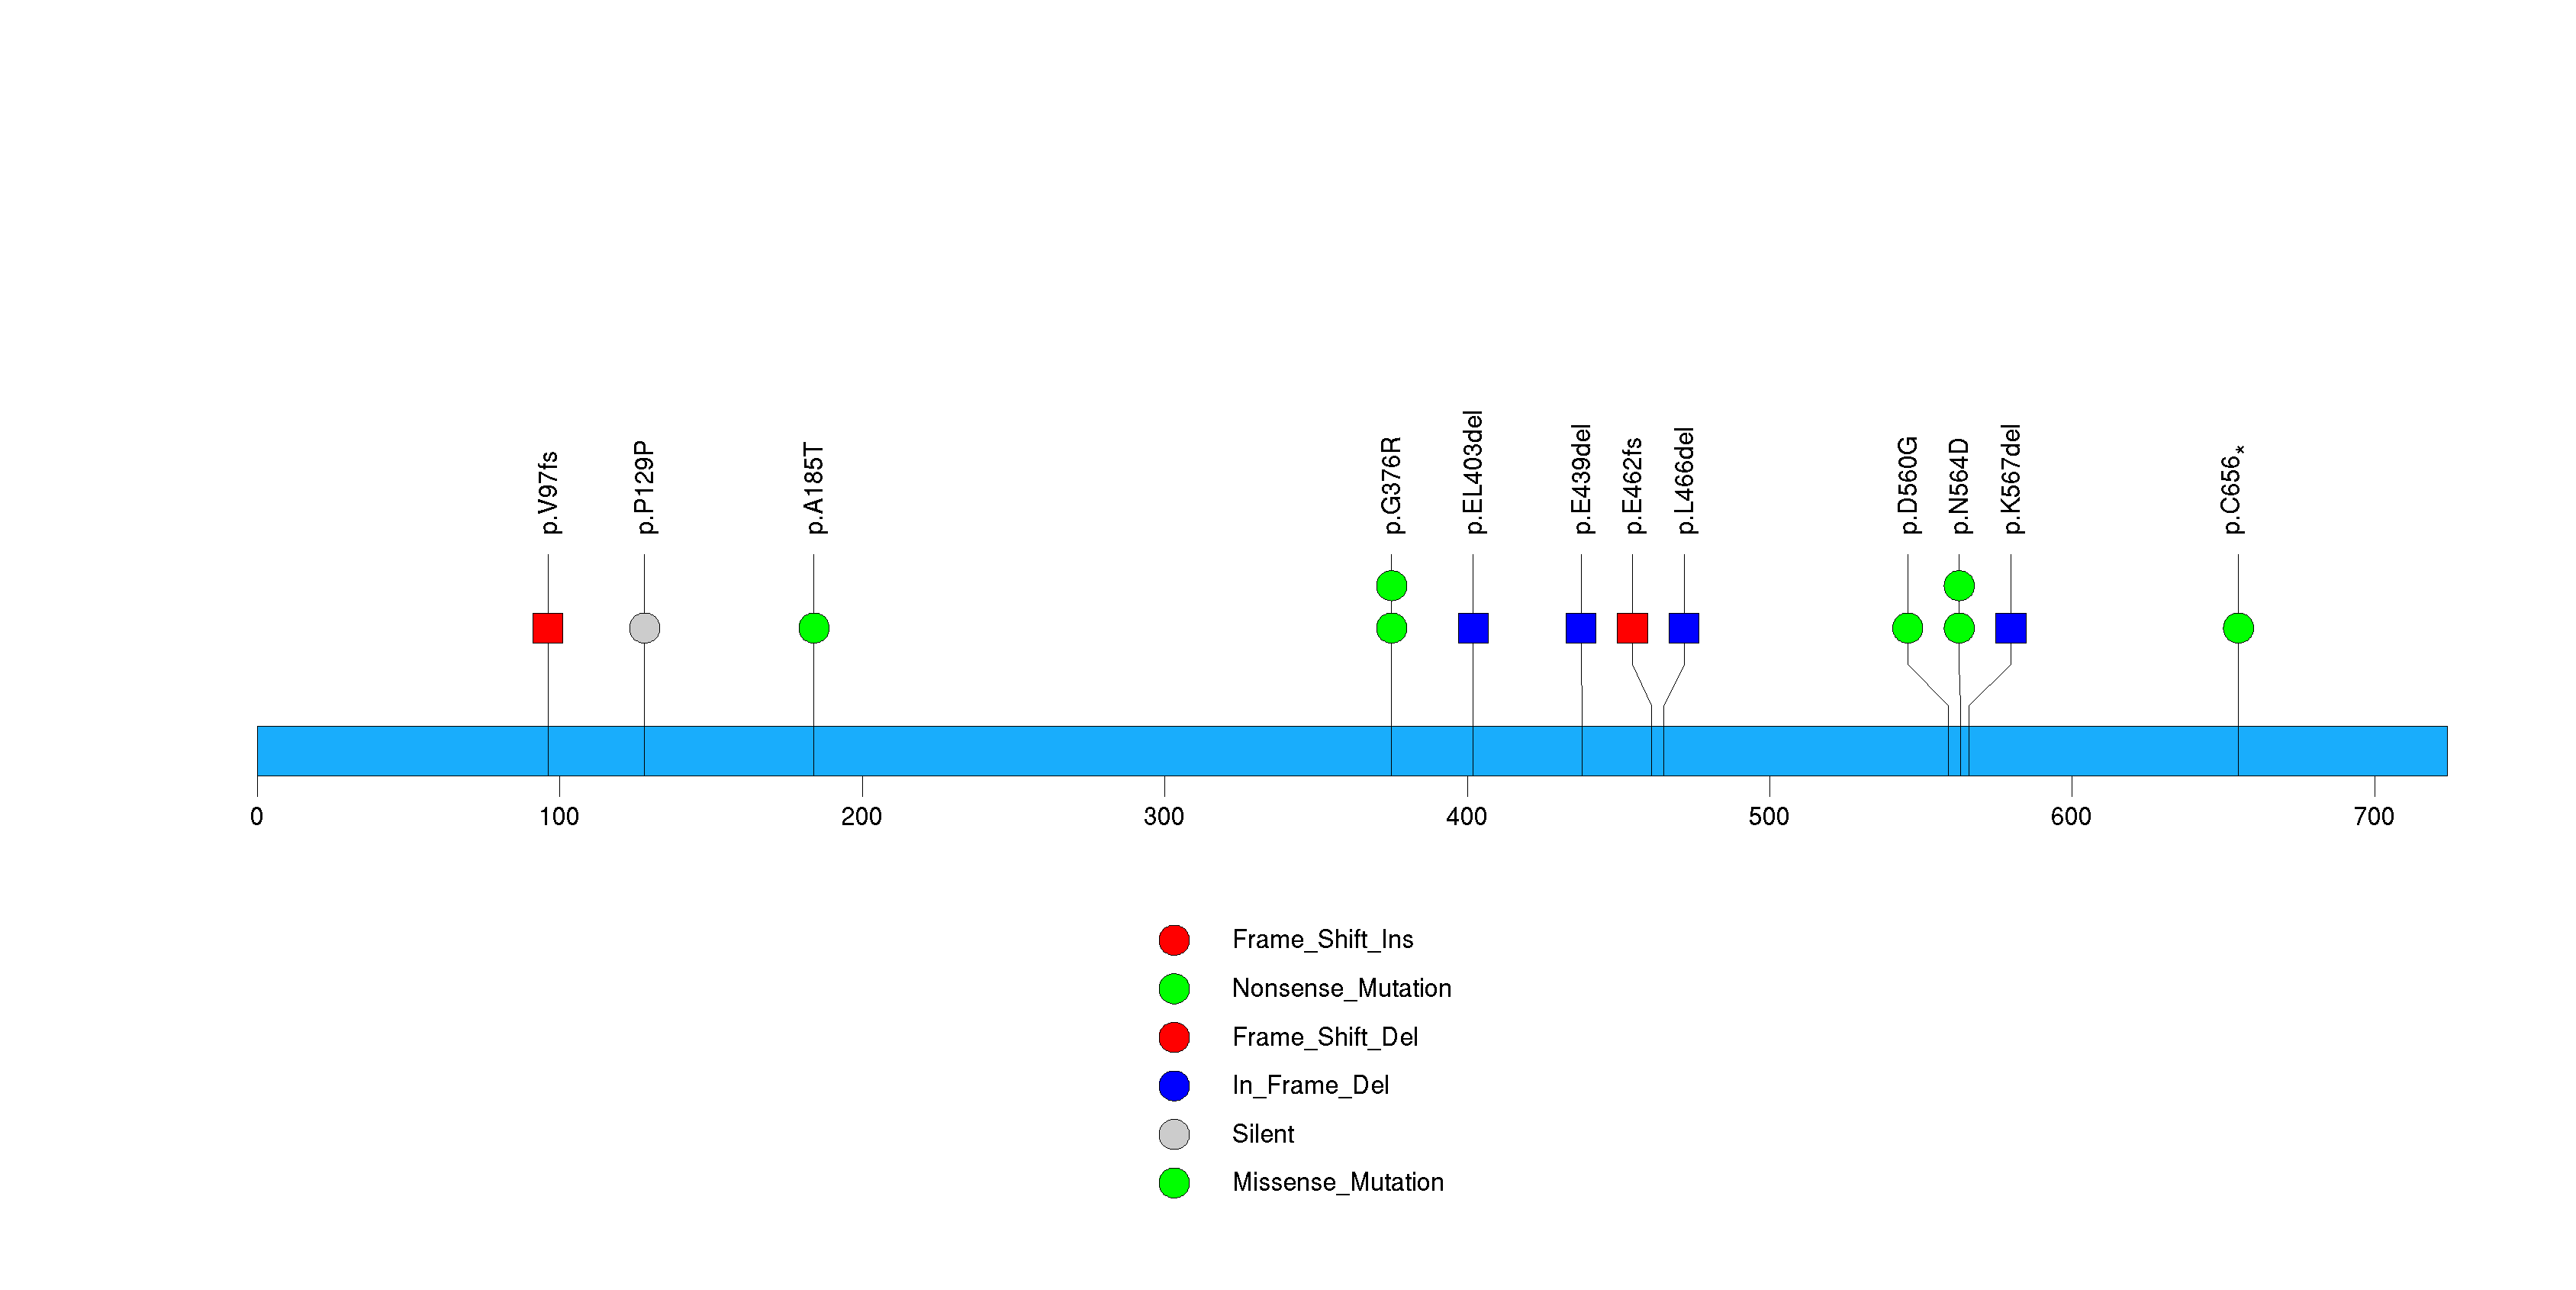
Figure S8. This figure depicts the distribution of mutations and mutation types across the NOTCH1 significant gene.
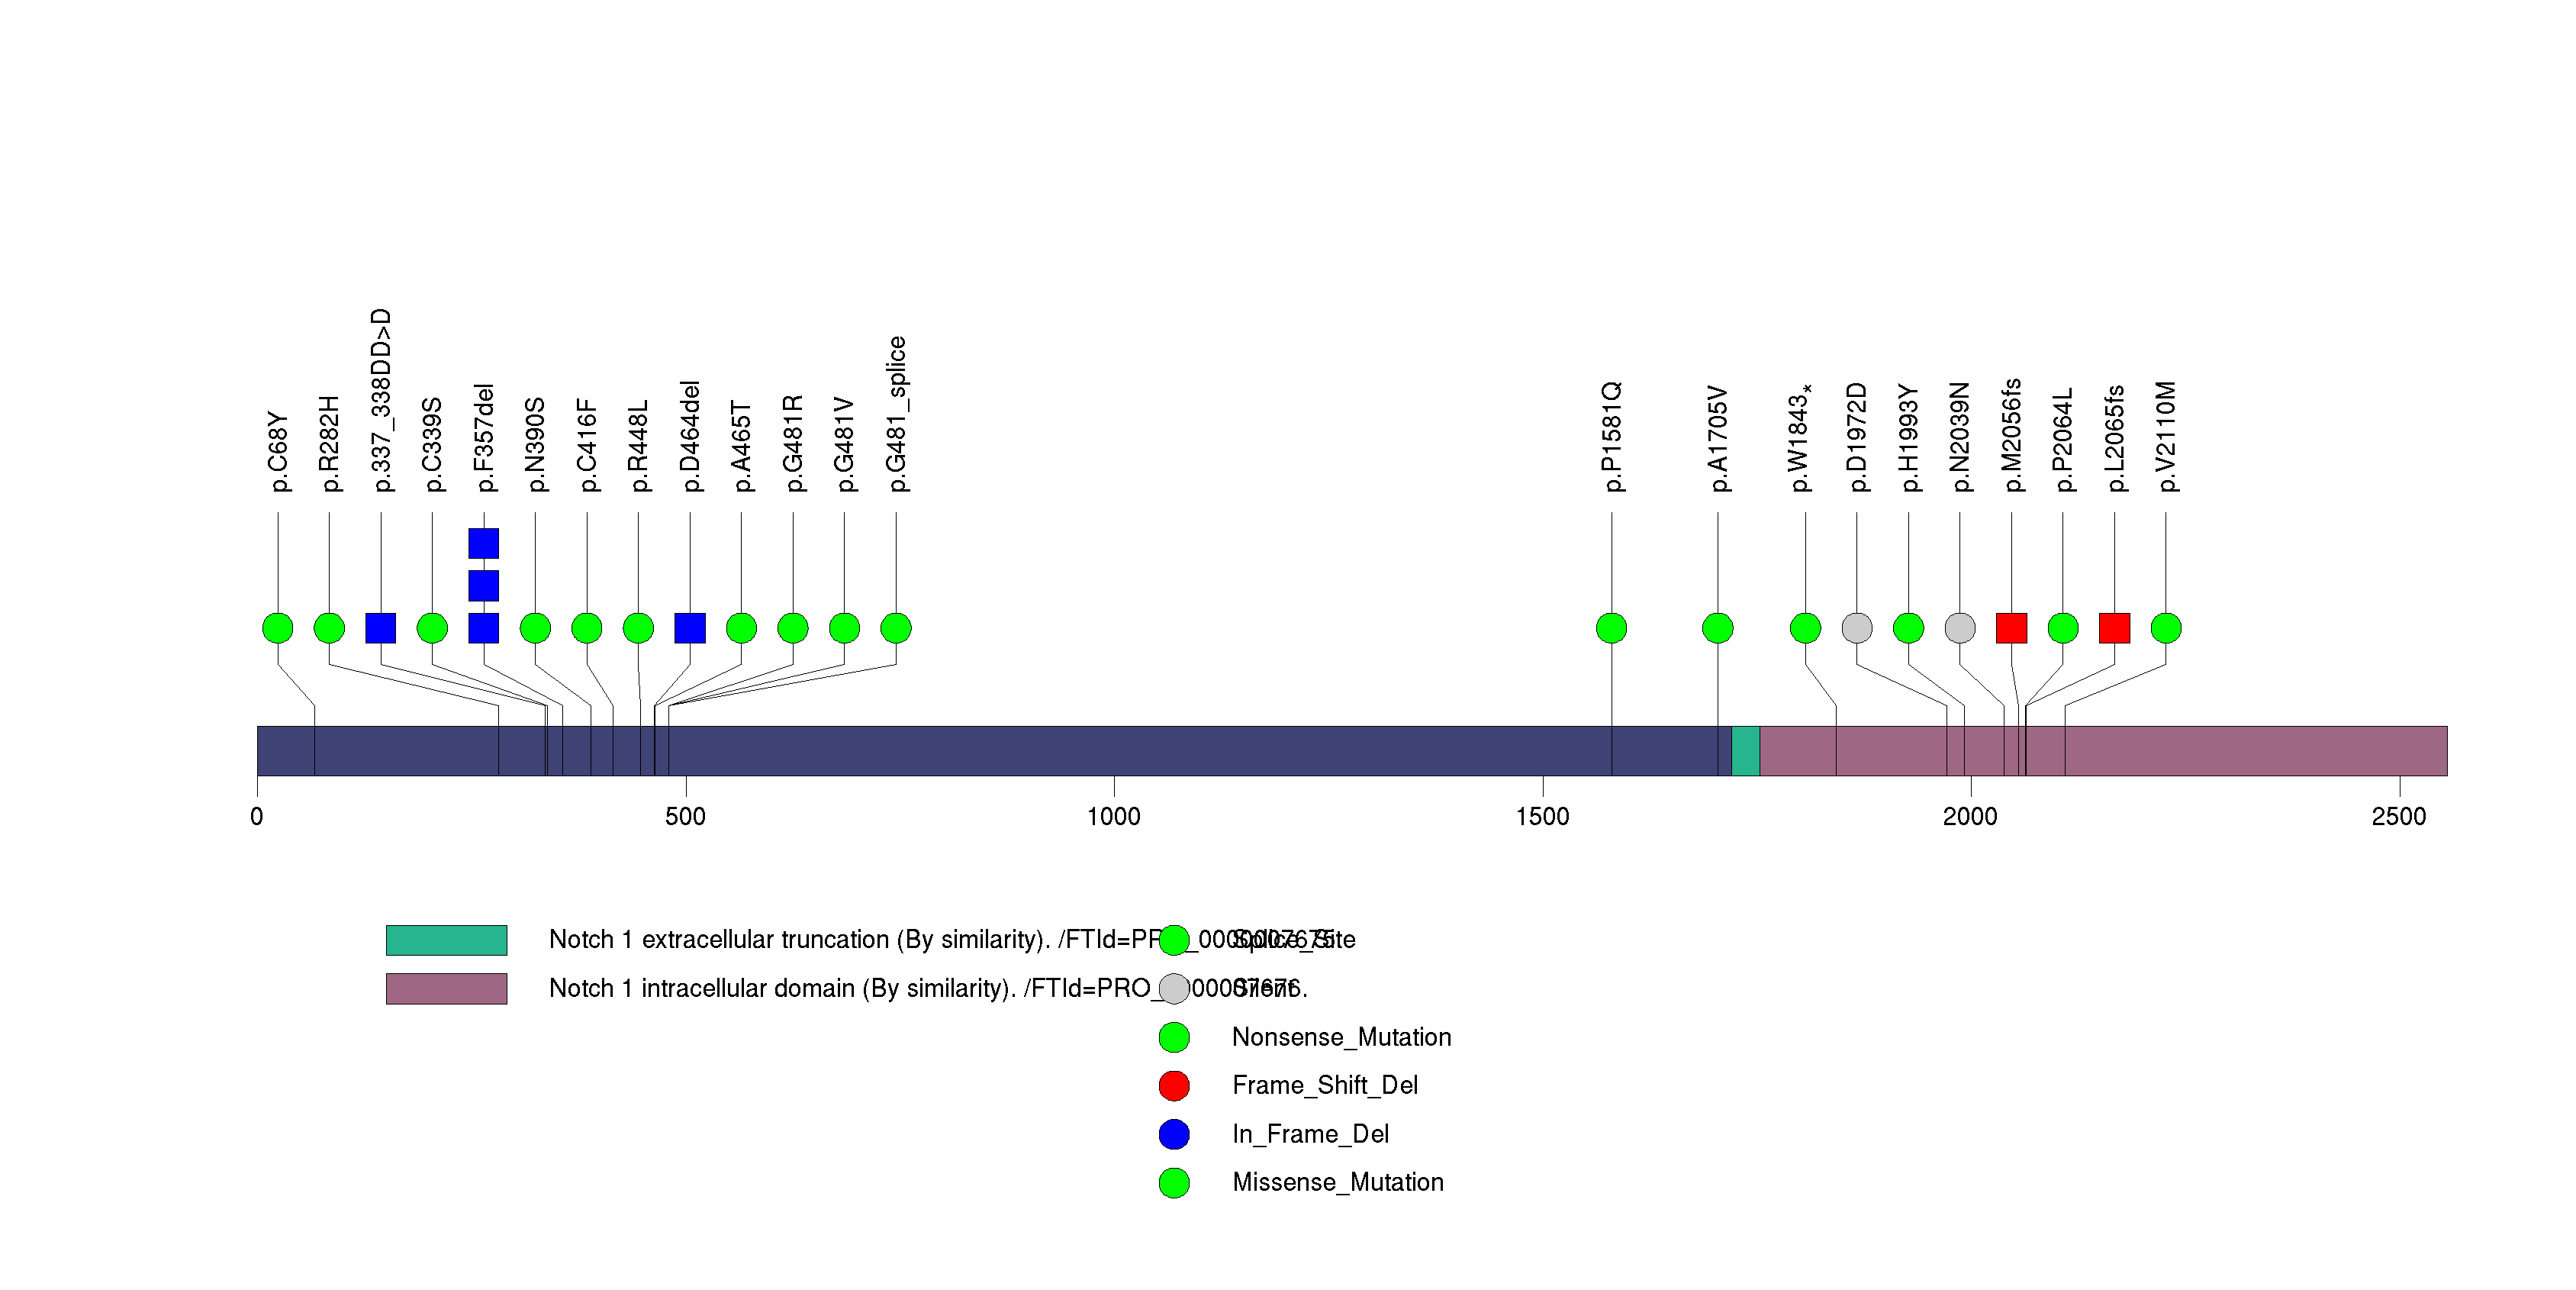
Figure S9. This figure depicts the distribution of mutations and mutation types across the PTEN significant gene.
Figure S10. This figure depicts the distribution of mutations and mutation types across the ARID1A significant gene.
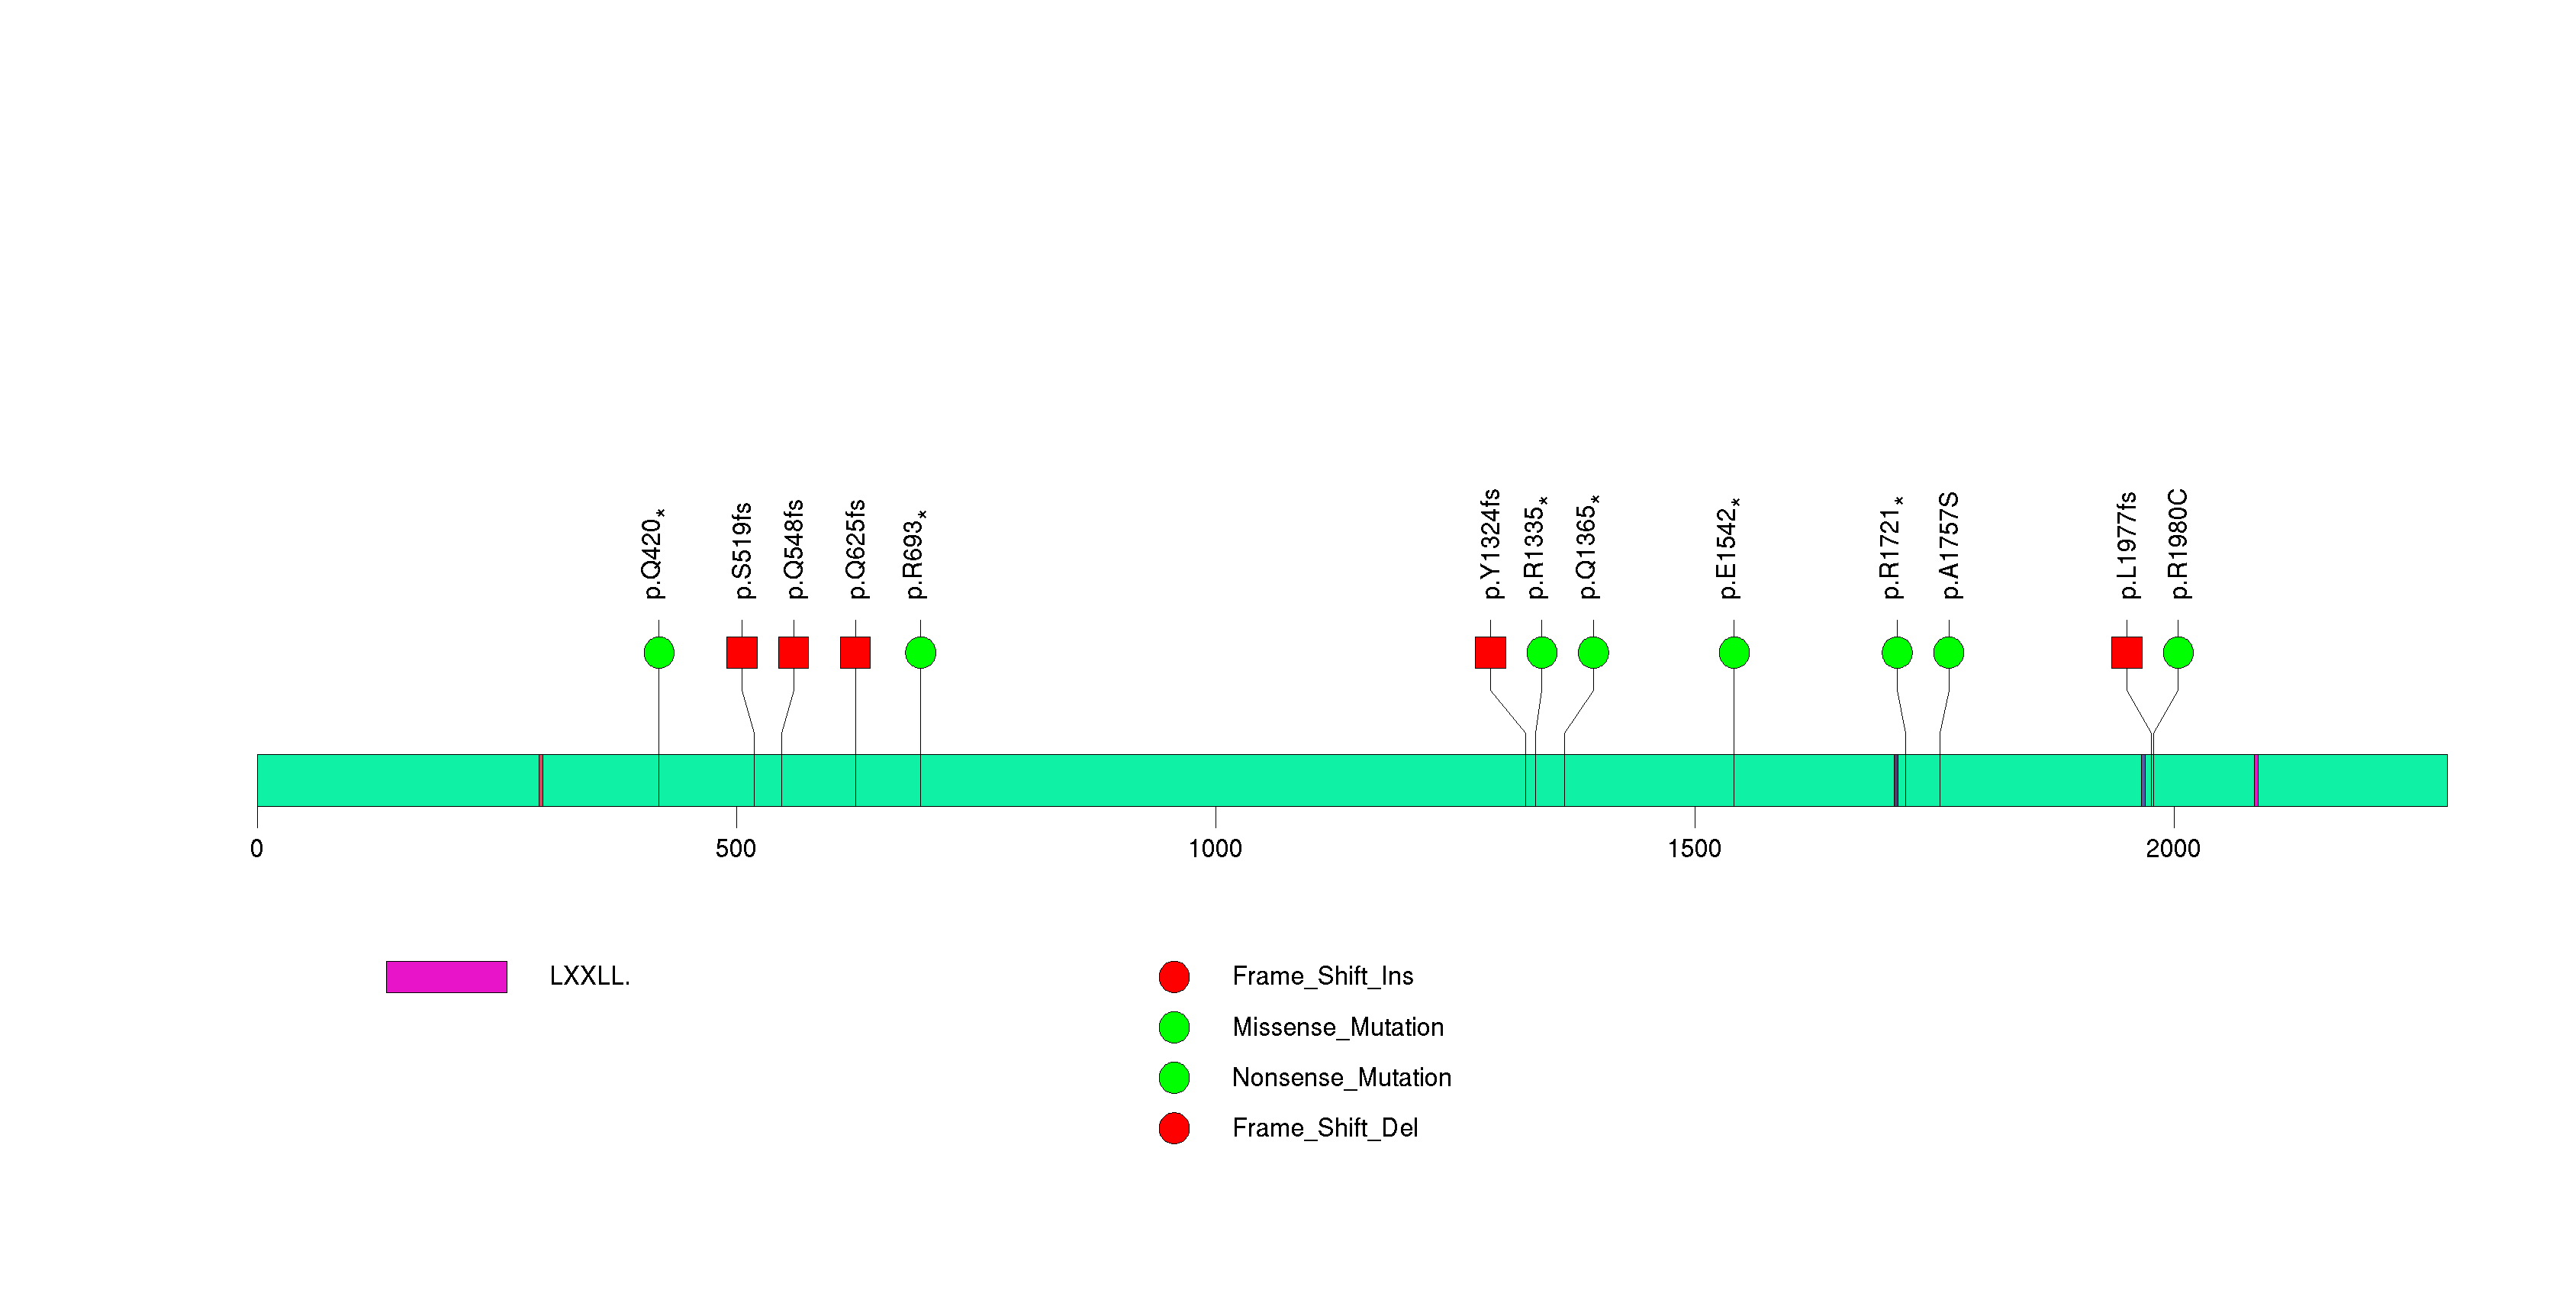
Figure S11. This figure depicts the distribution of mutations and mutation types across the TIMD4 significant gene.
Figure S12. This figure depicts the distribution of mutations and mutation types across the NF1 significant gene.
Figure S13. This figure depicts the distribution of mutations and mutation types across the IDH2 significant gene.
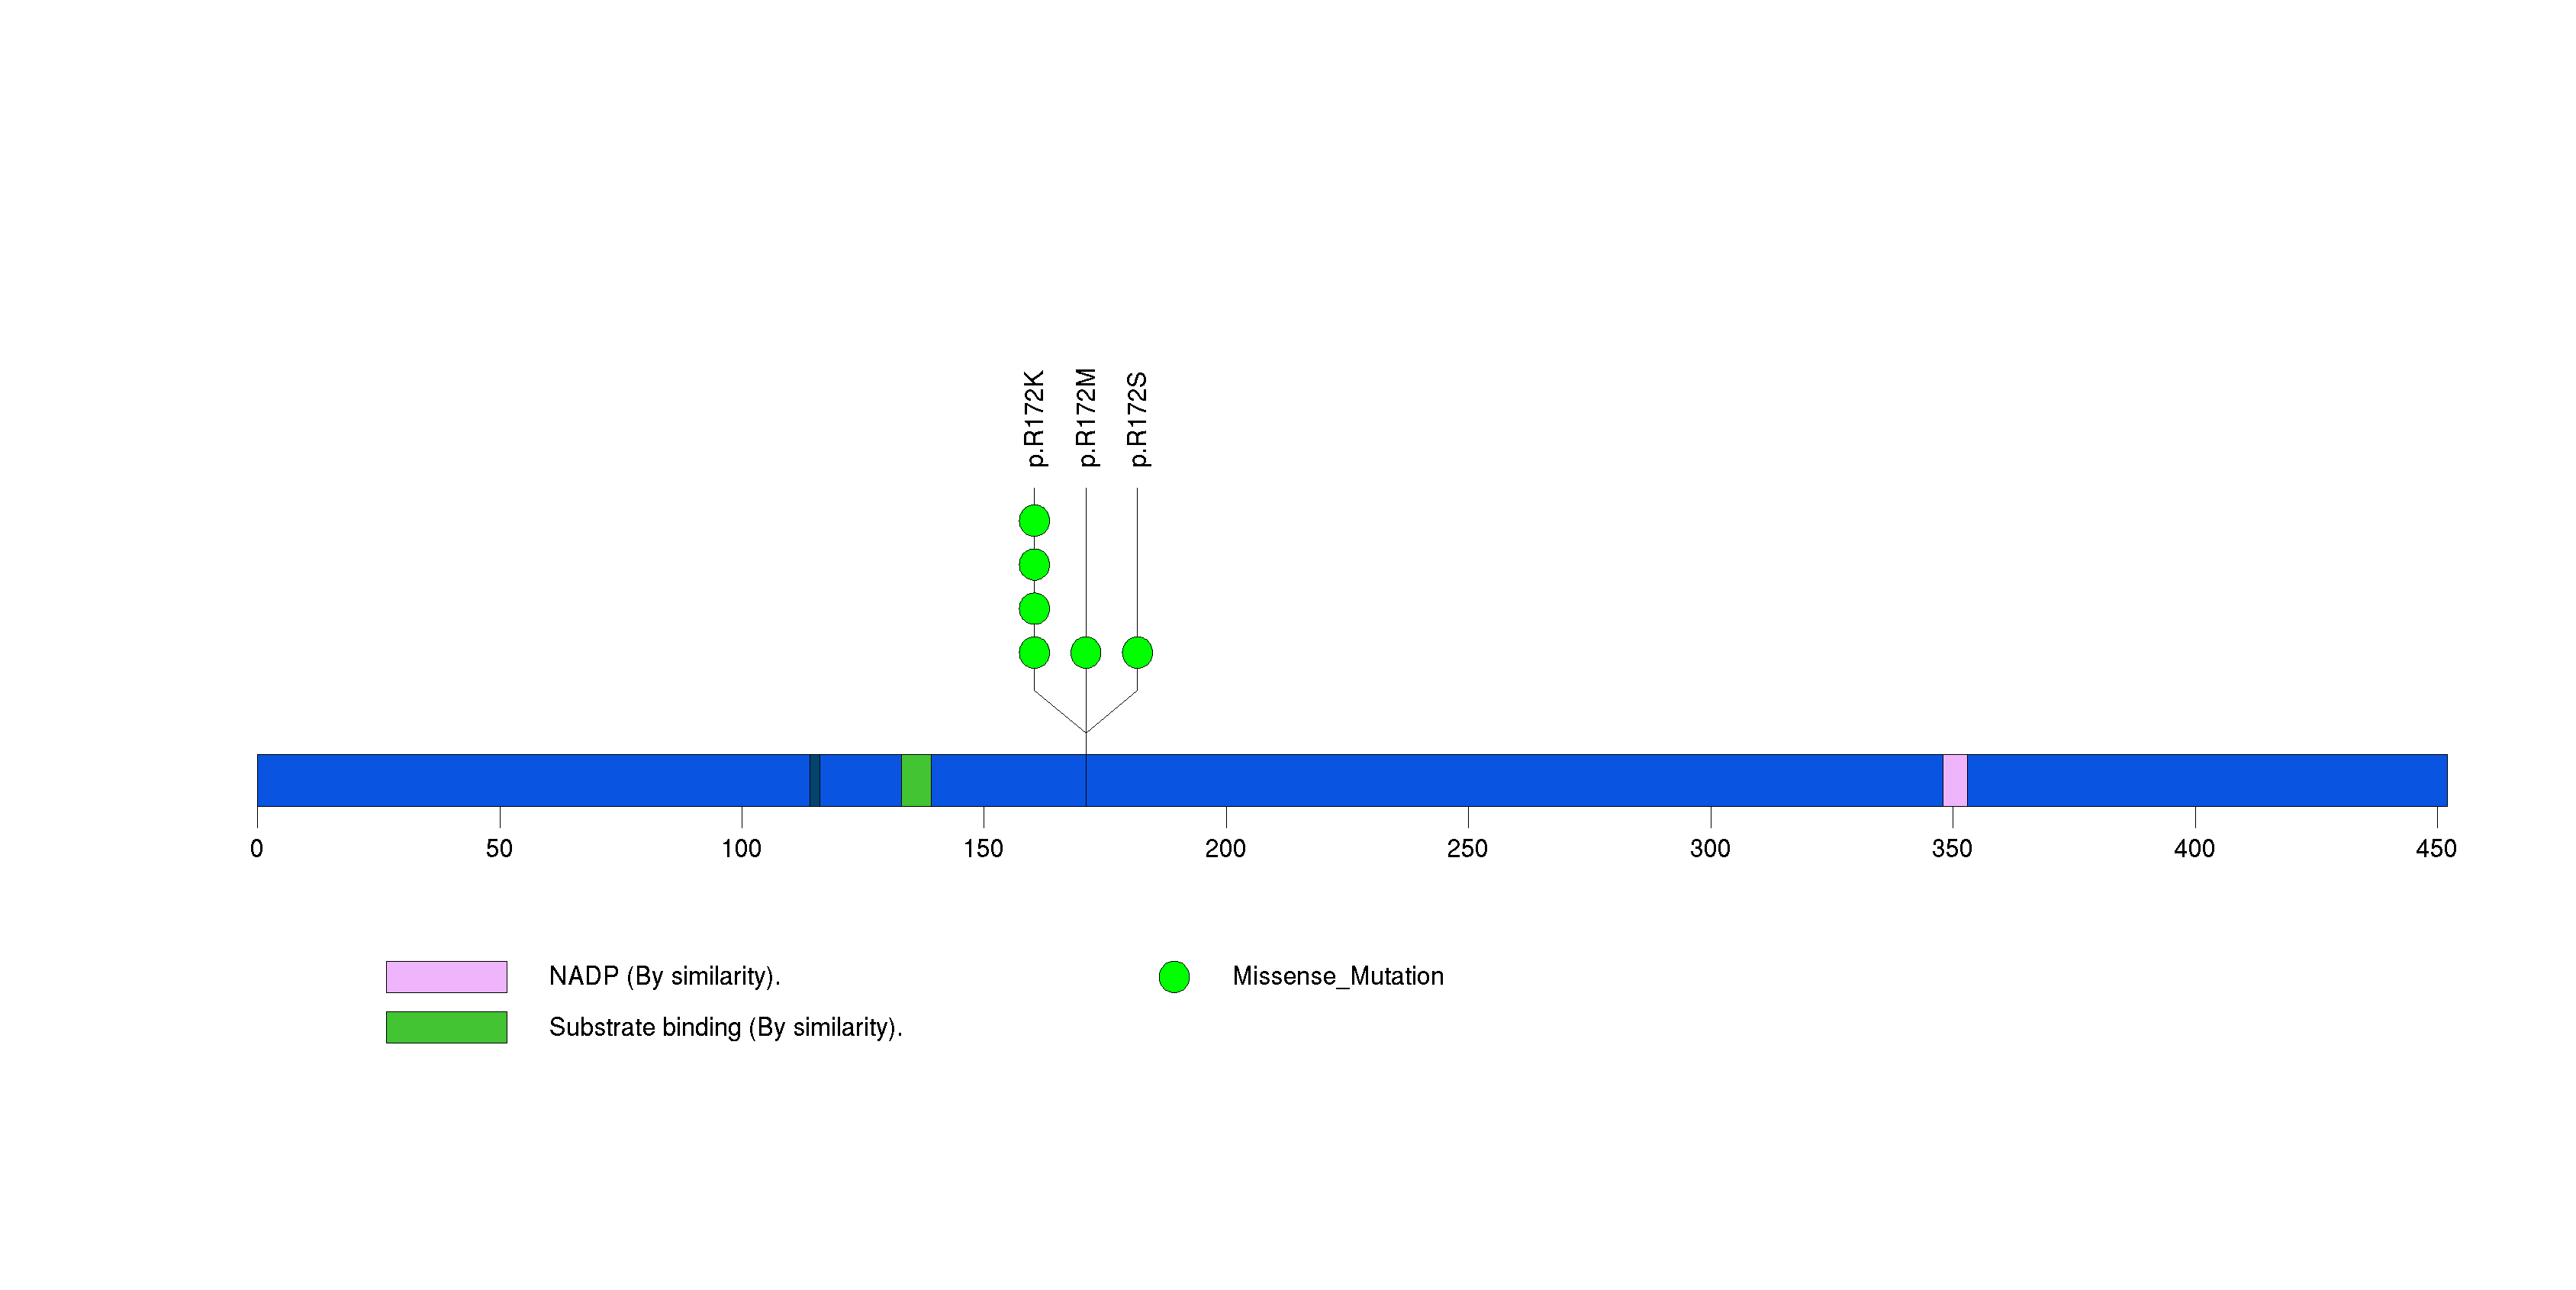
Figure S14. This figure depicts the distribution of mutations and mutation types across the ZNF844 significant gene.
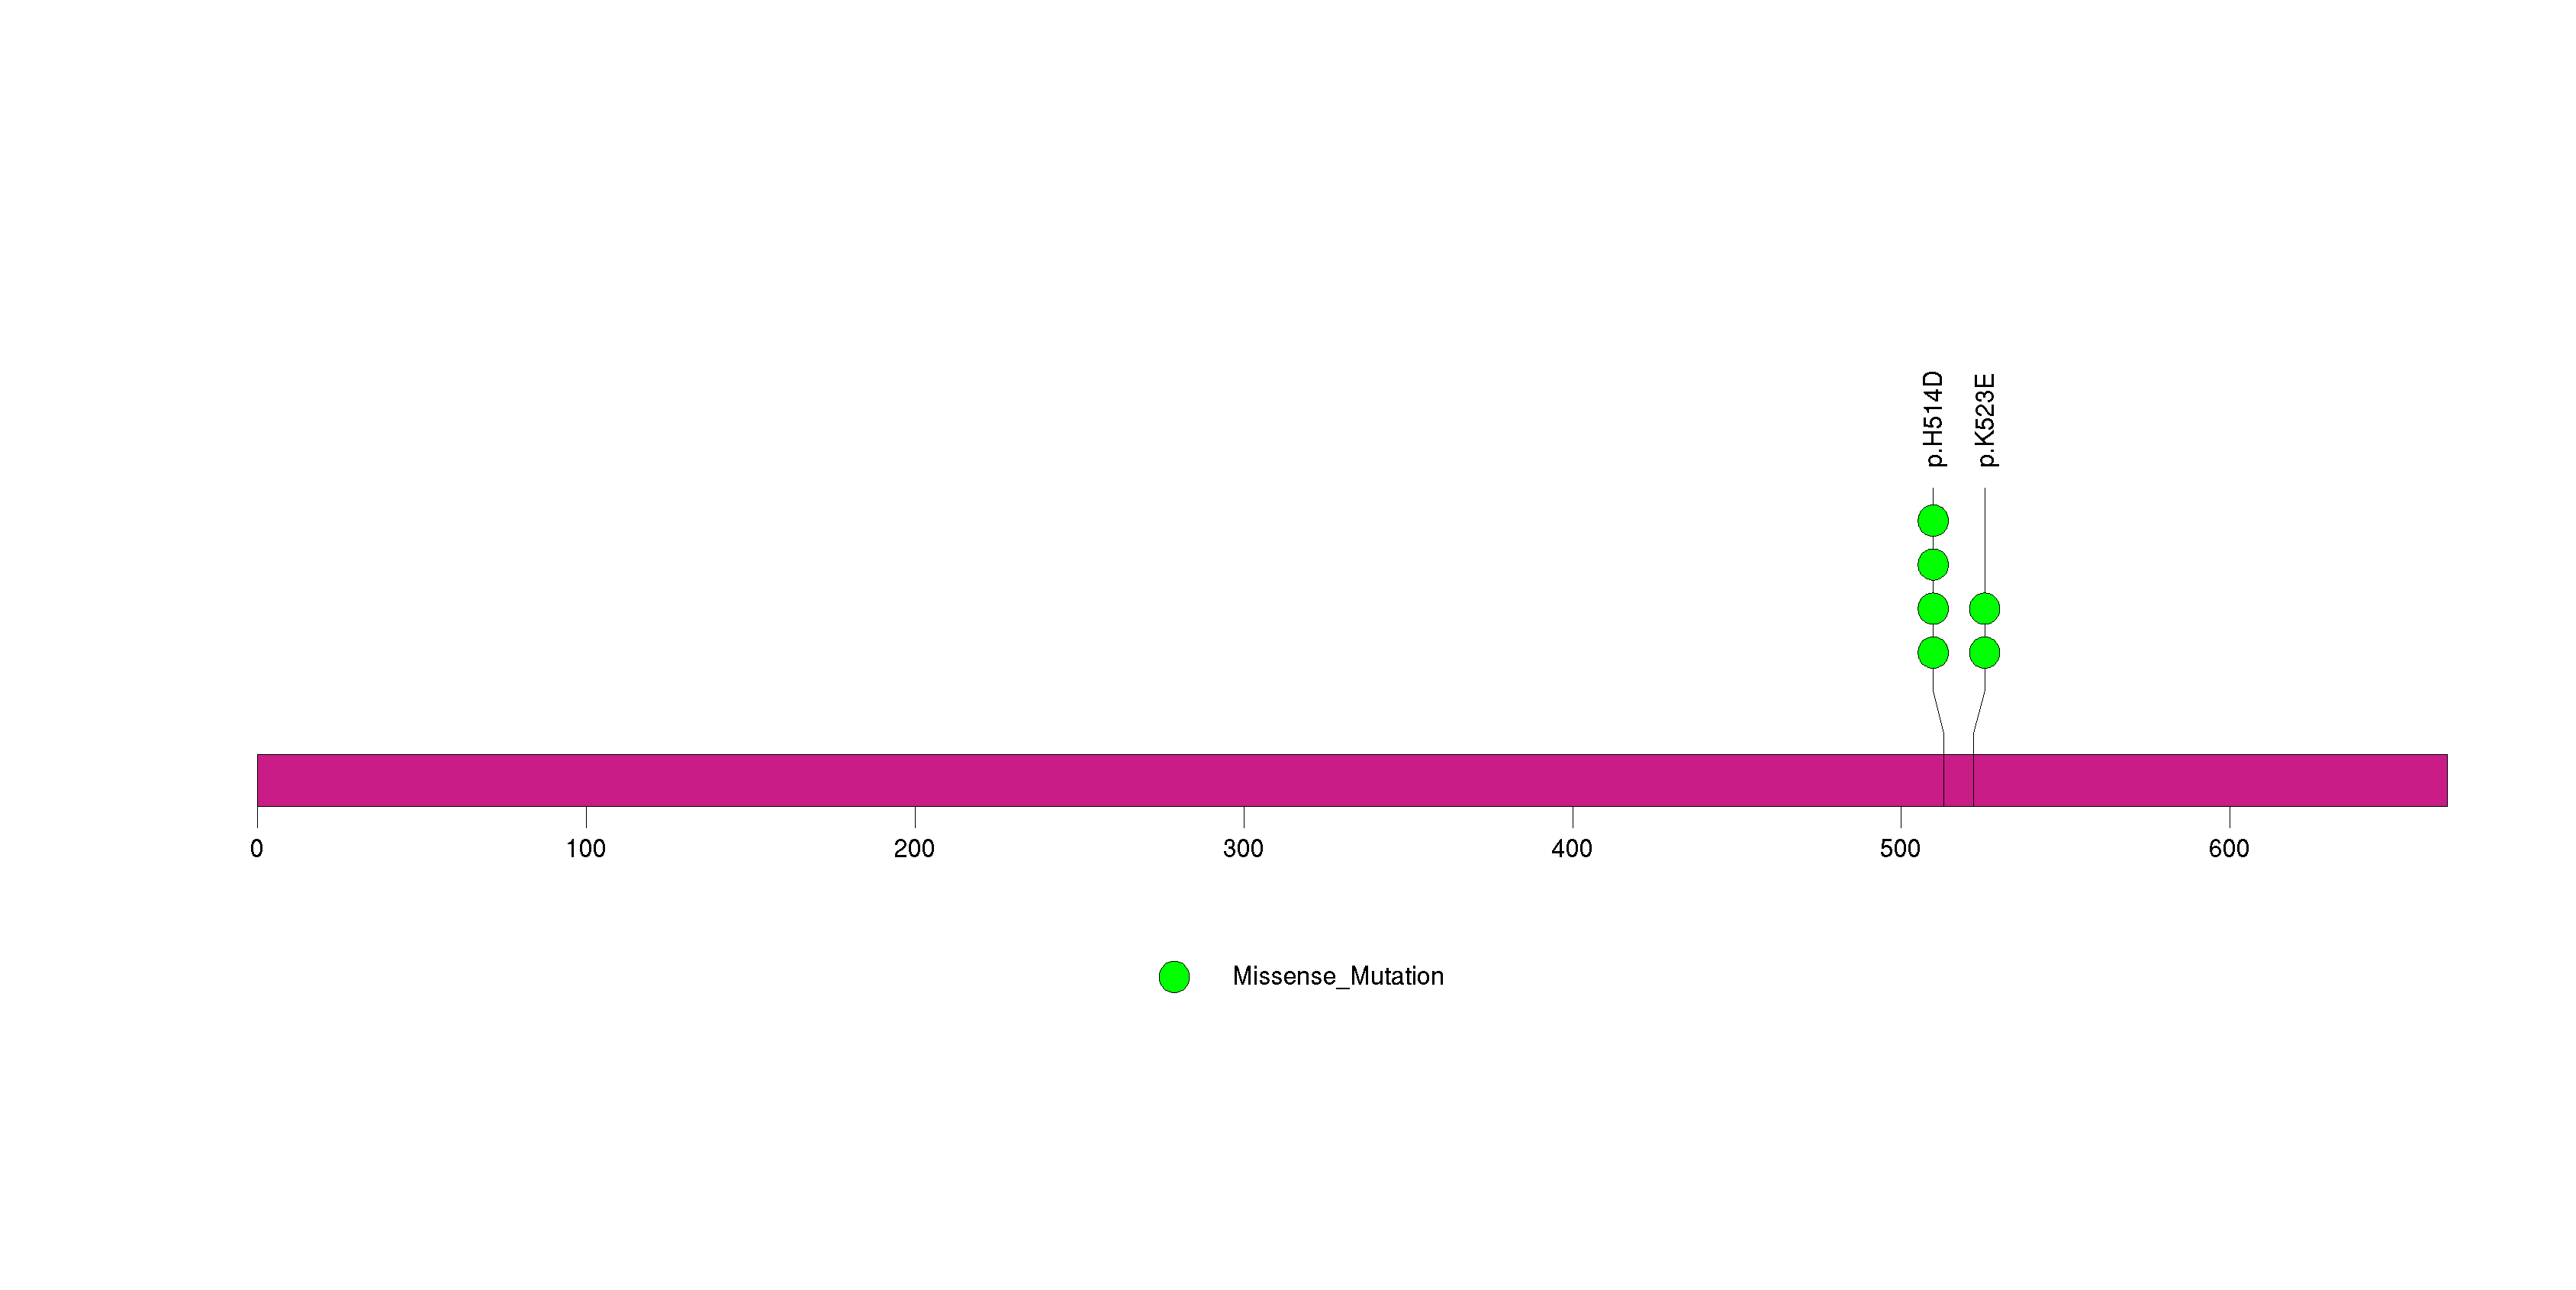
Figure S15. This figure depicts the distribution of mutations and mutation types across the IL32 significant gene.
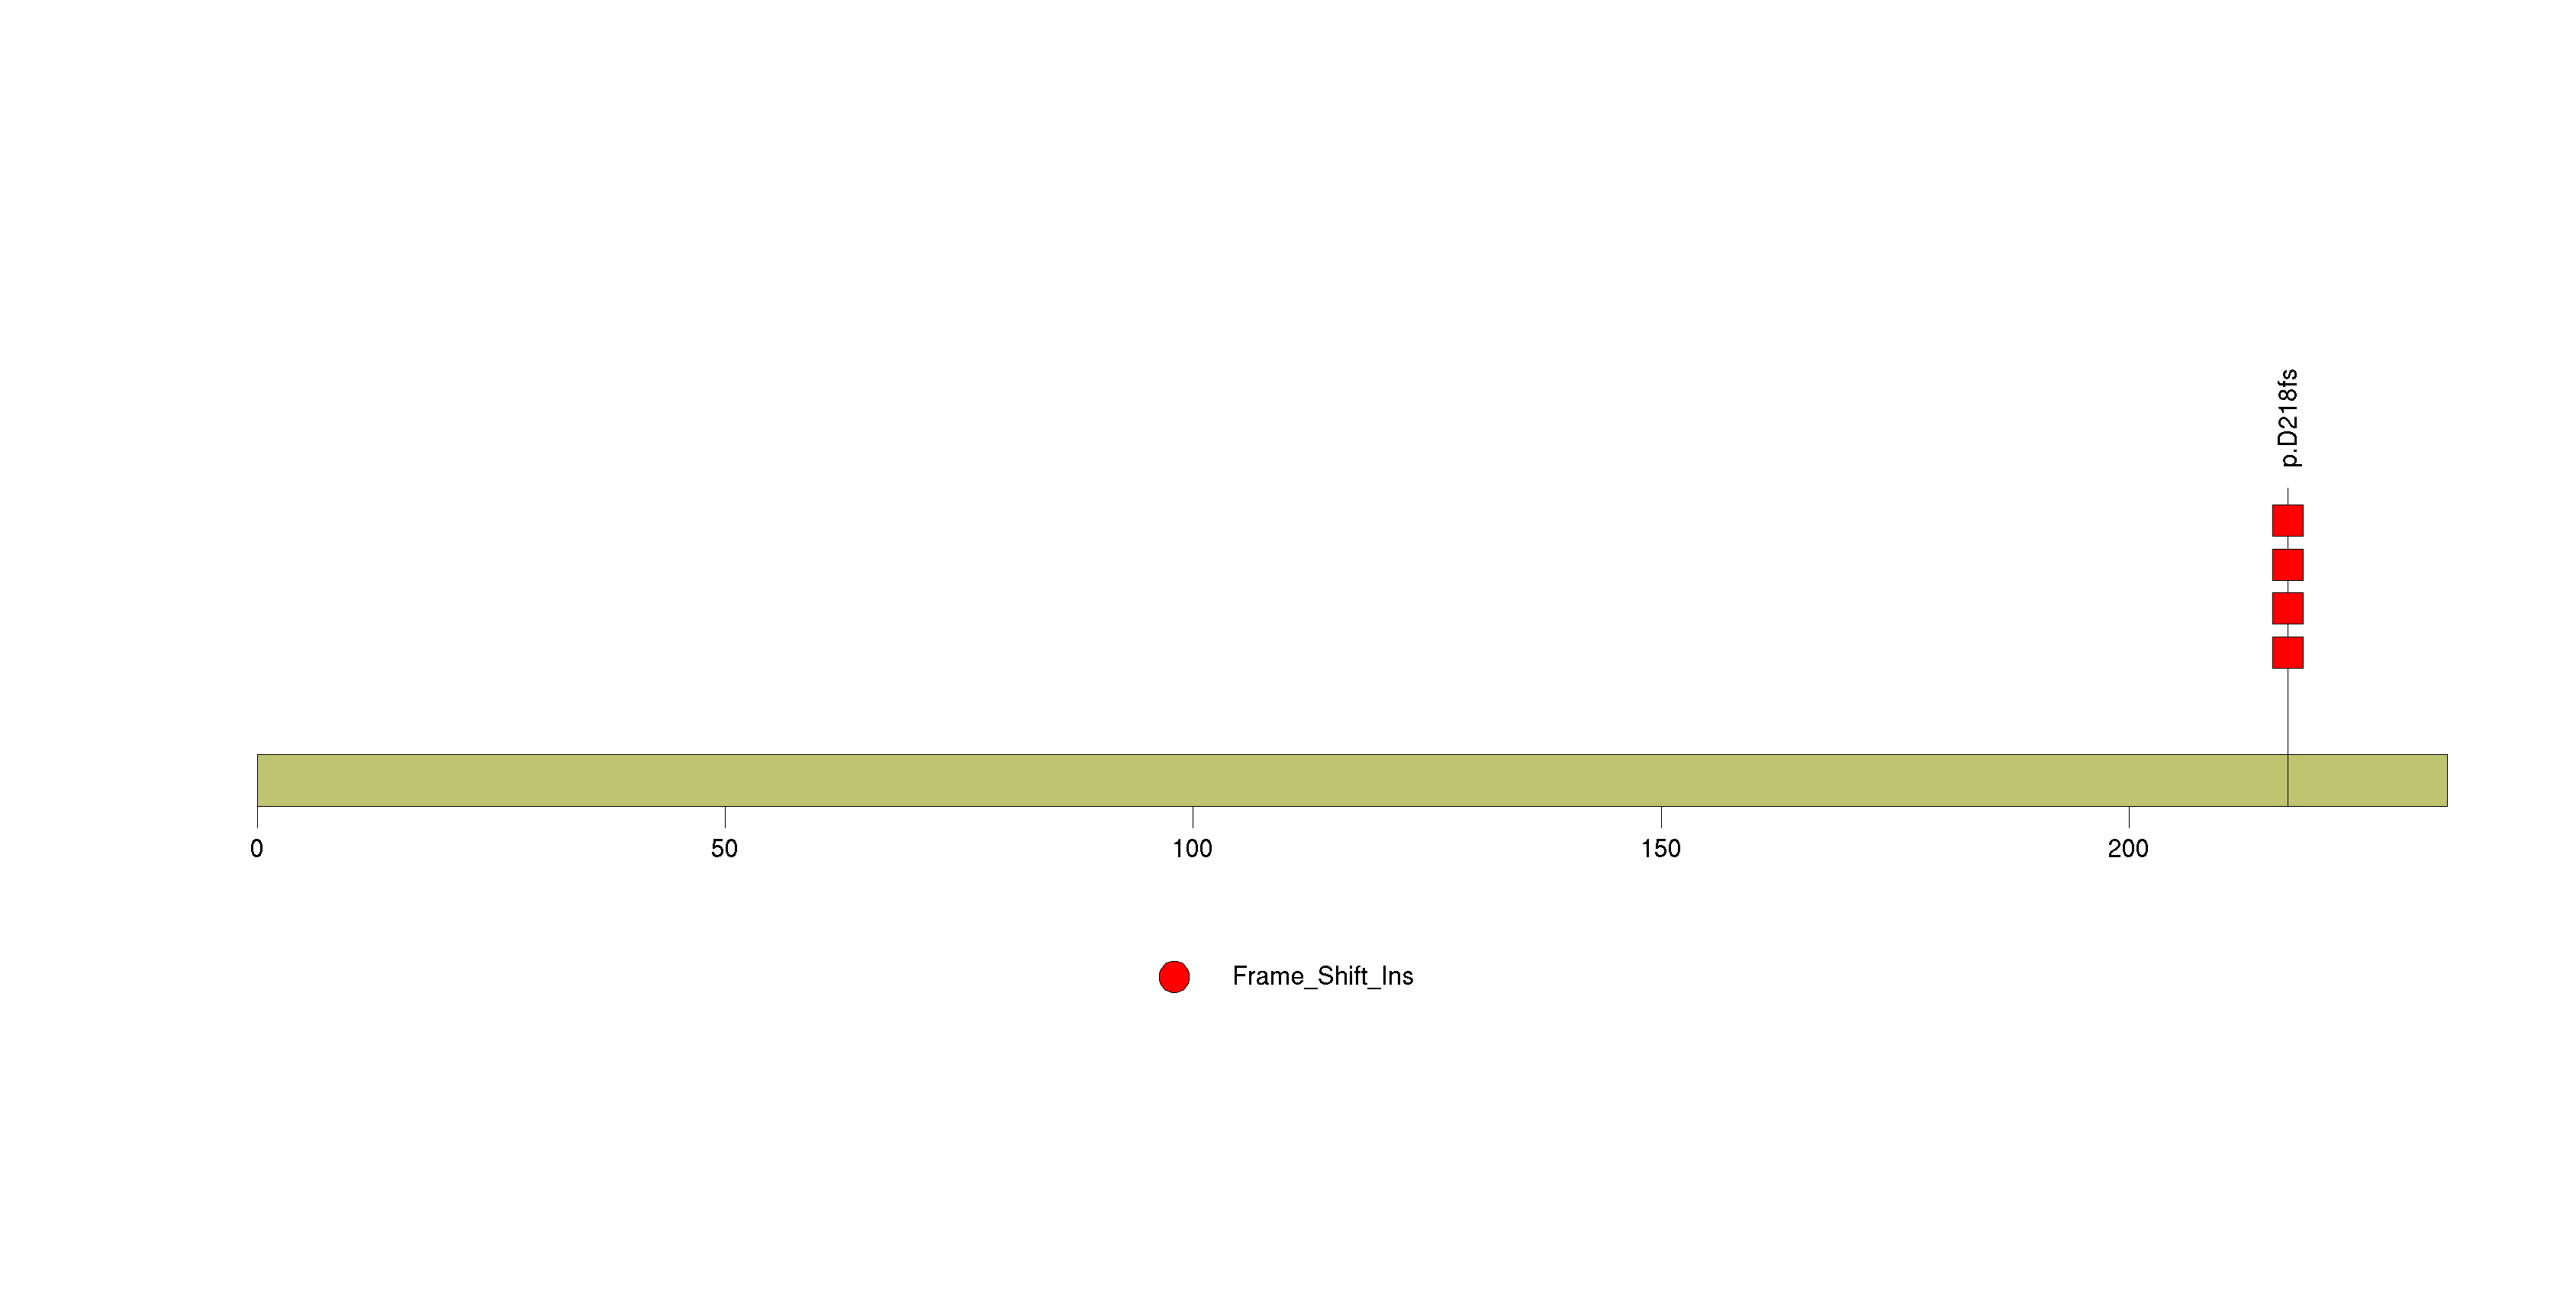
Figure S16. This figure depicts the distribution of mutations and mutation types across the TCF12 significant gene.
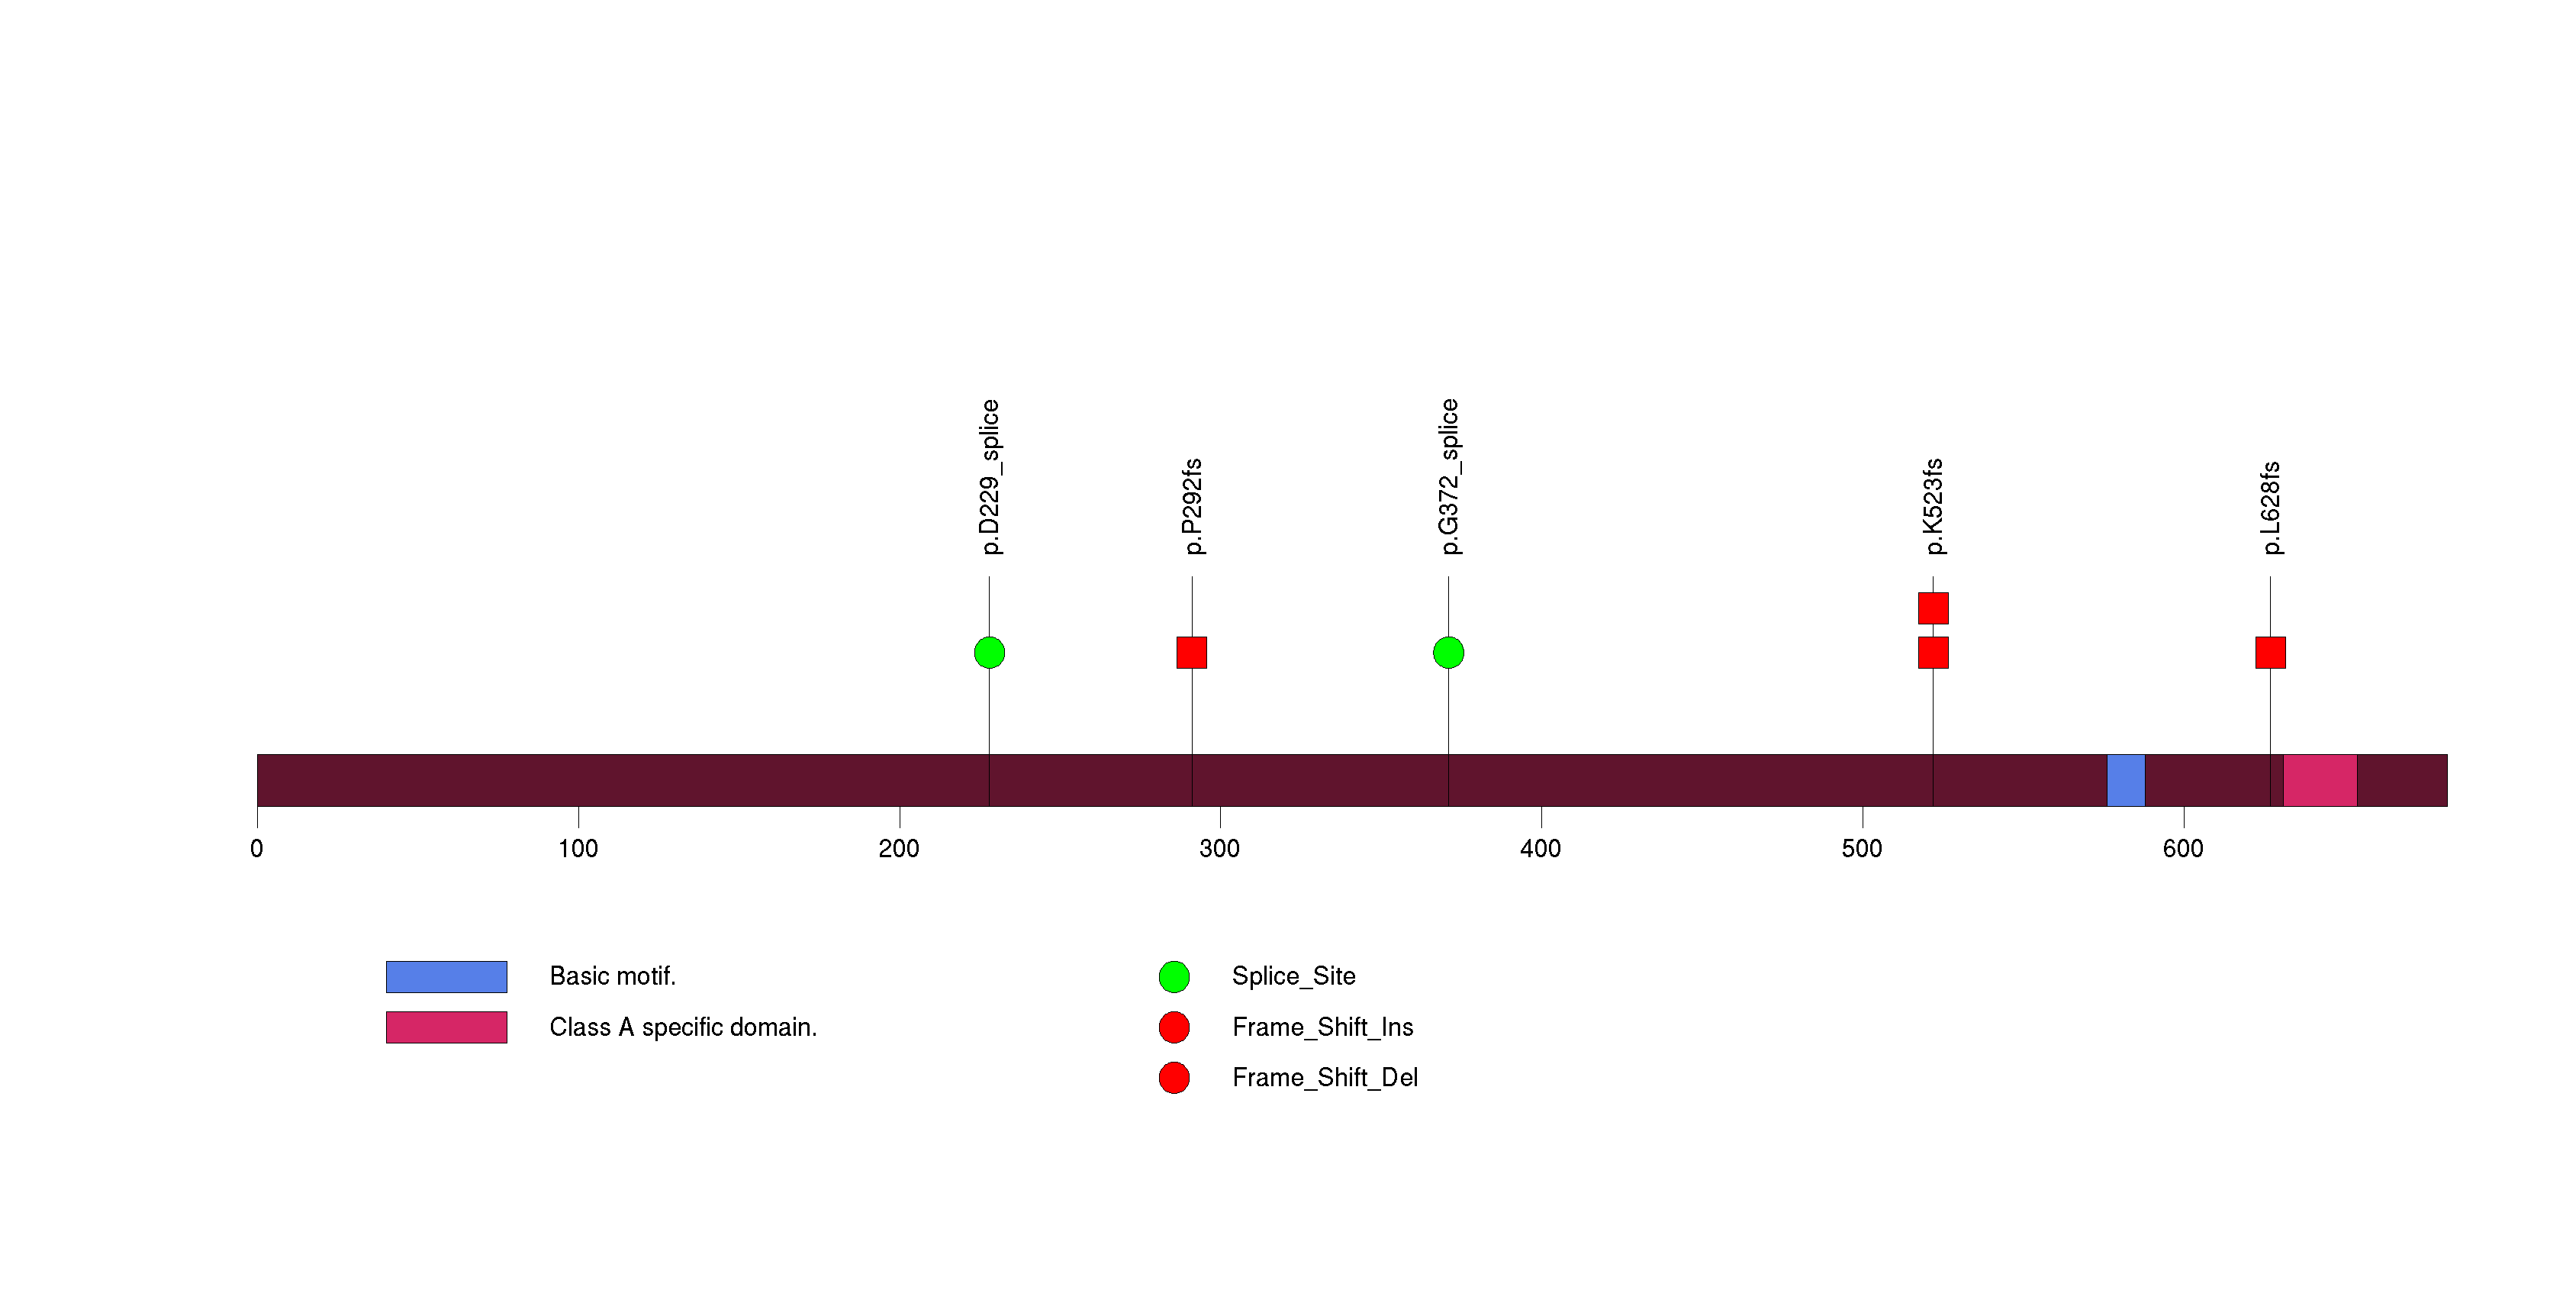
Figure S17. This figure depicts the distribution of mutations and mutation types across the ZBTB20 significant gene.
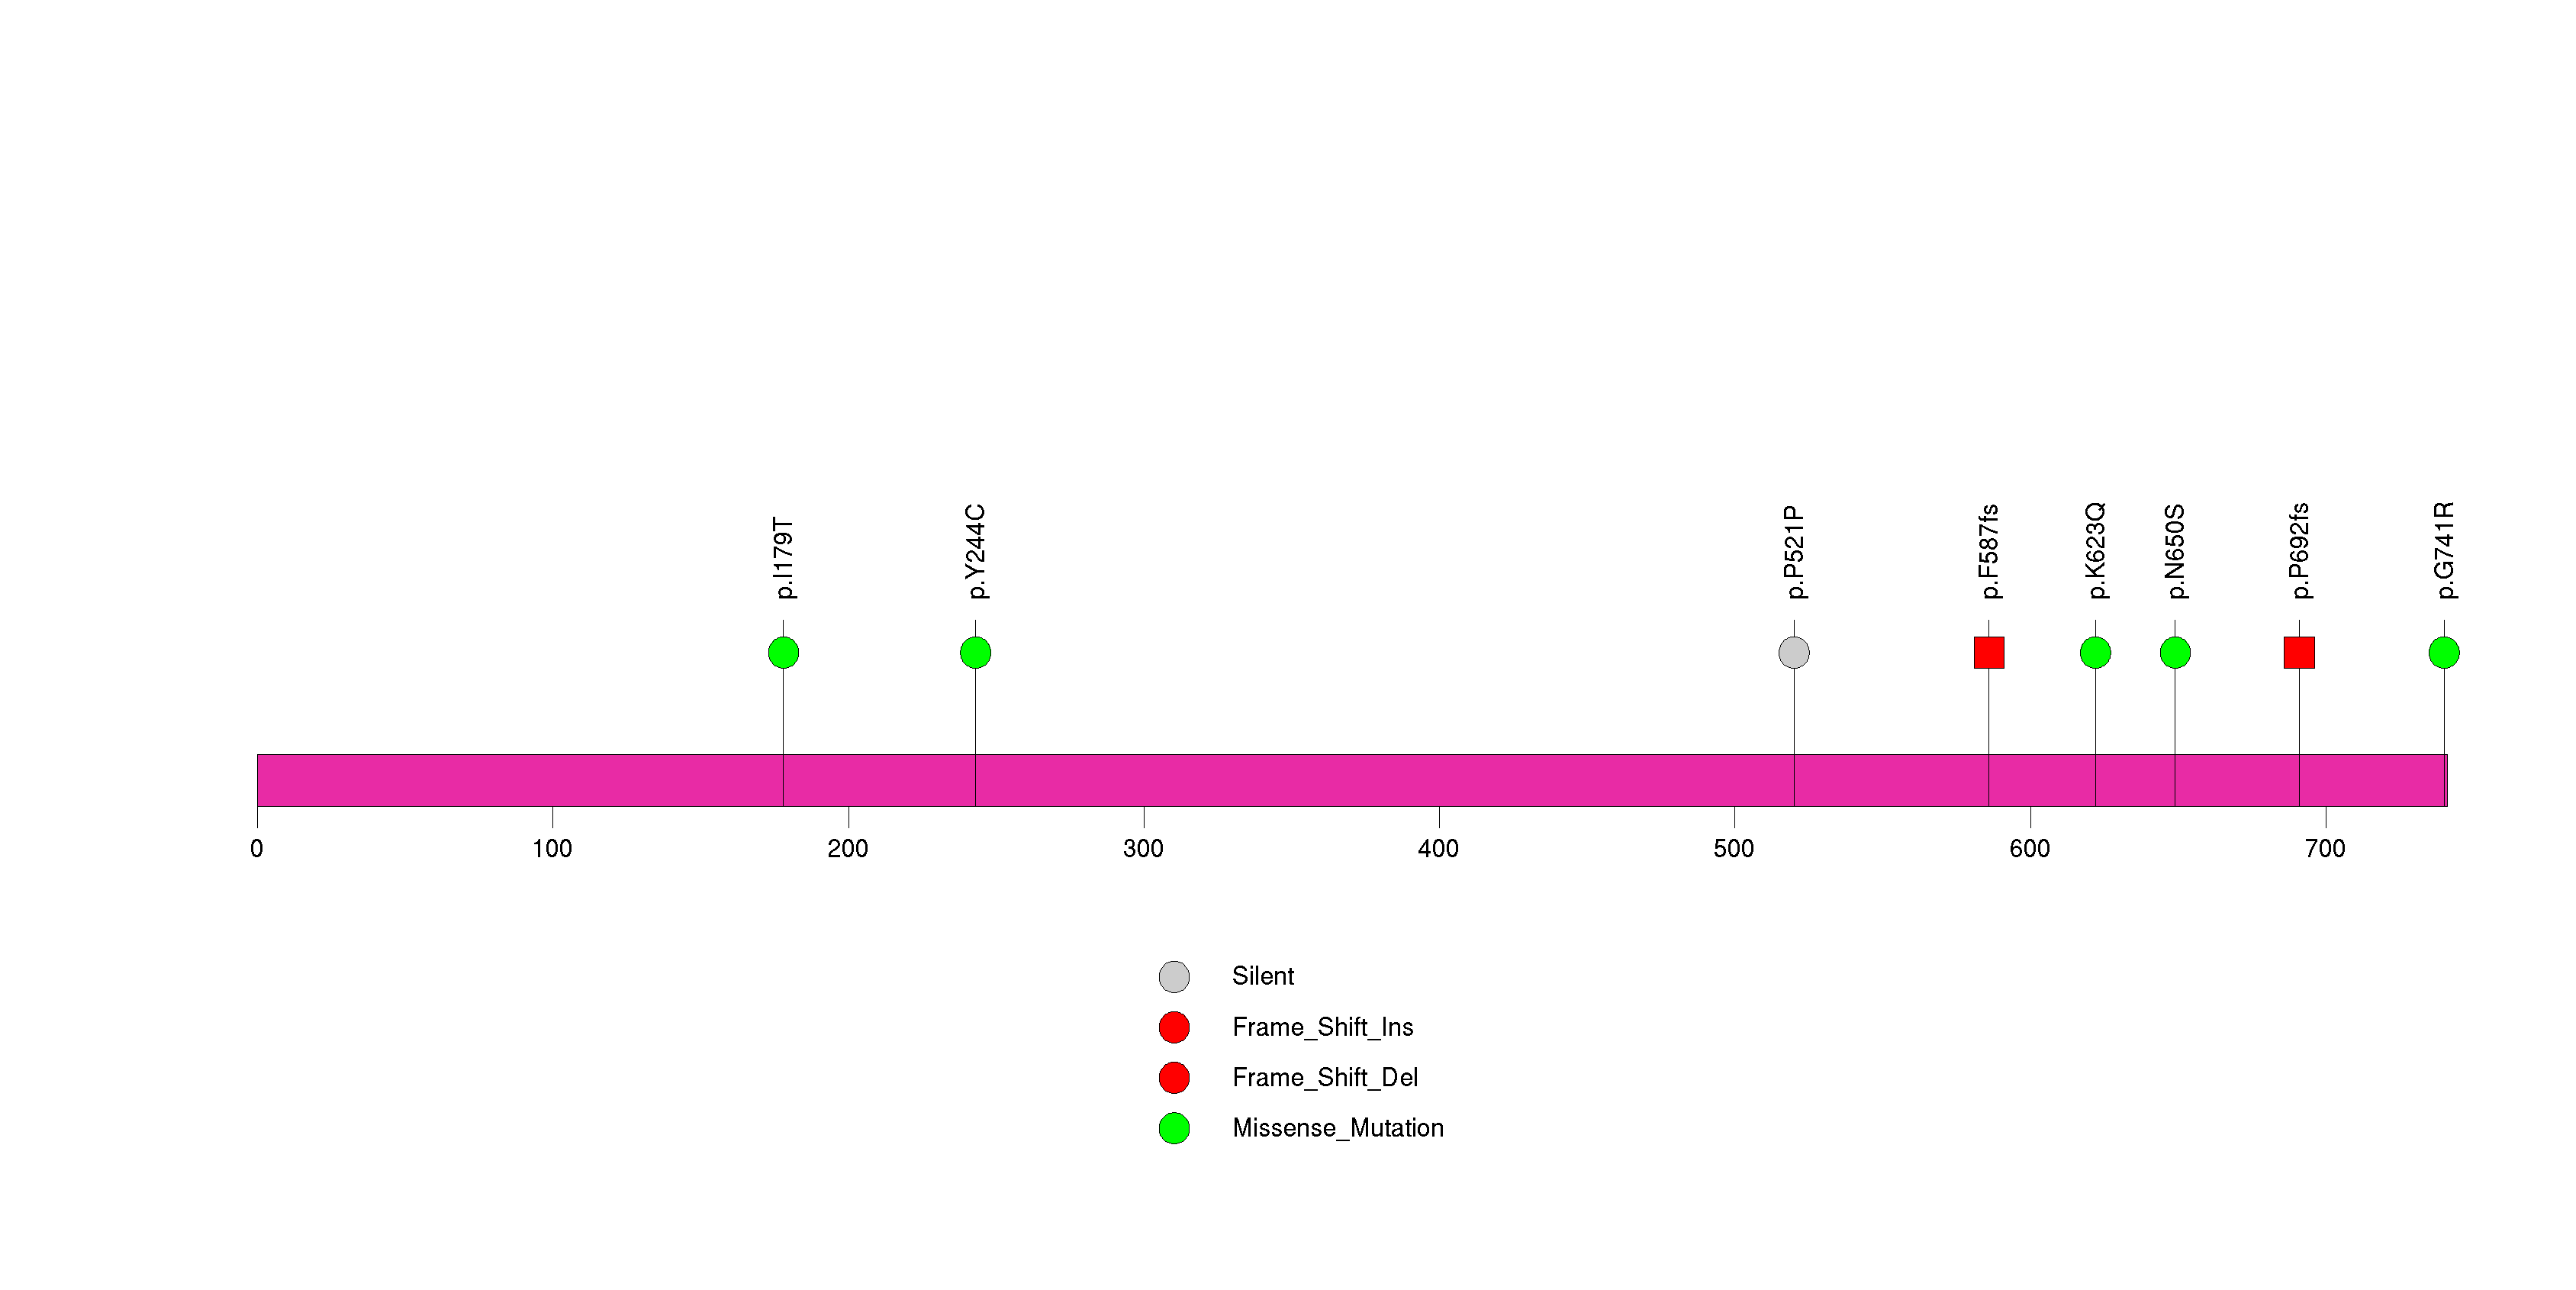
Figure S18. This figure depicts the distribution of mutations and mutation types across the MUC7 significant gene.
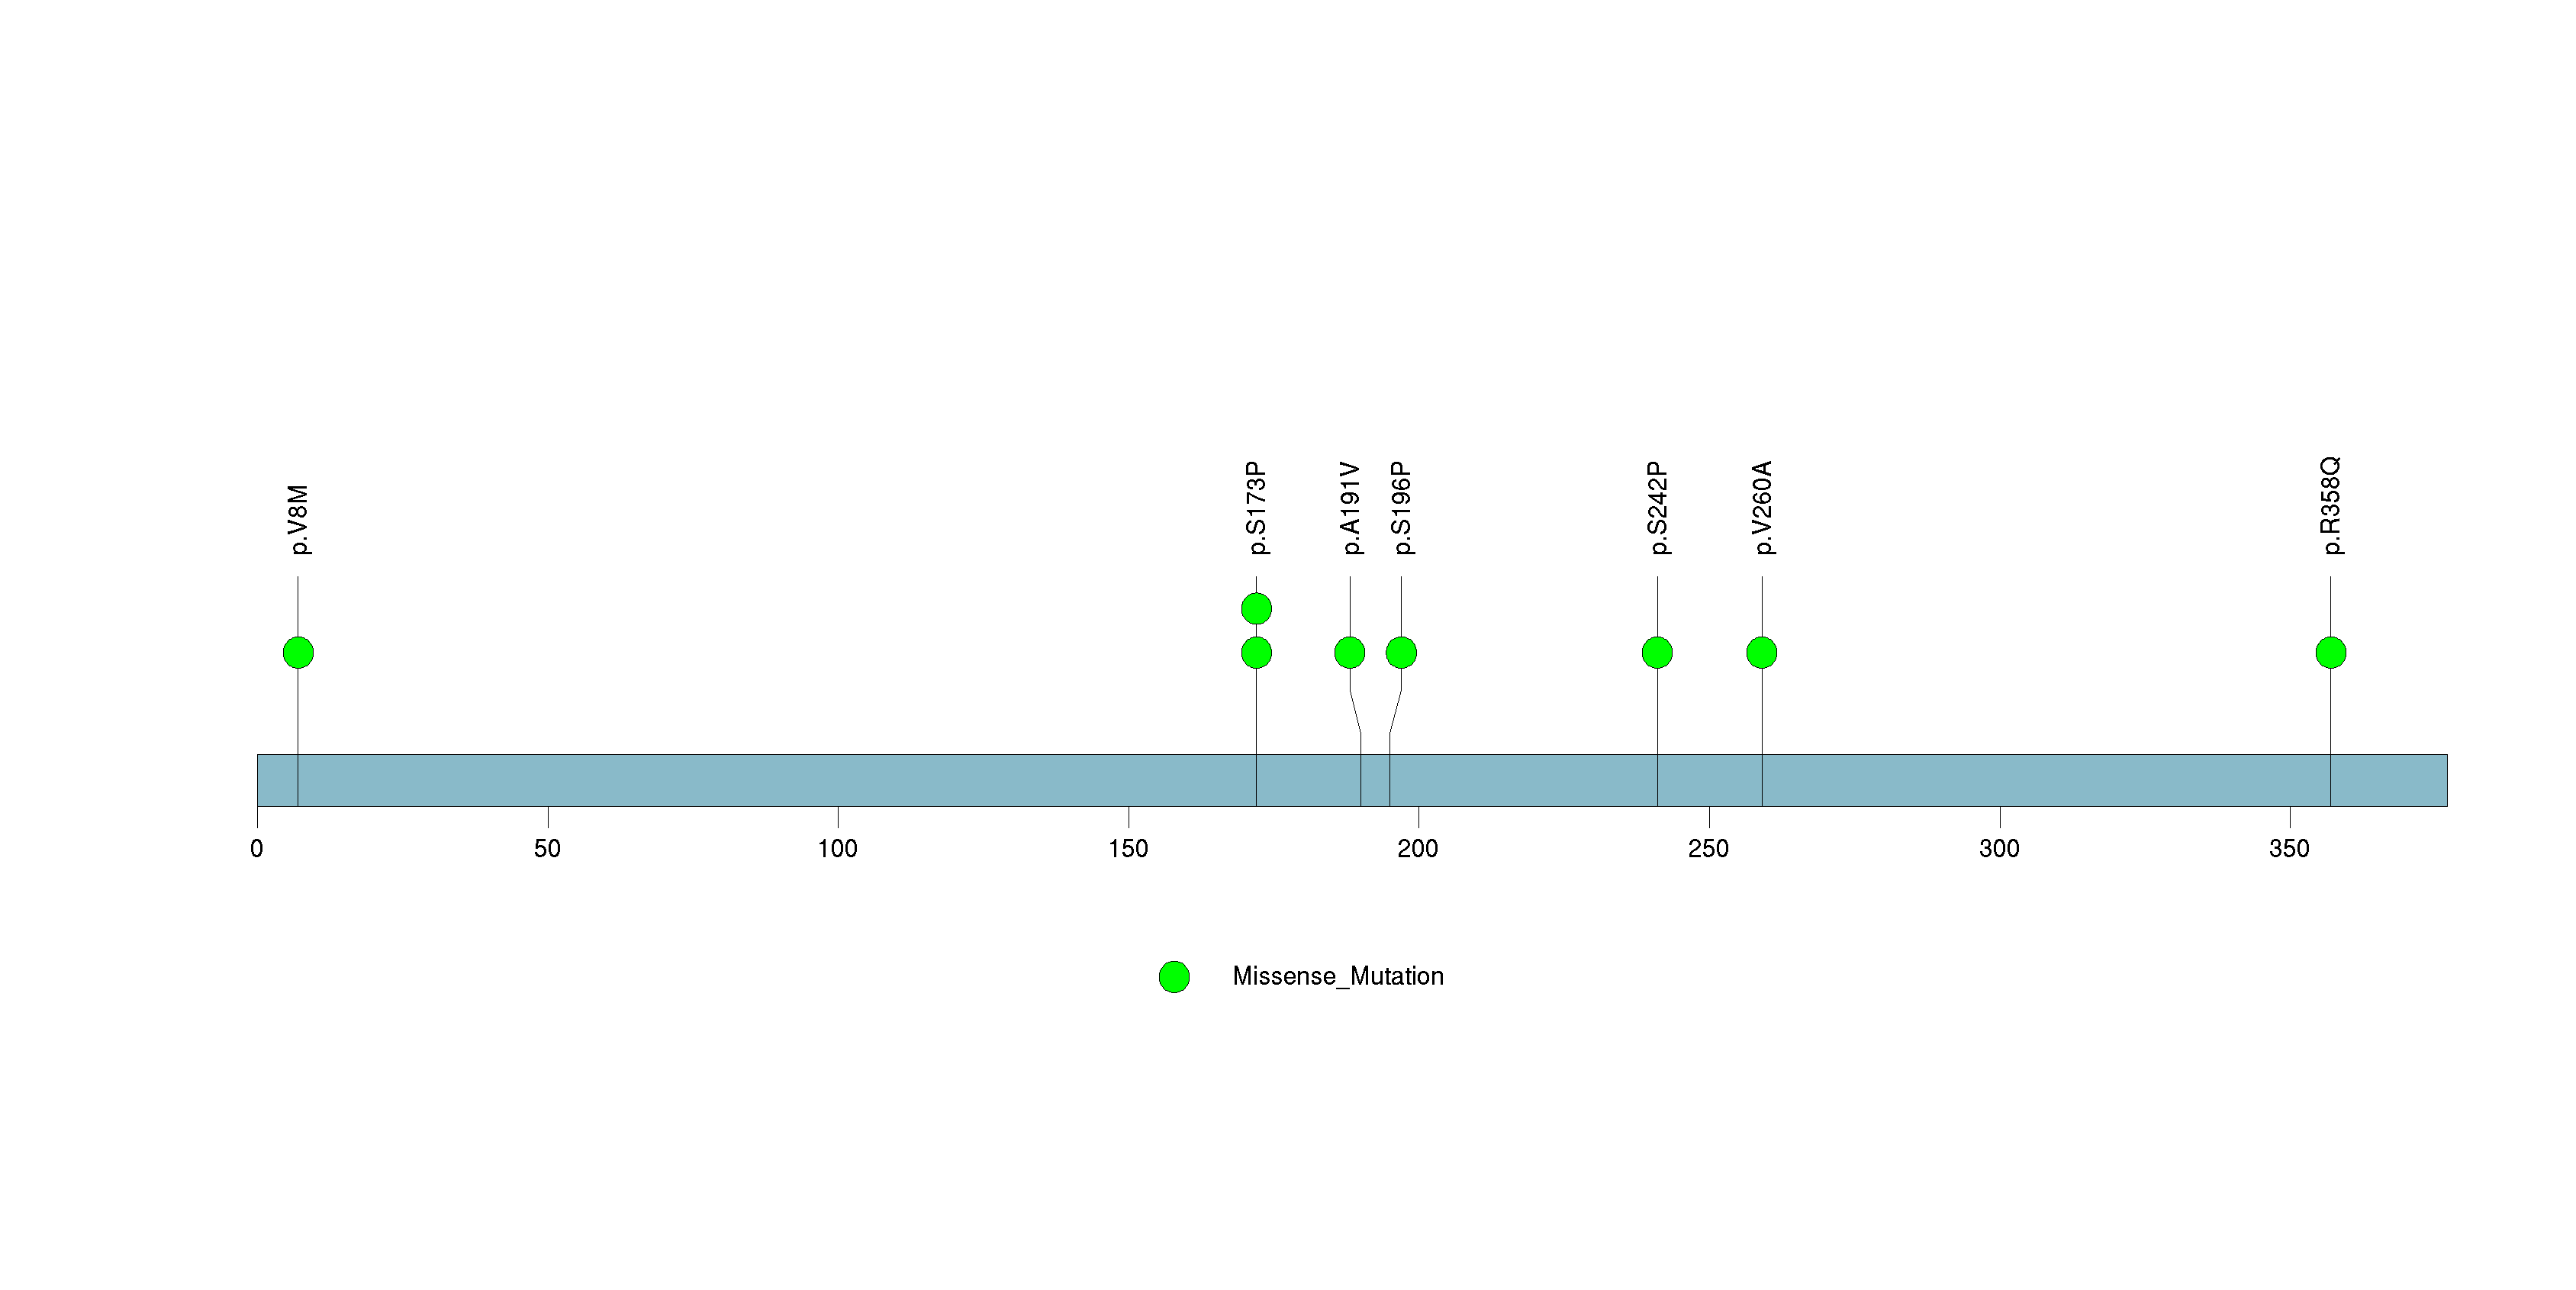
Figure S19. This figure depicts the distribution of mutations and mutation types across the ZNF57 significant gene.
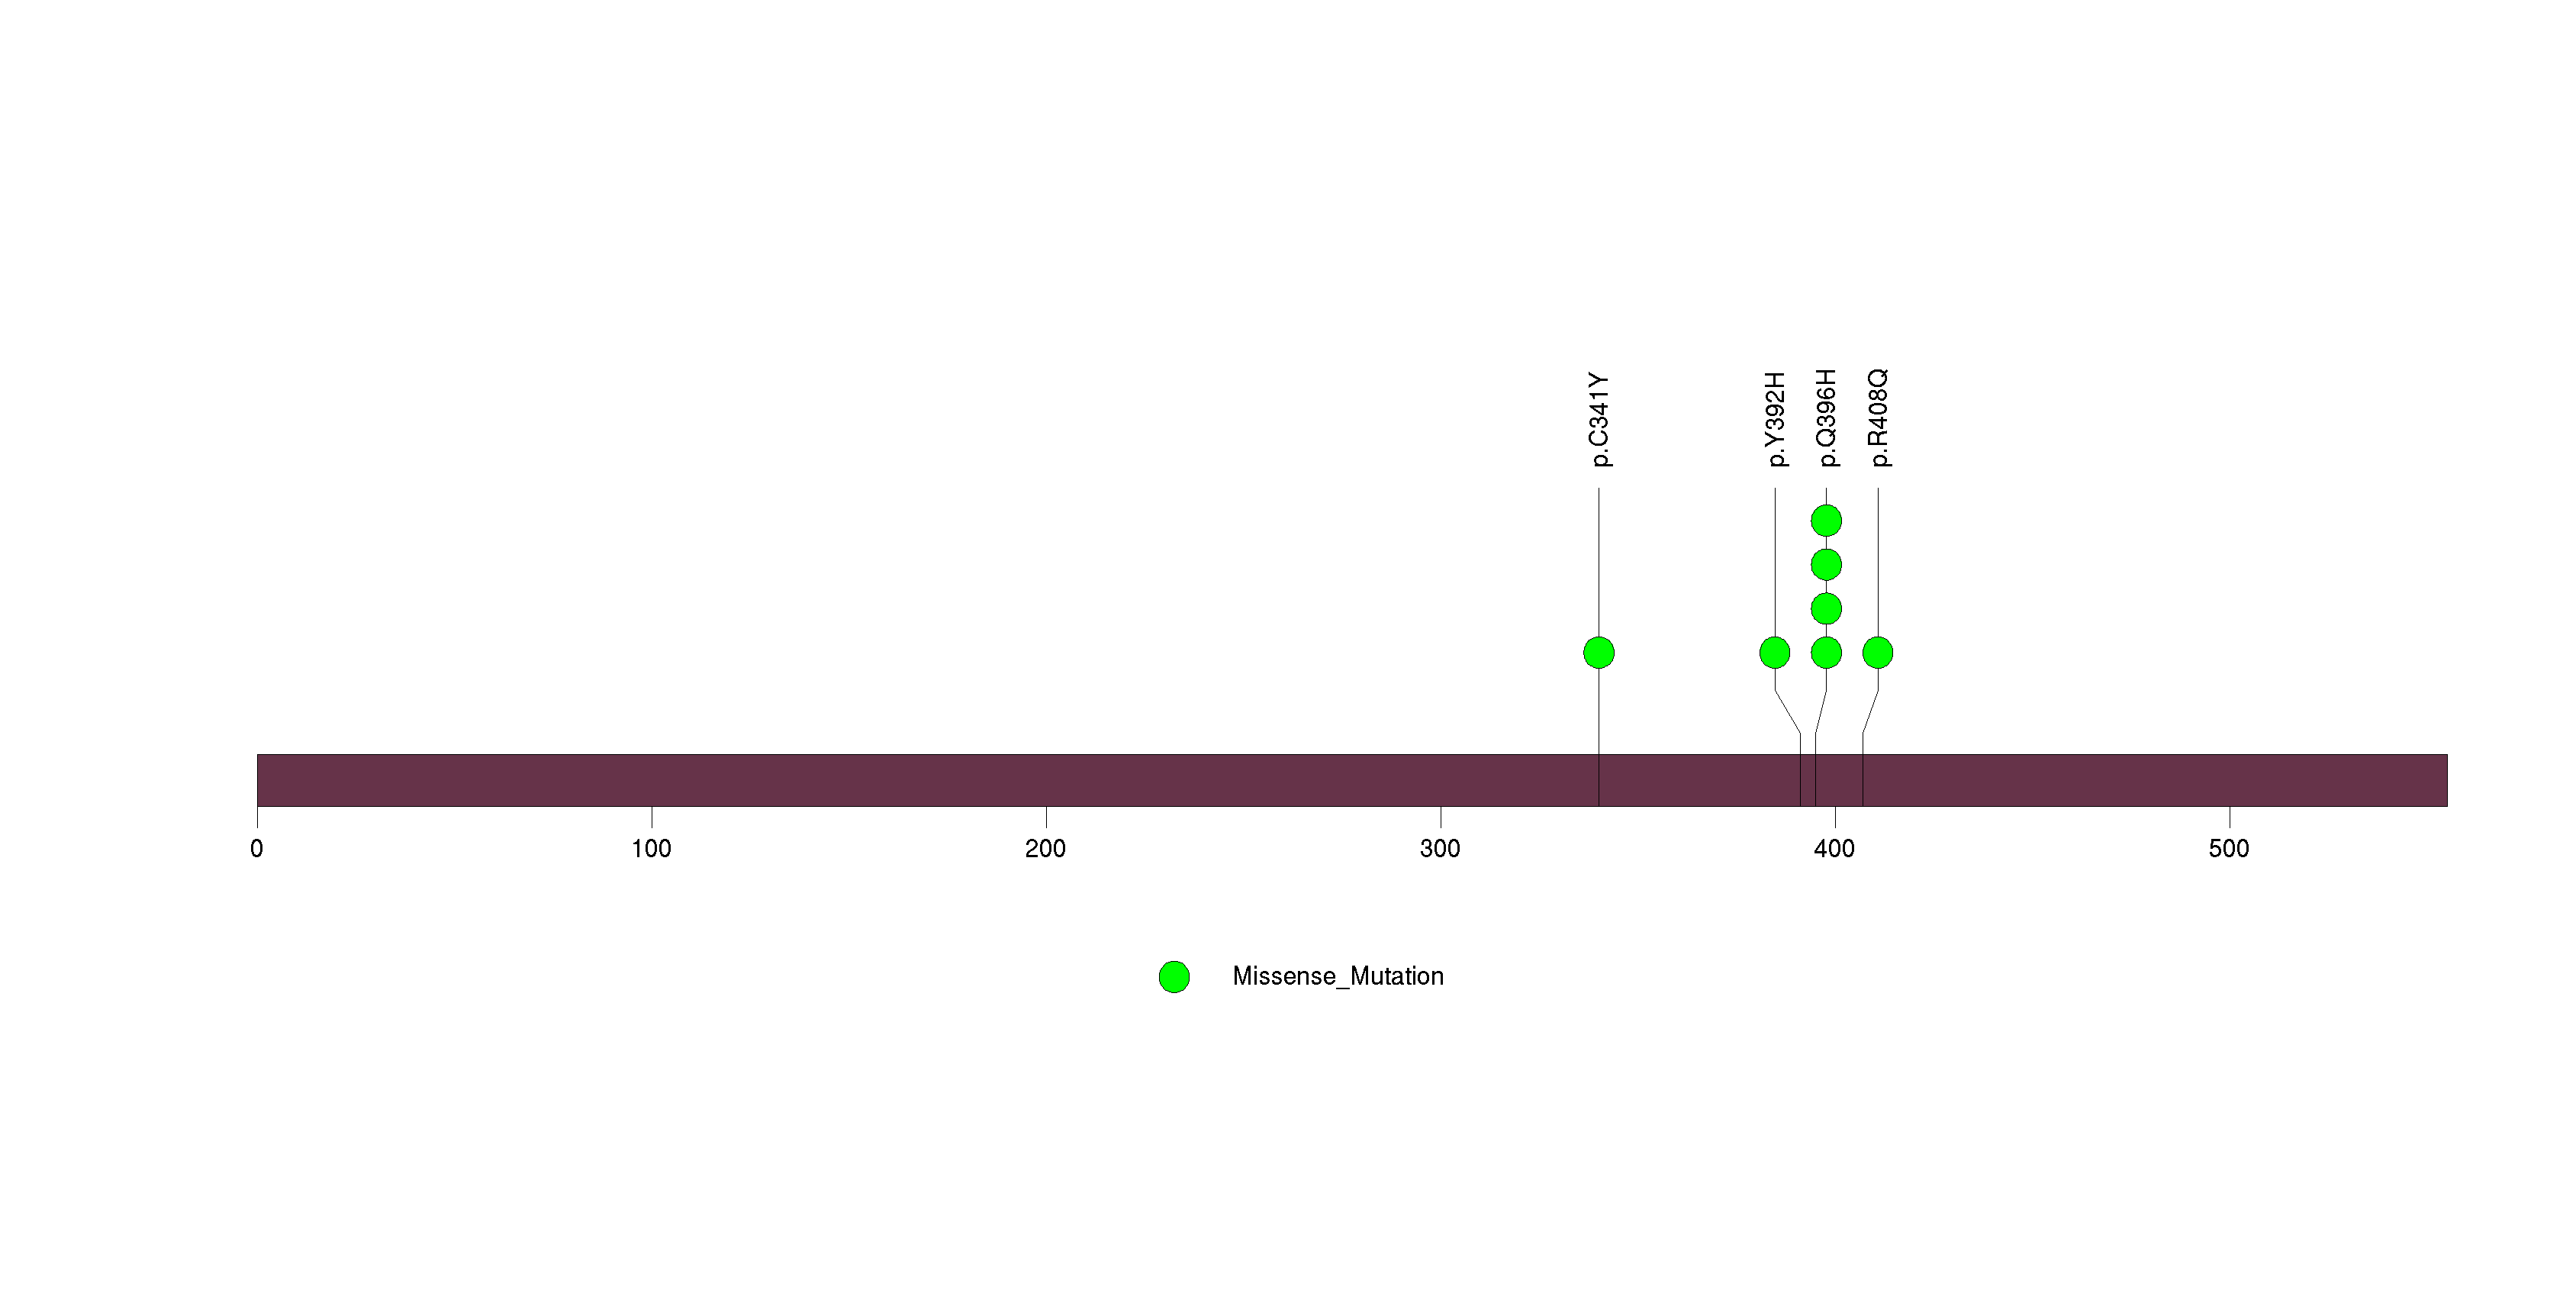
Figure S20. This figure depicts the distribution of mutations and mutation types across the EGFR significant gene.
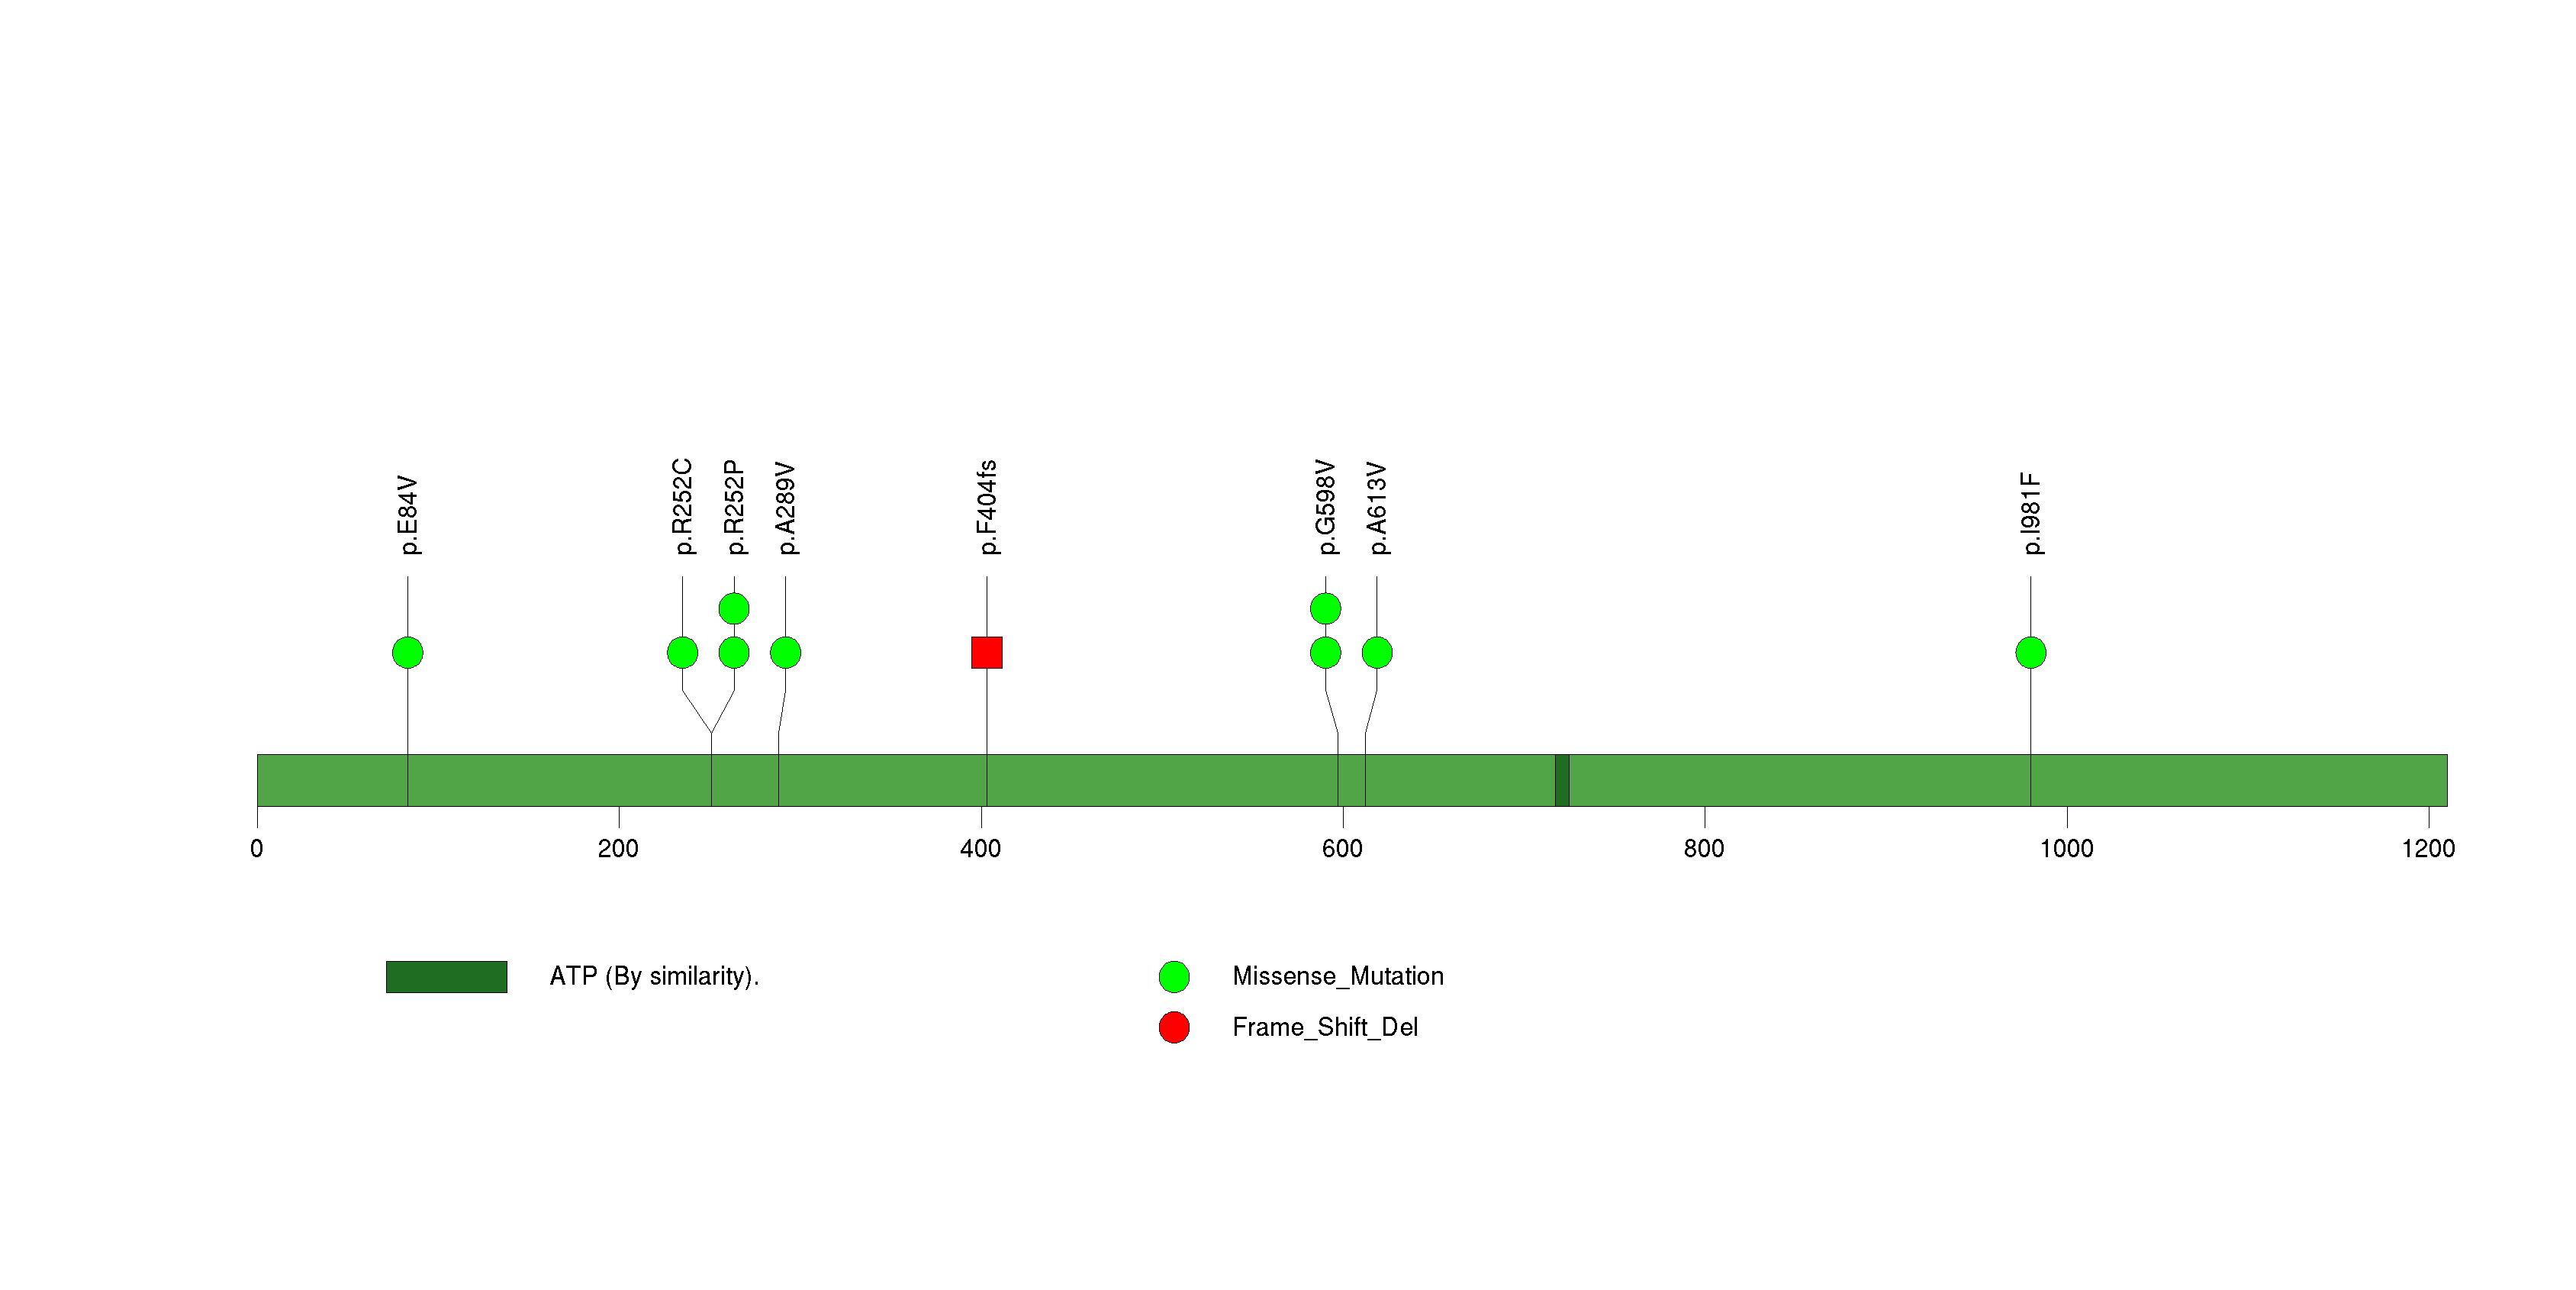
Figure S21. This figure depicts the distribution of mutations and mutation types across the PRAMEF11 significant gene.
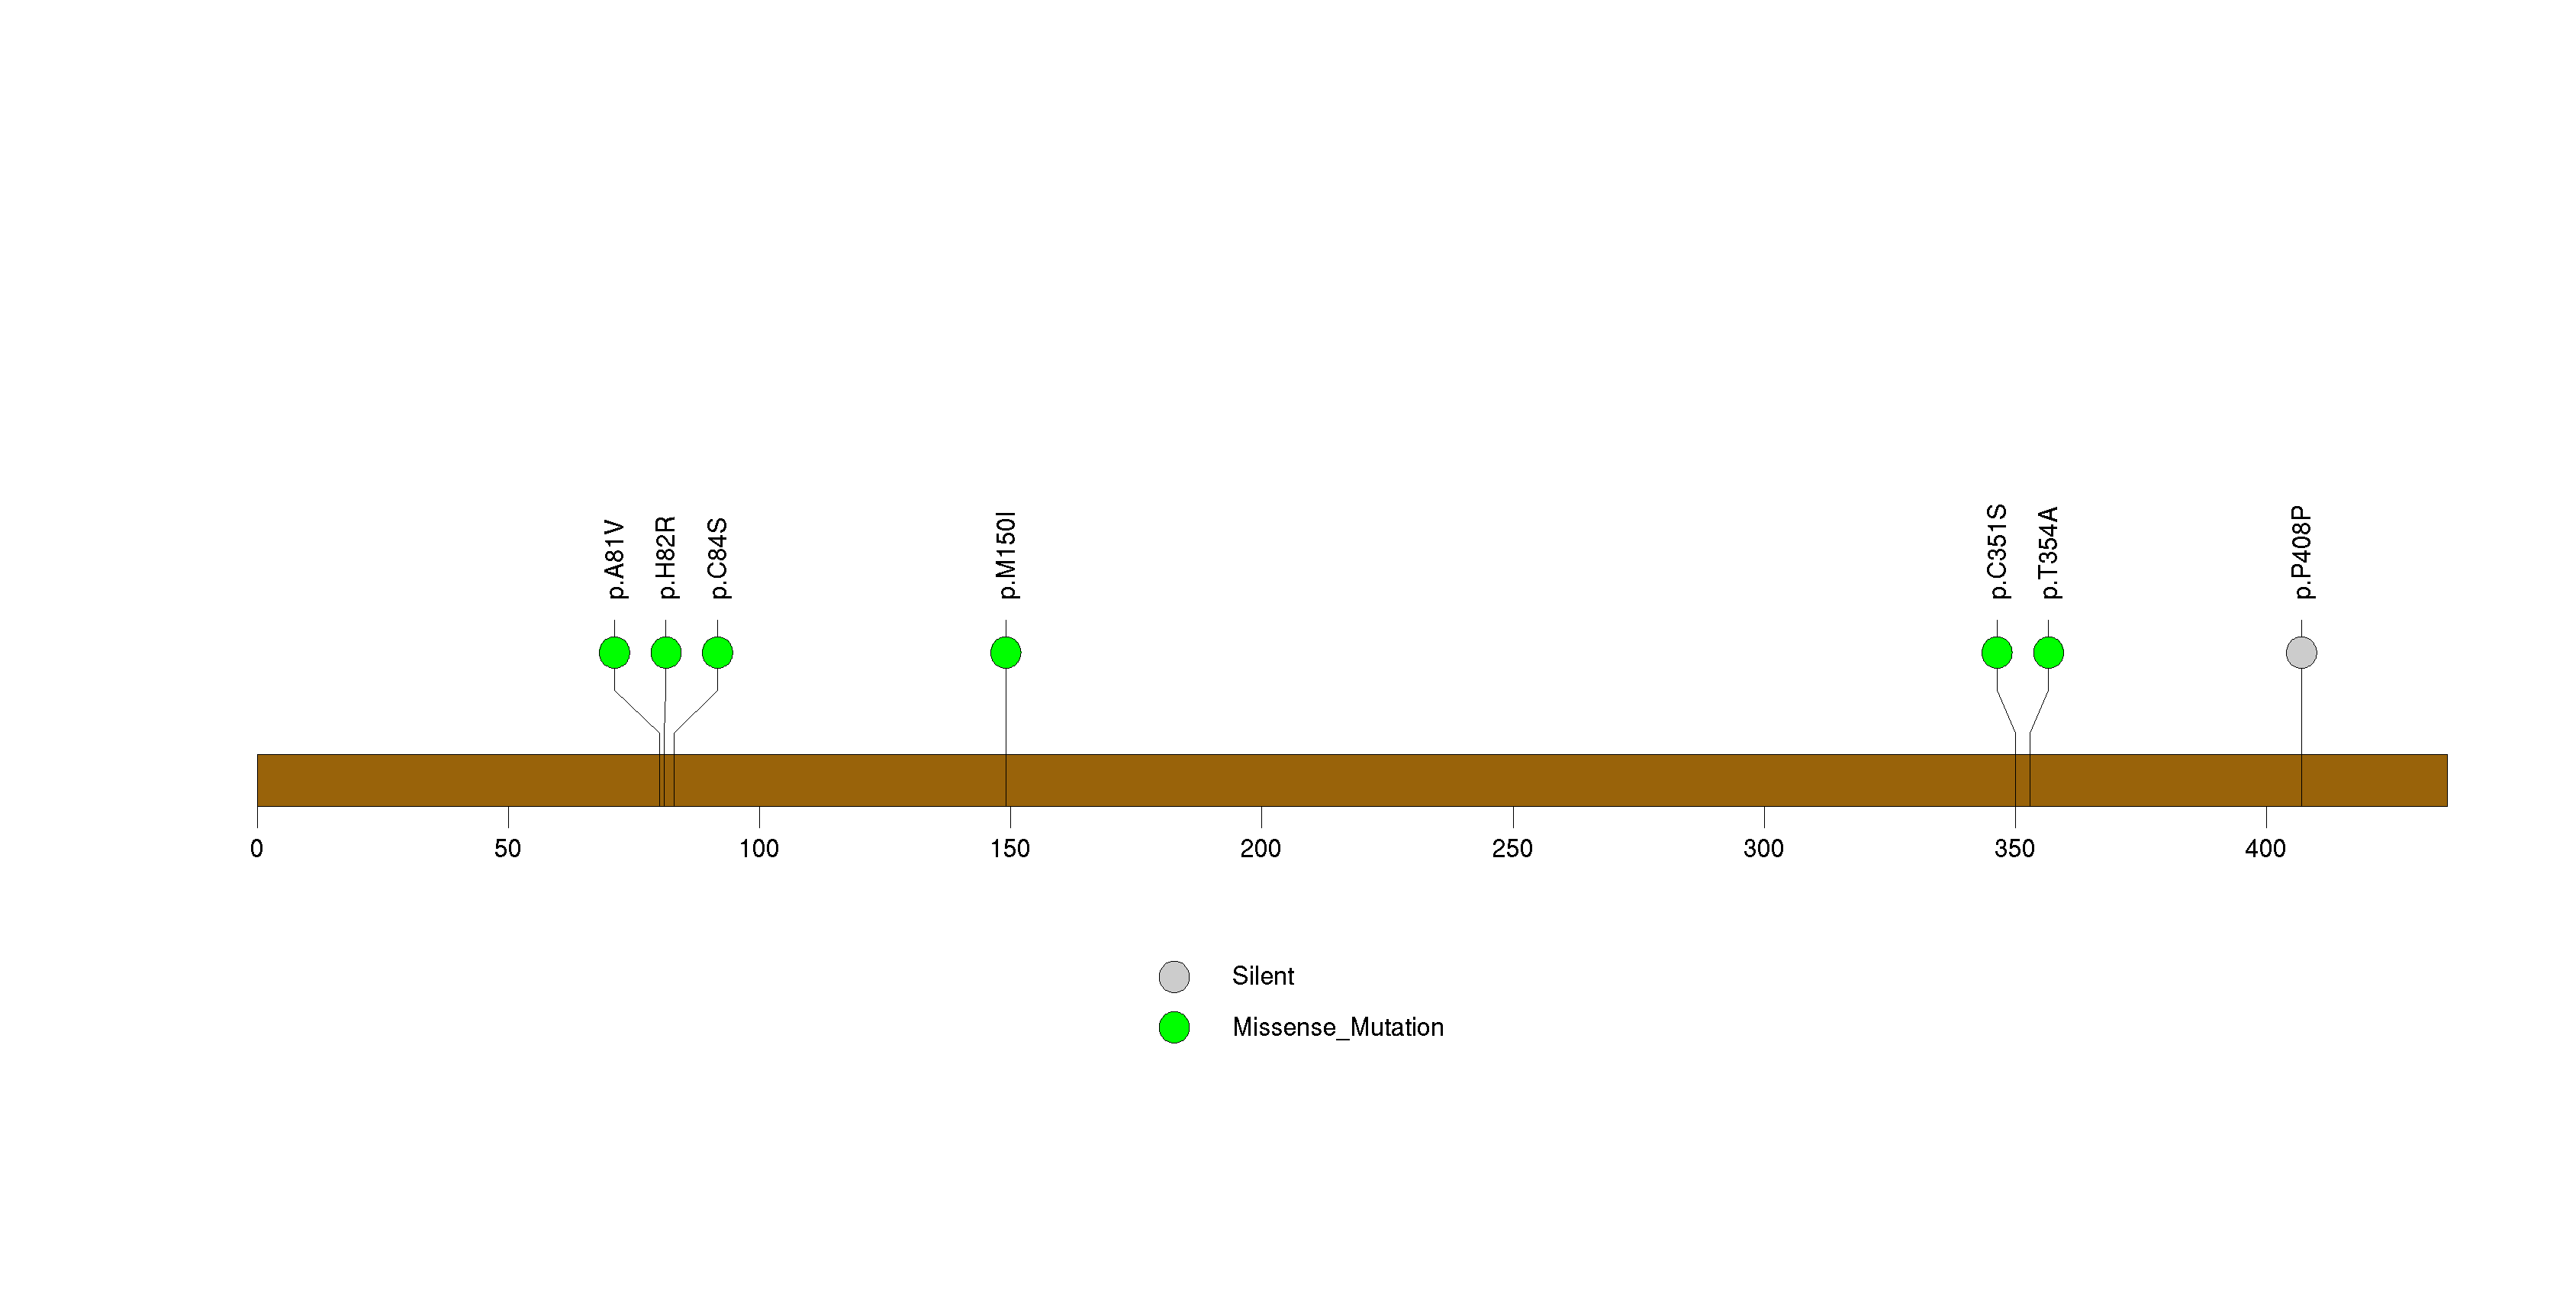
Figure S22. This figure depicts the distribution of mutations and mutation types across the ANKRD30A significant gene.
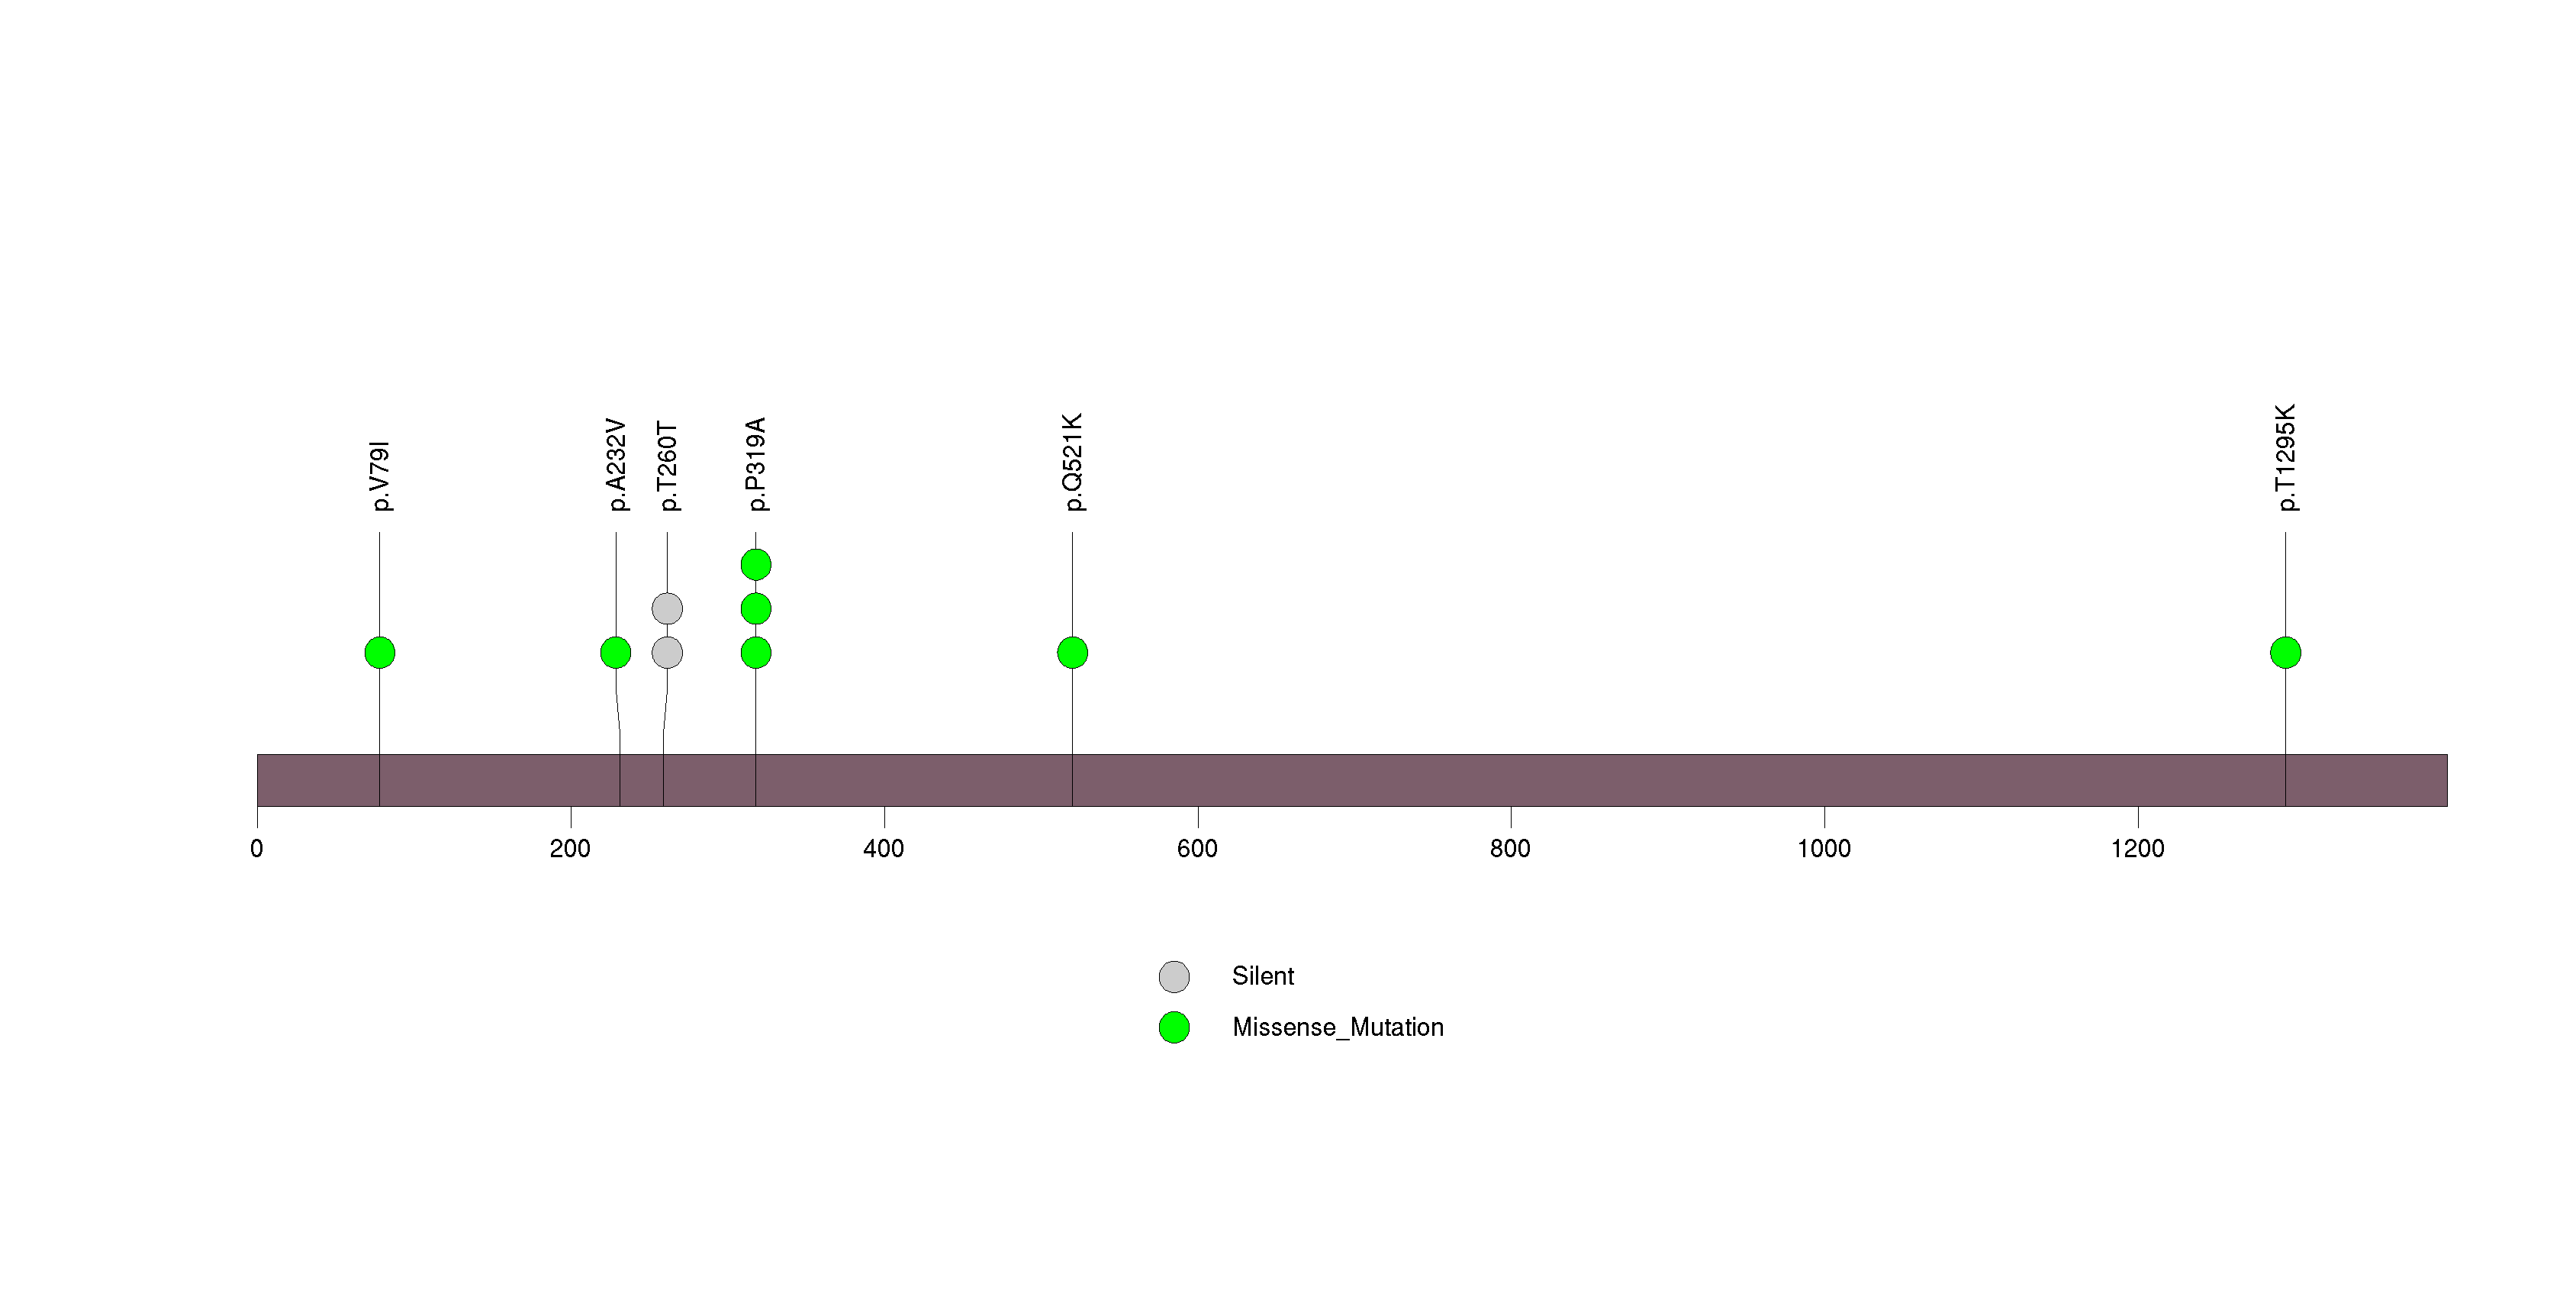
Figure S23. This figure depicts the distribution of mutations and mutation types across the ZNF91 significant gene.
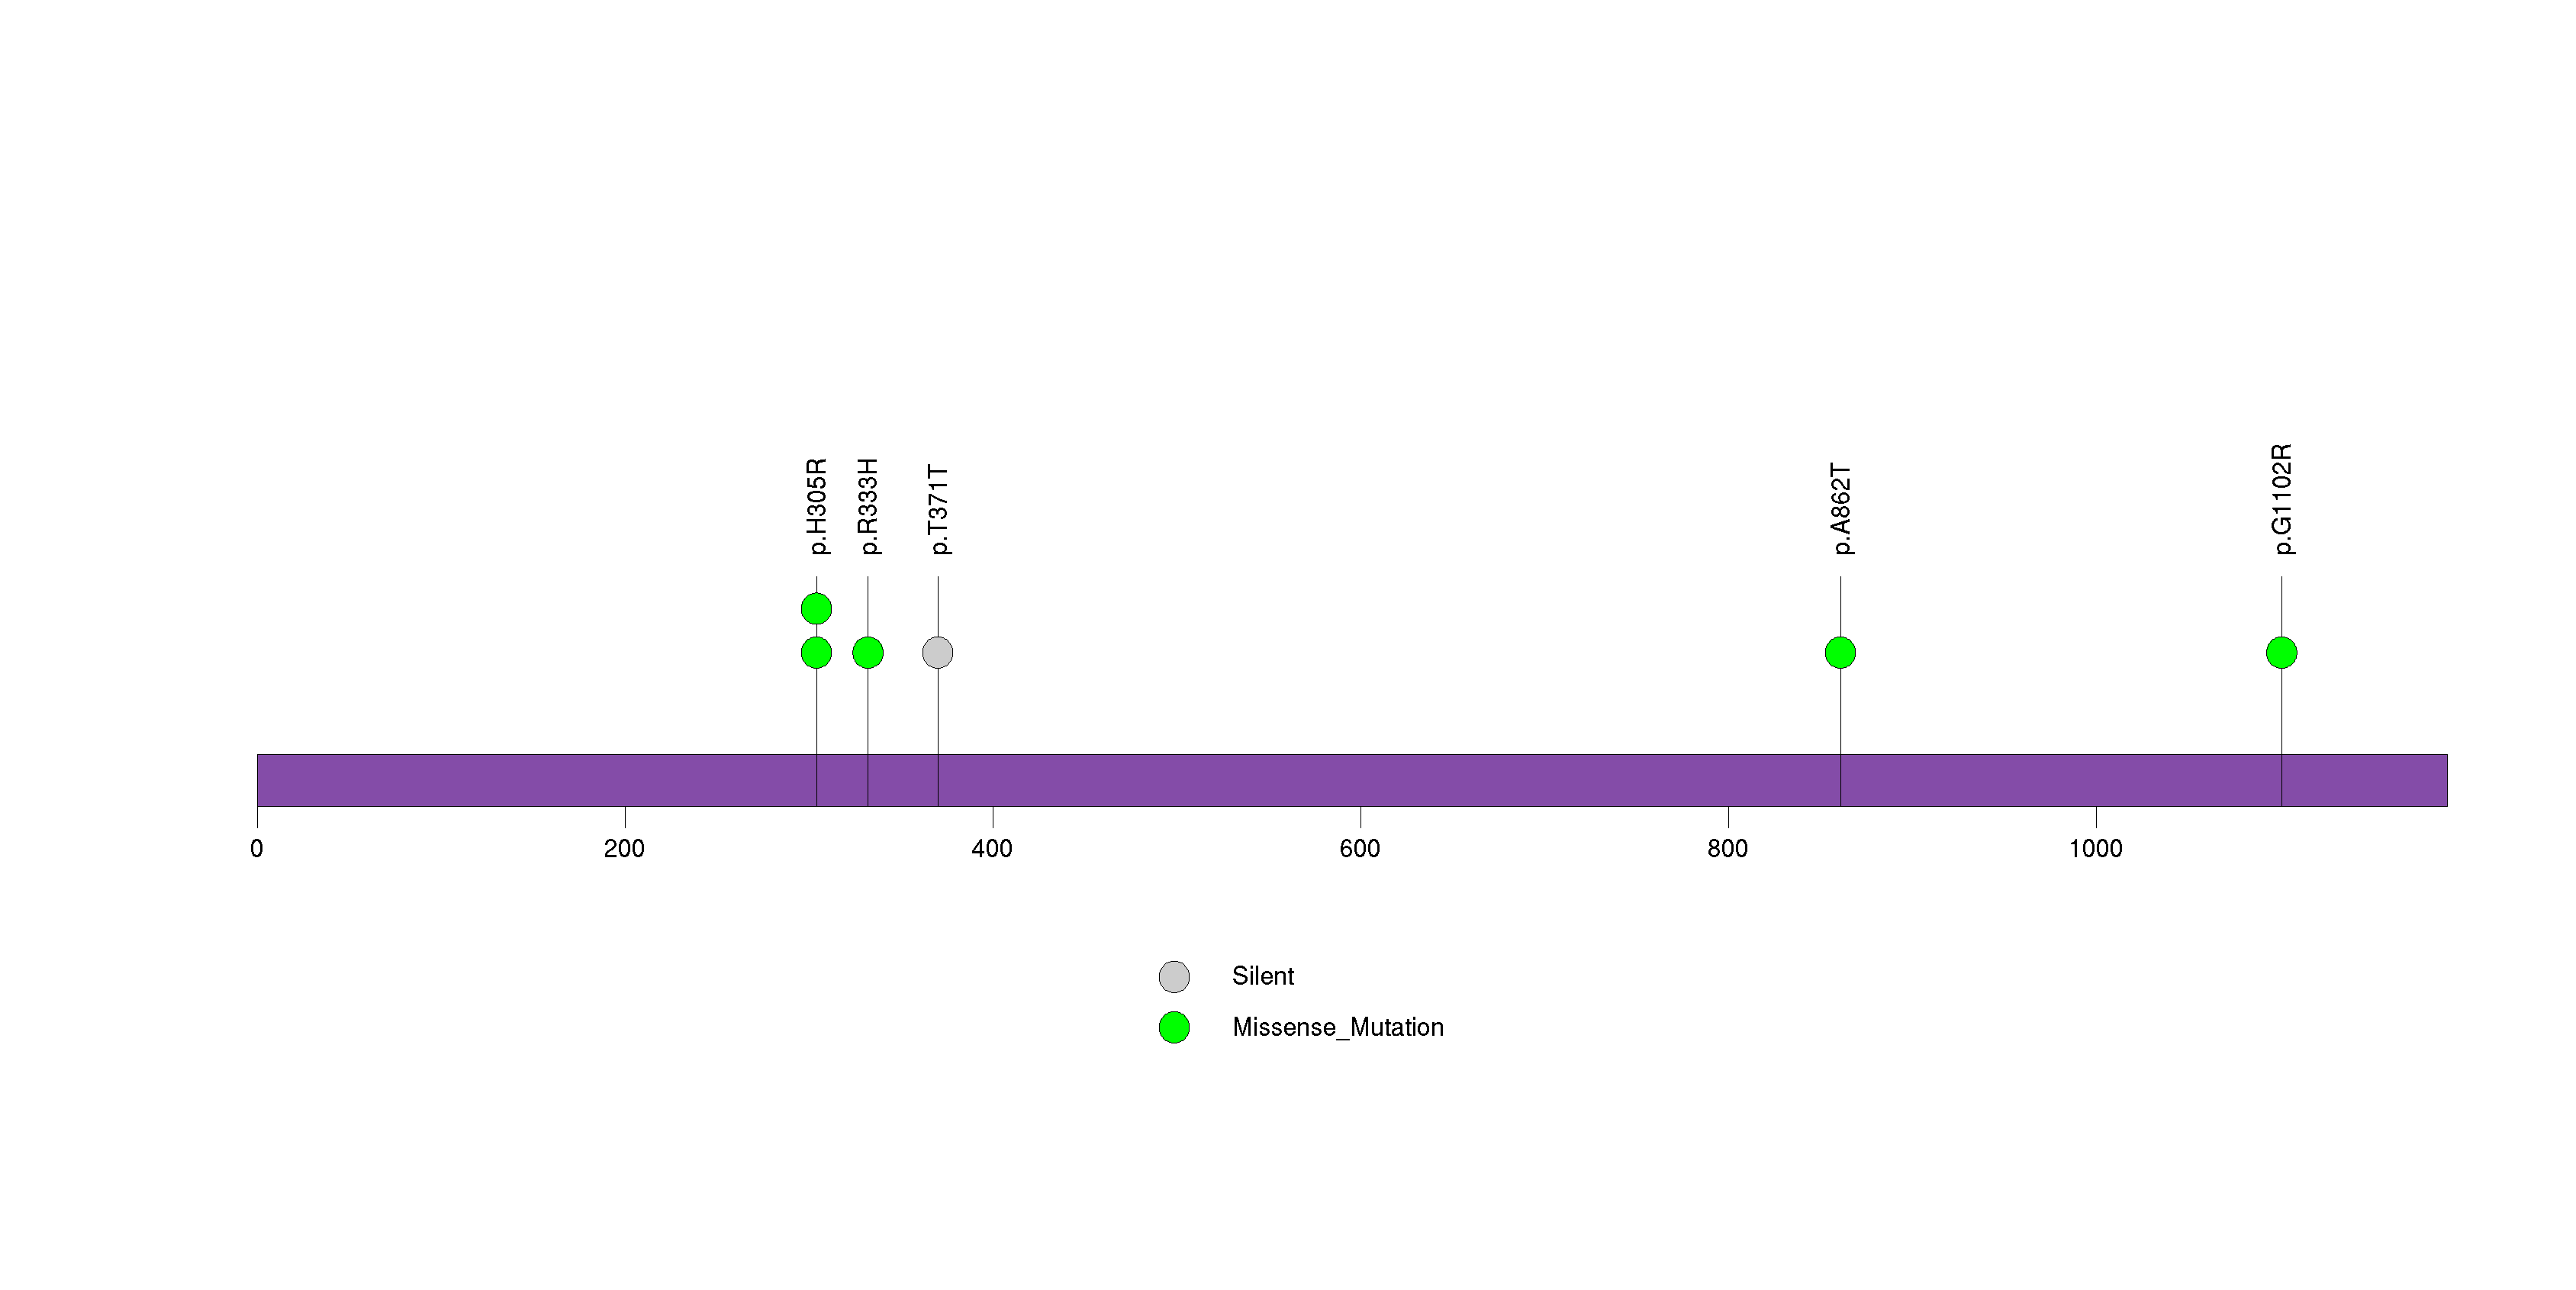
Figure S24. This figure depicts the distribution of mutations and mutation types across the ZNF845 significant gene.
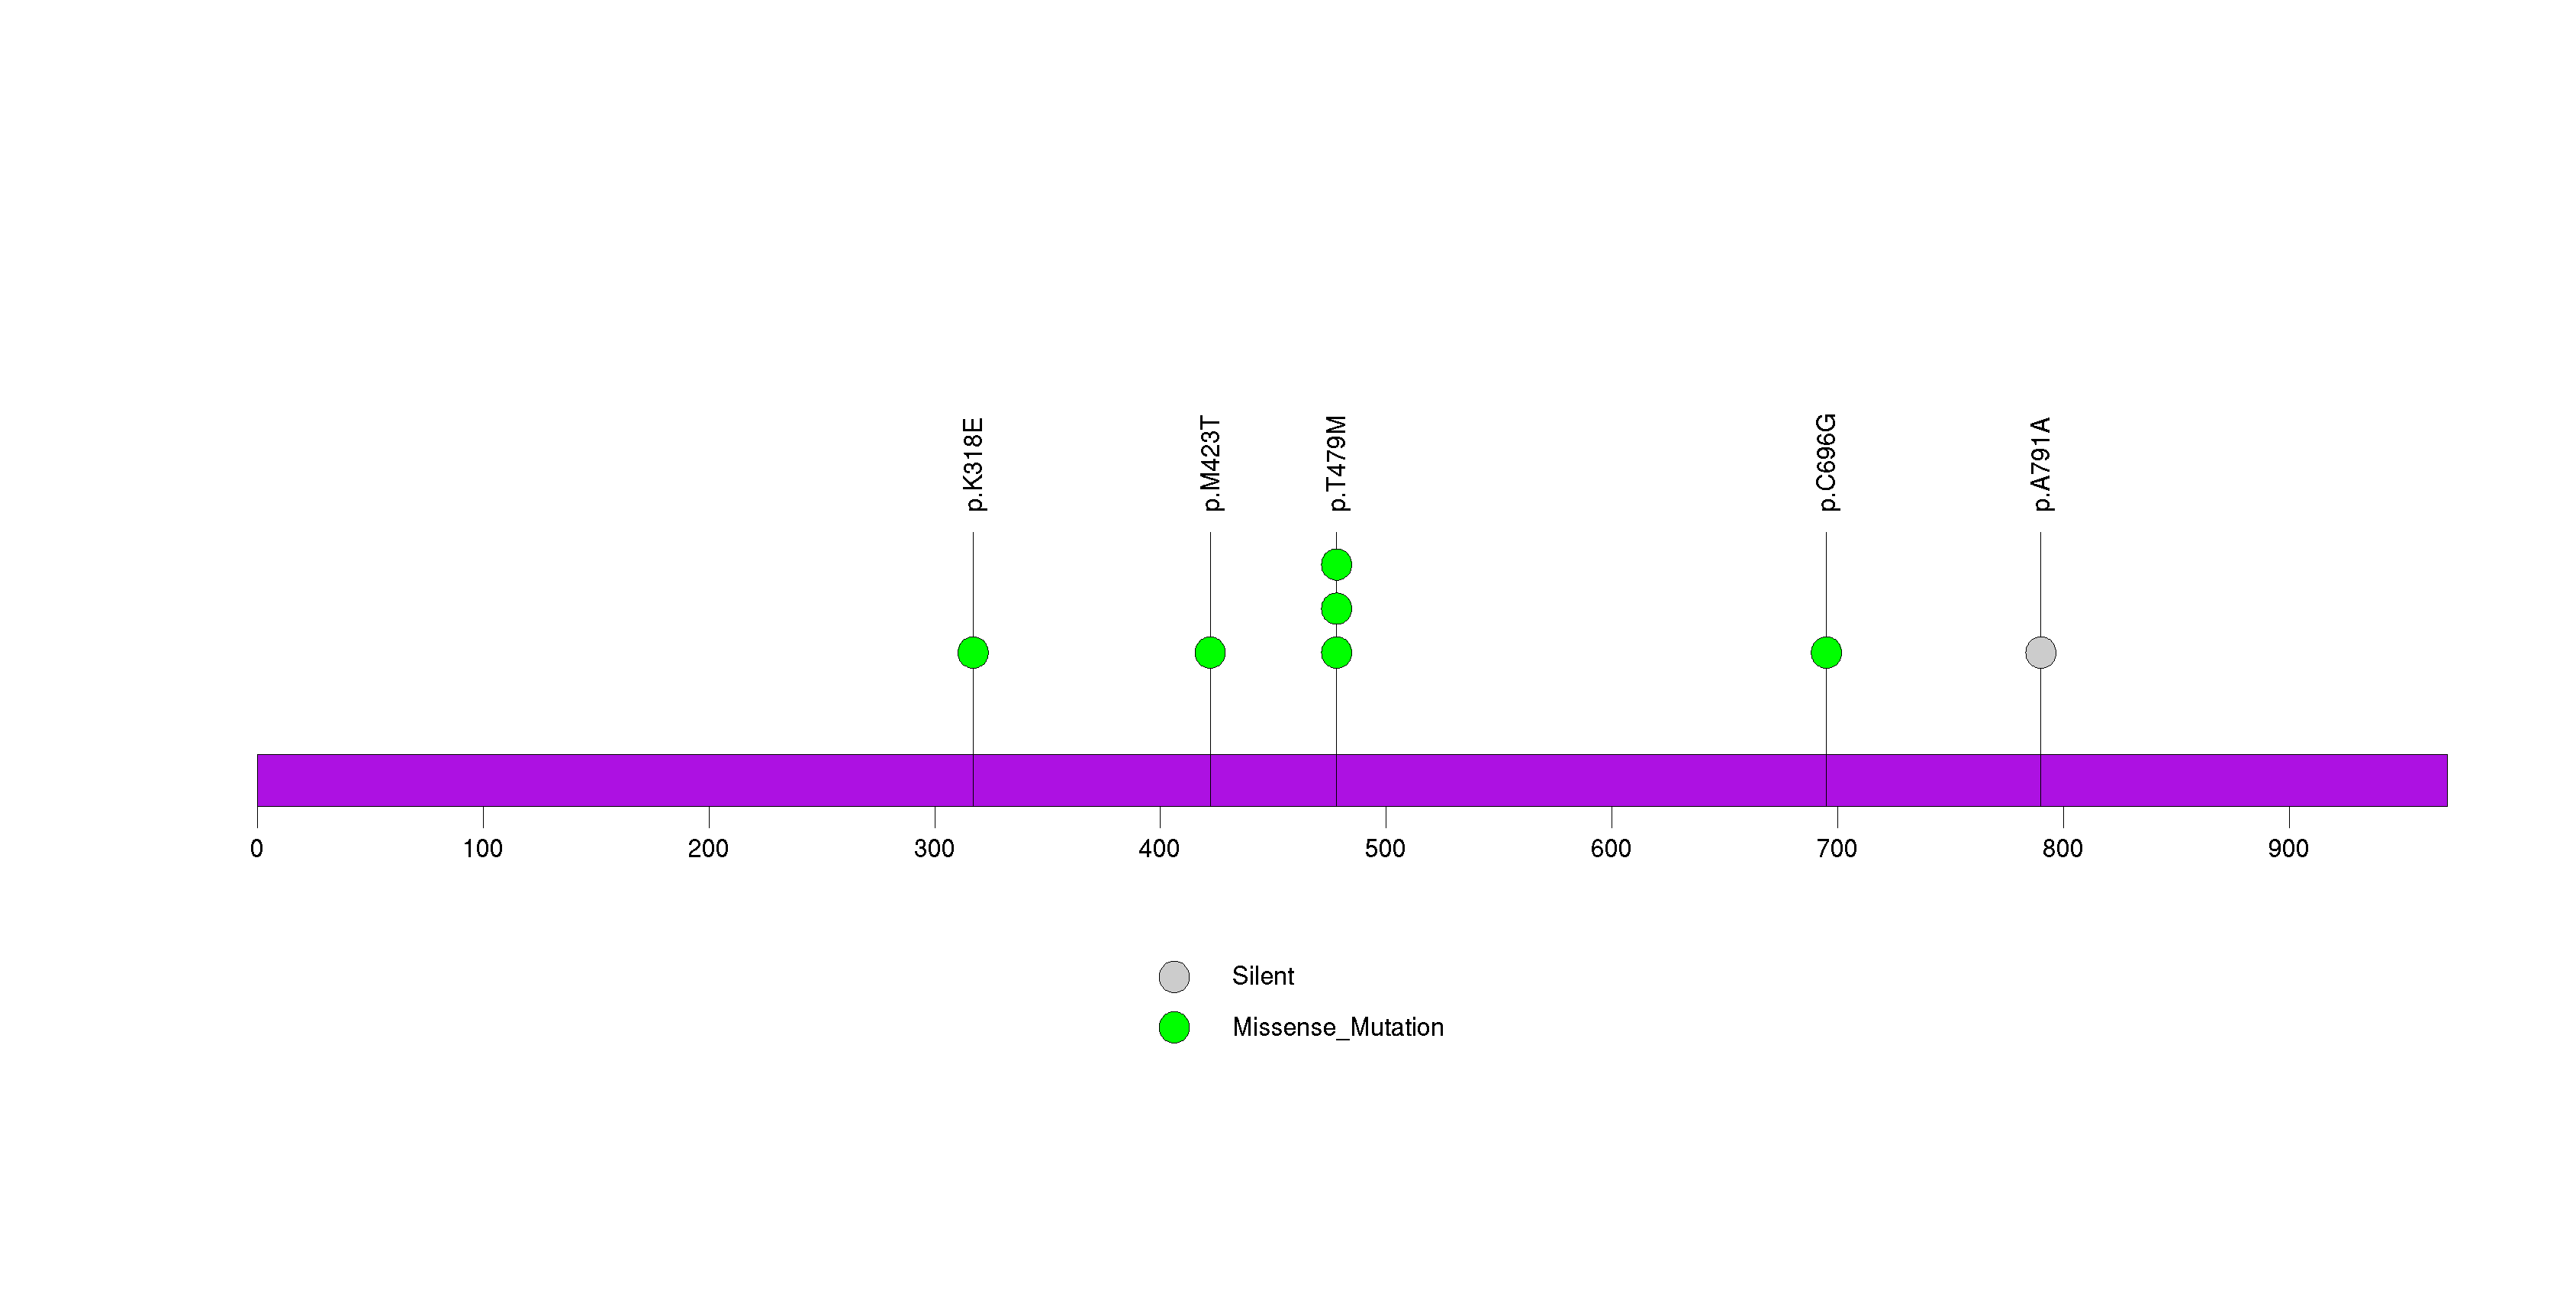
Figure S25. This figure depicts the distribution of mutations and mutation types across the SPDYE5 significant gene.
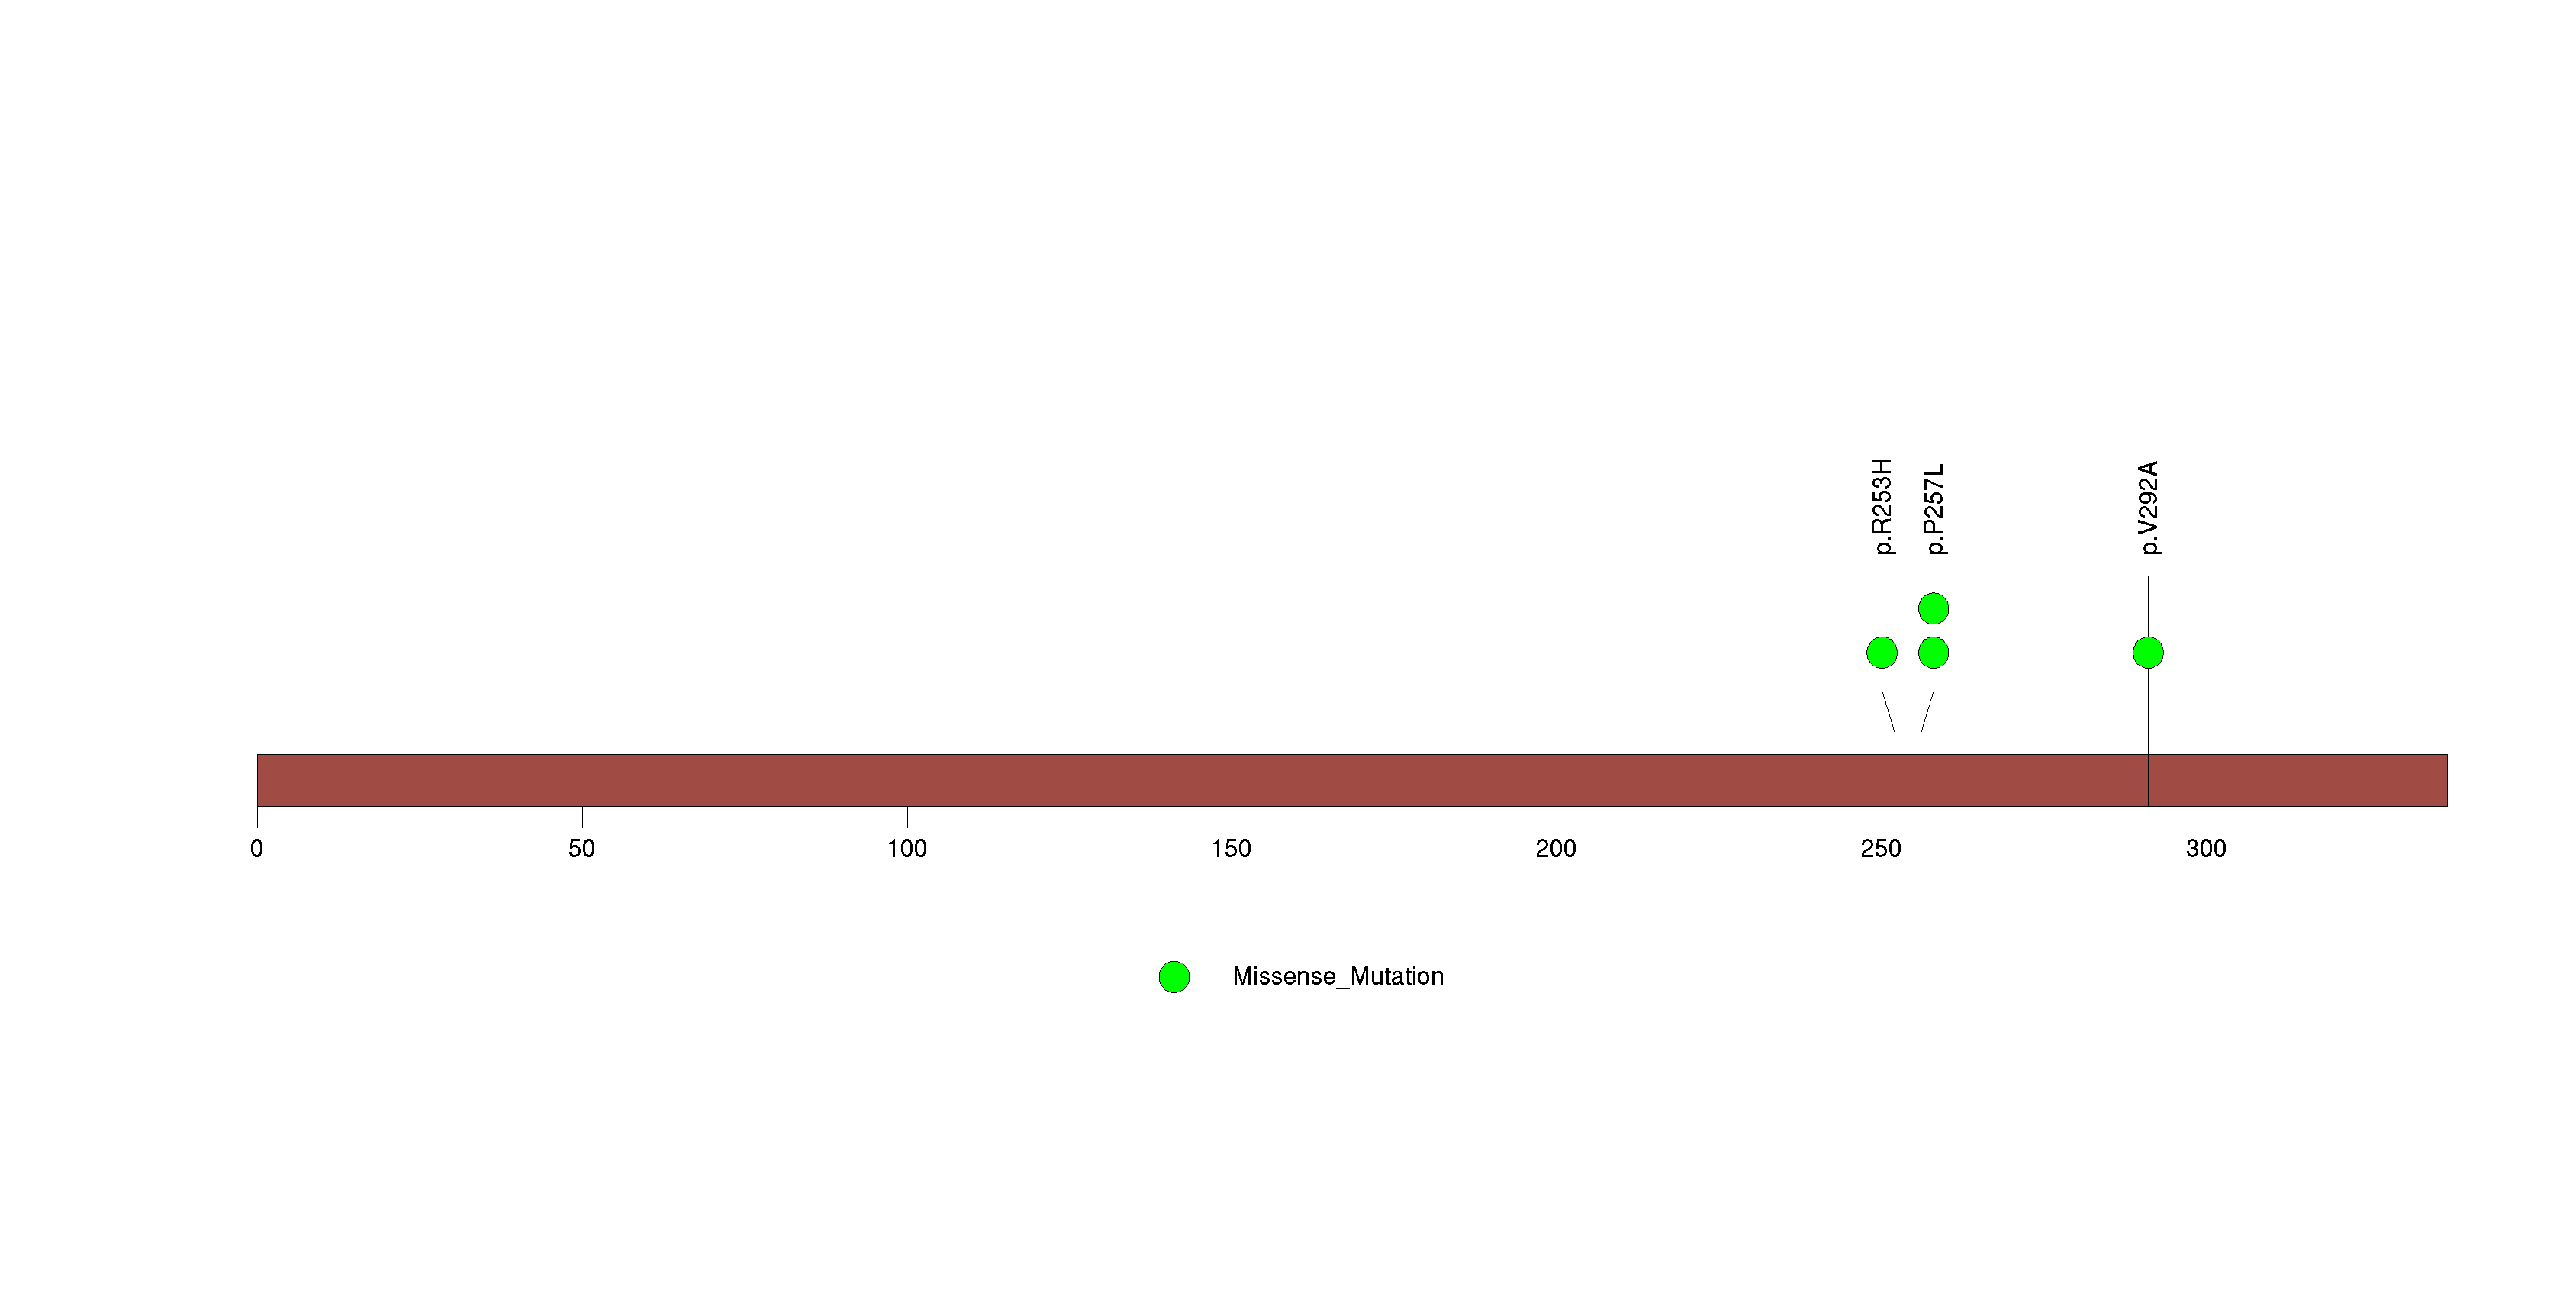
Figure S26. This figure depicts the distribution of mutations and mutation types across the TPTE significant gene.
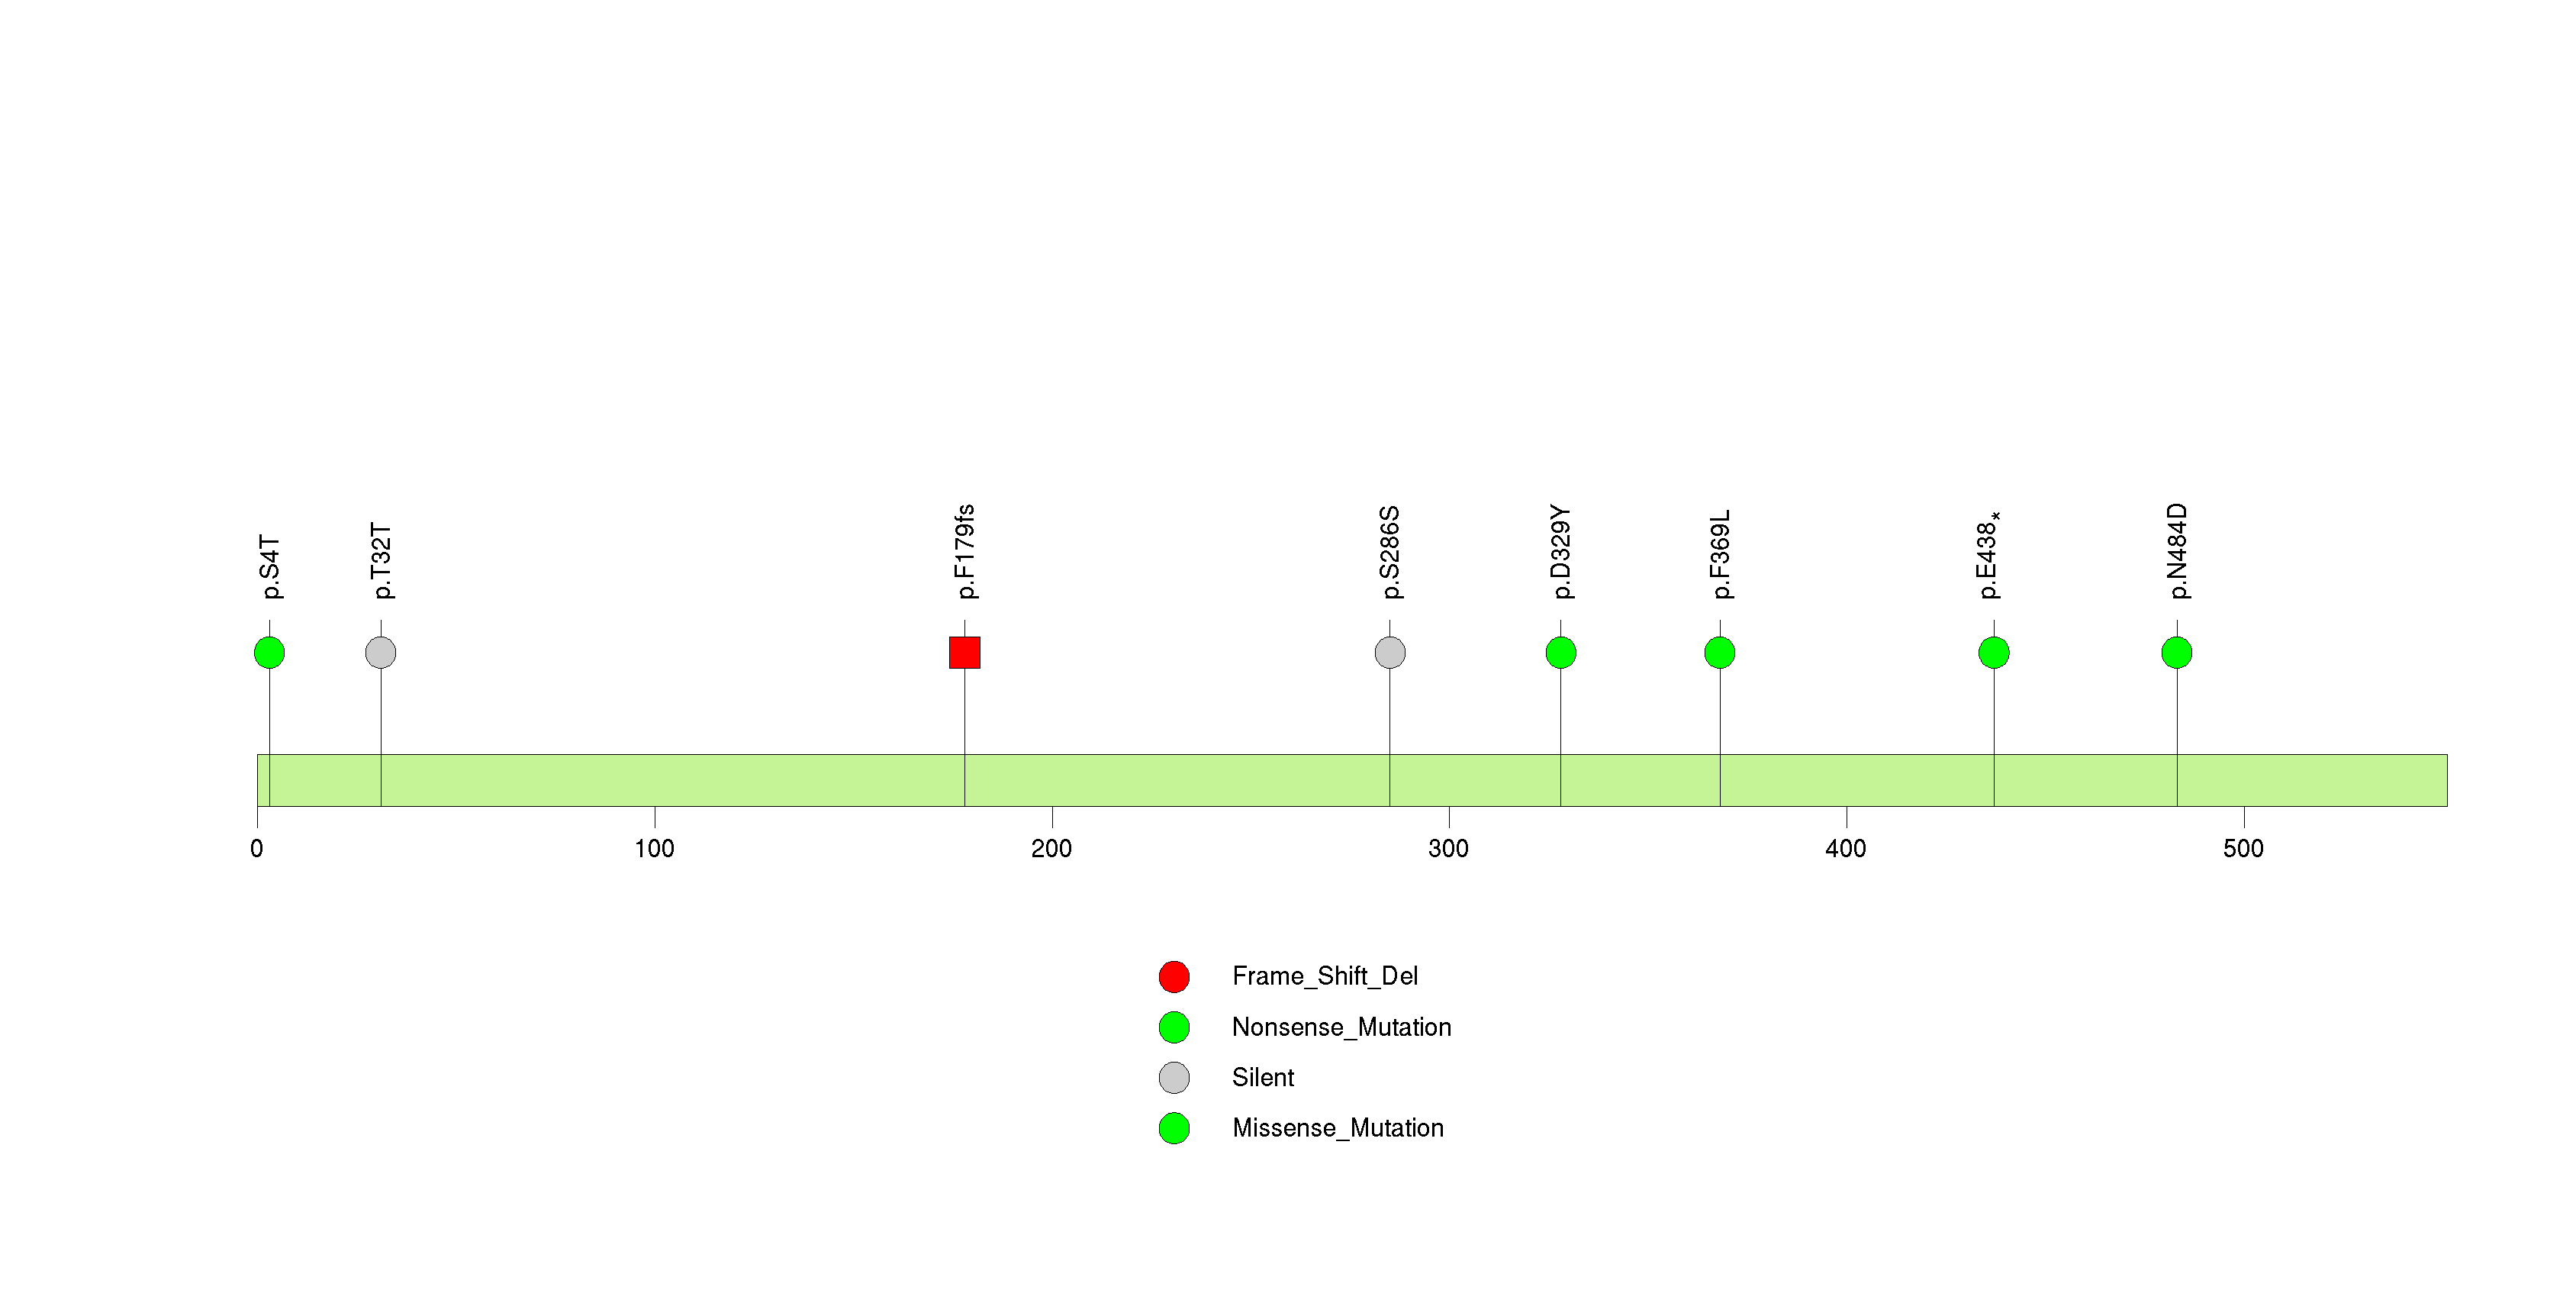
Figure S27. This figure depicts the distribution of mutations and mutation types across the C9orf79 significant gene.
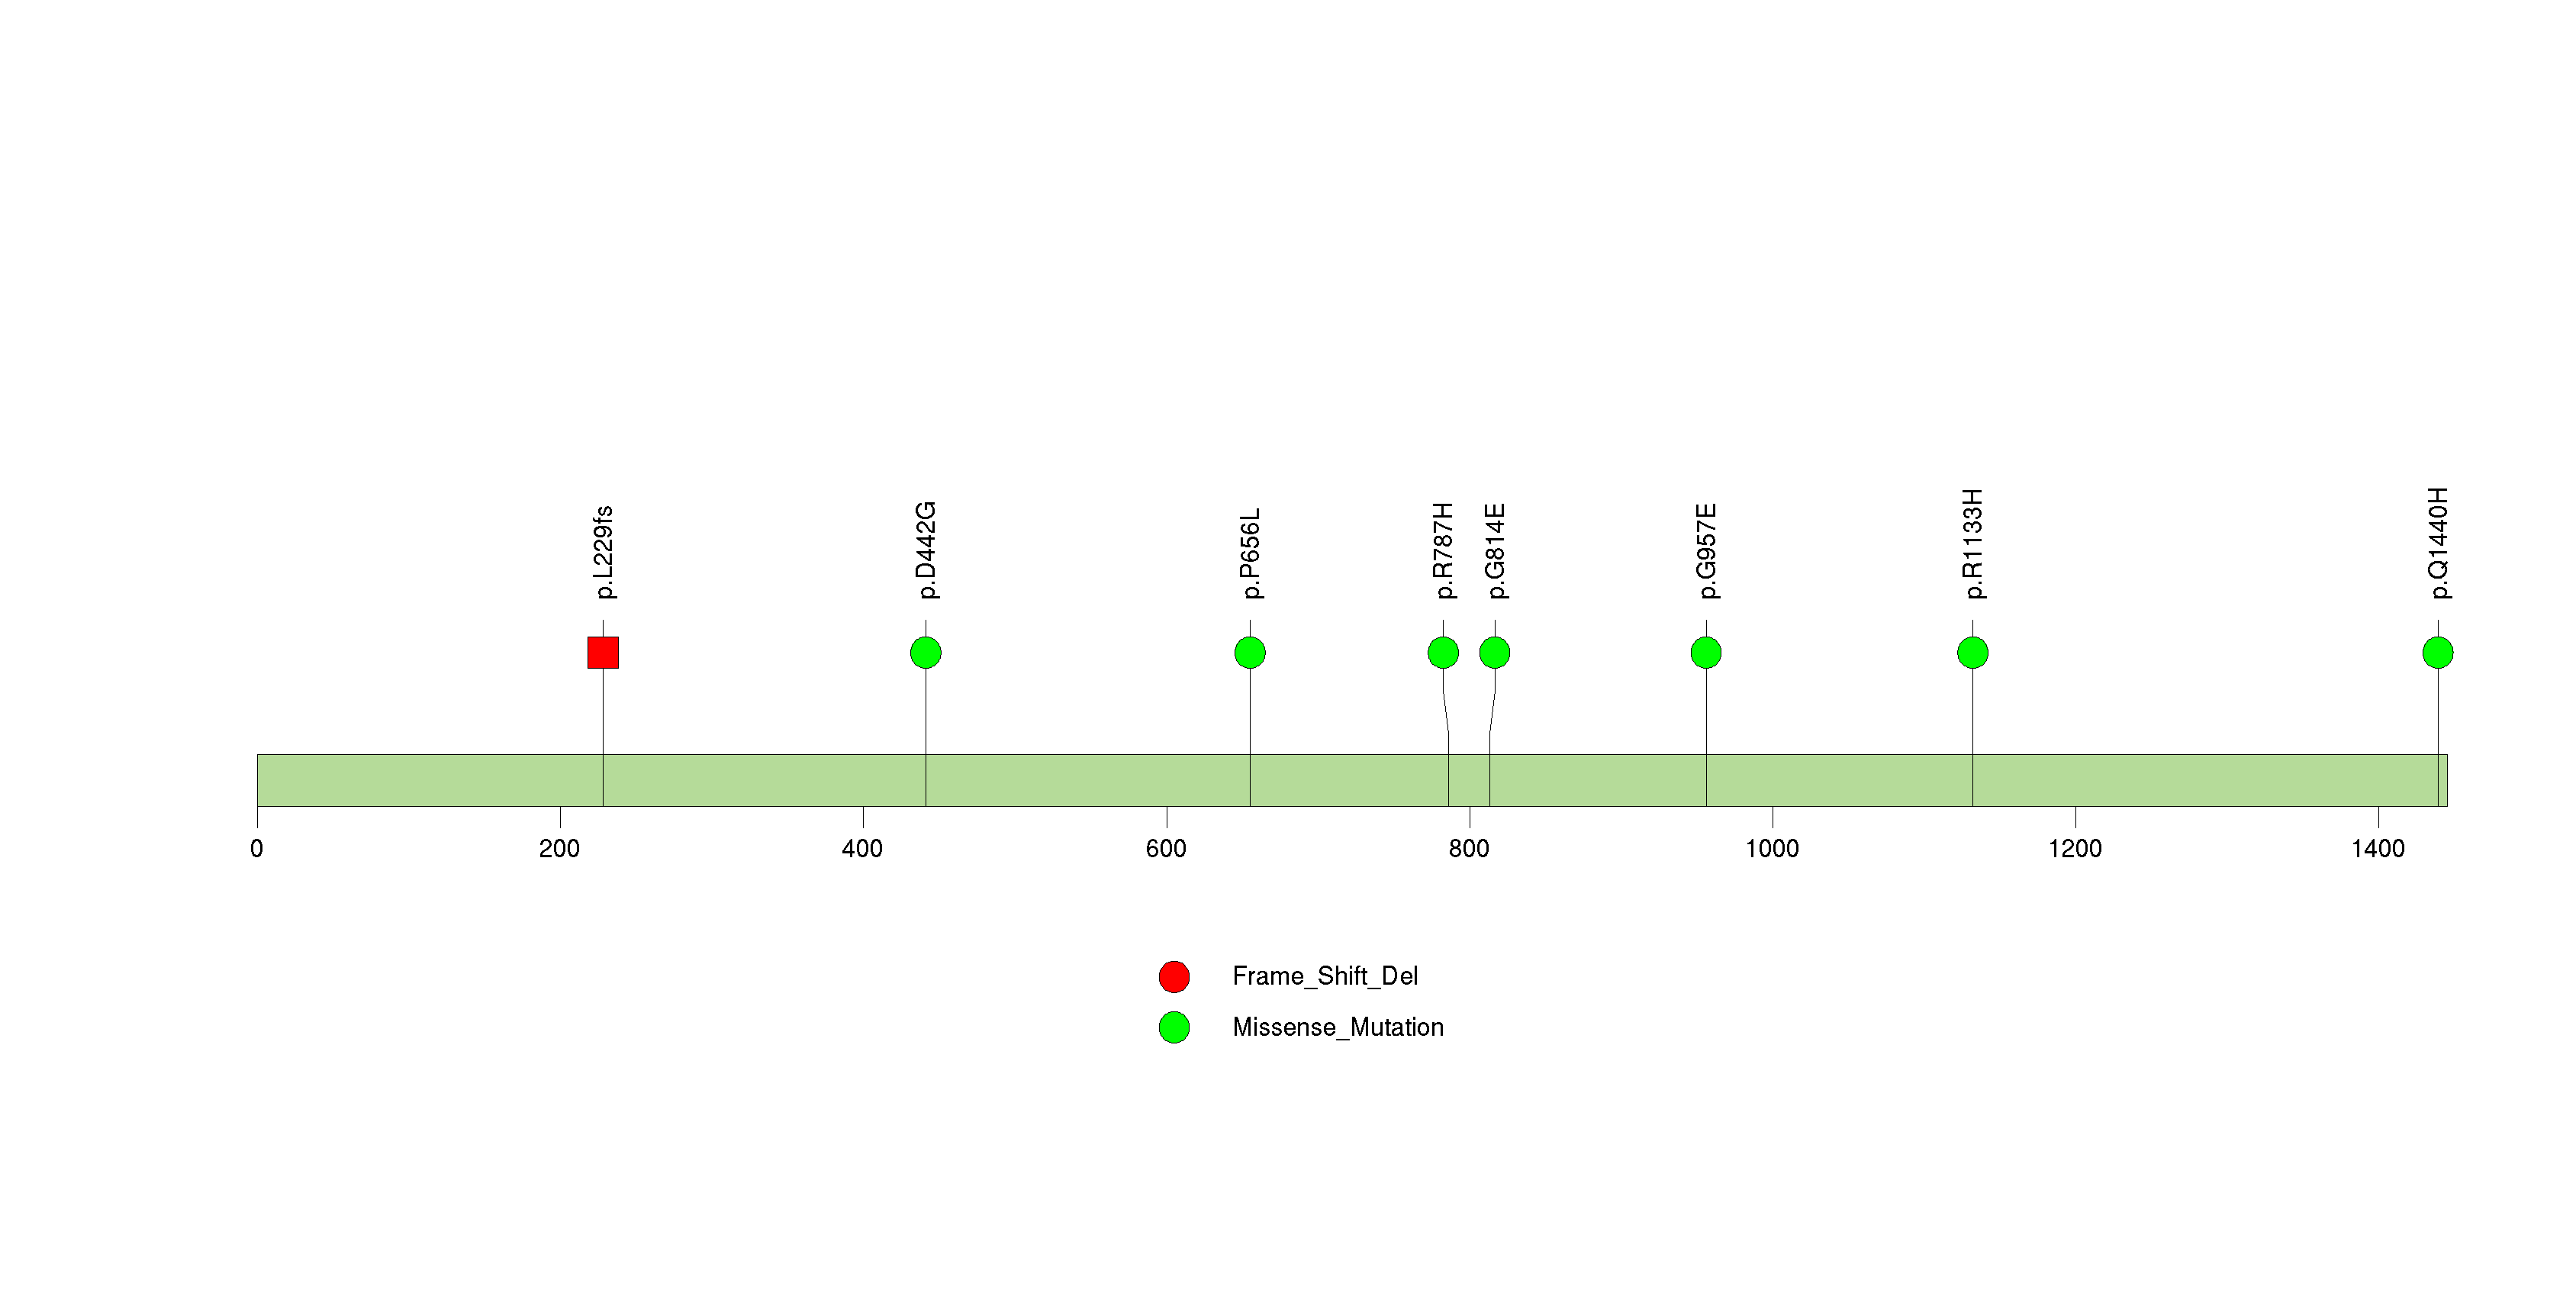
Figure S28. This figure depicts the distribution of mutations and mutation types across the OR5A1 significant gene.
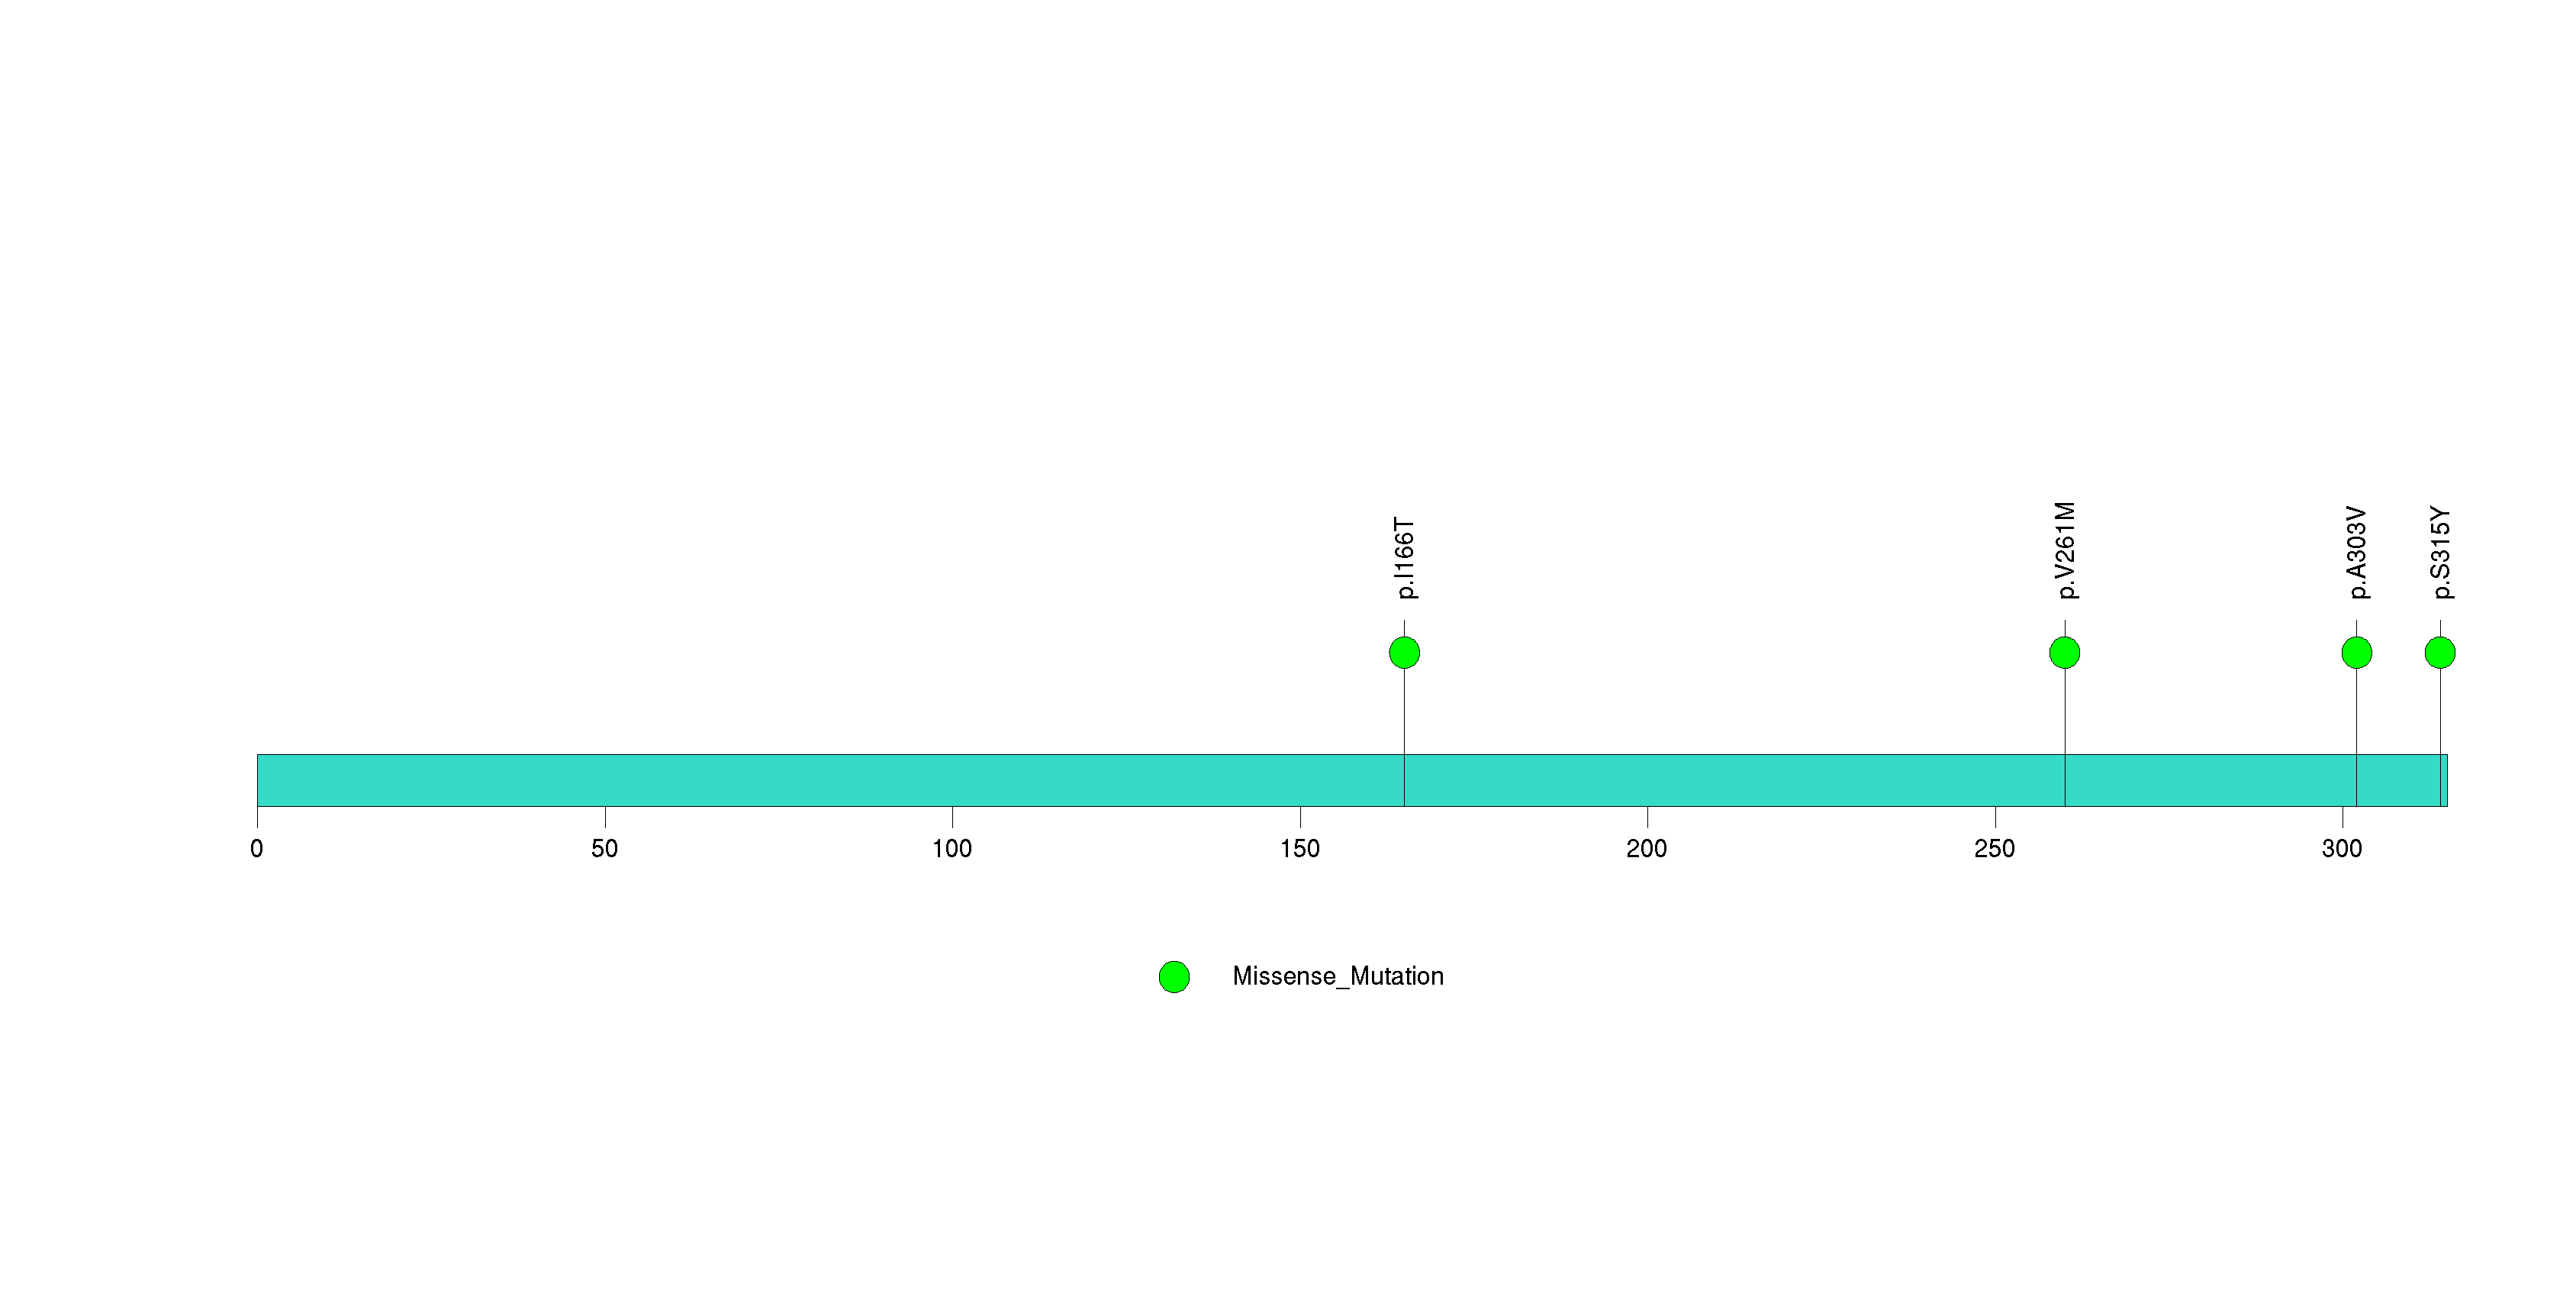
Figure S29. This figure depicts the distribution of mutations and mutation types across the NOX4 significant gene.
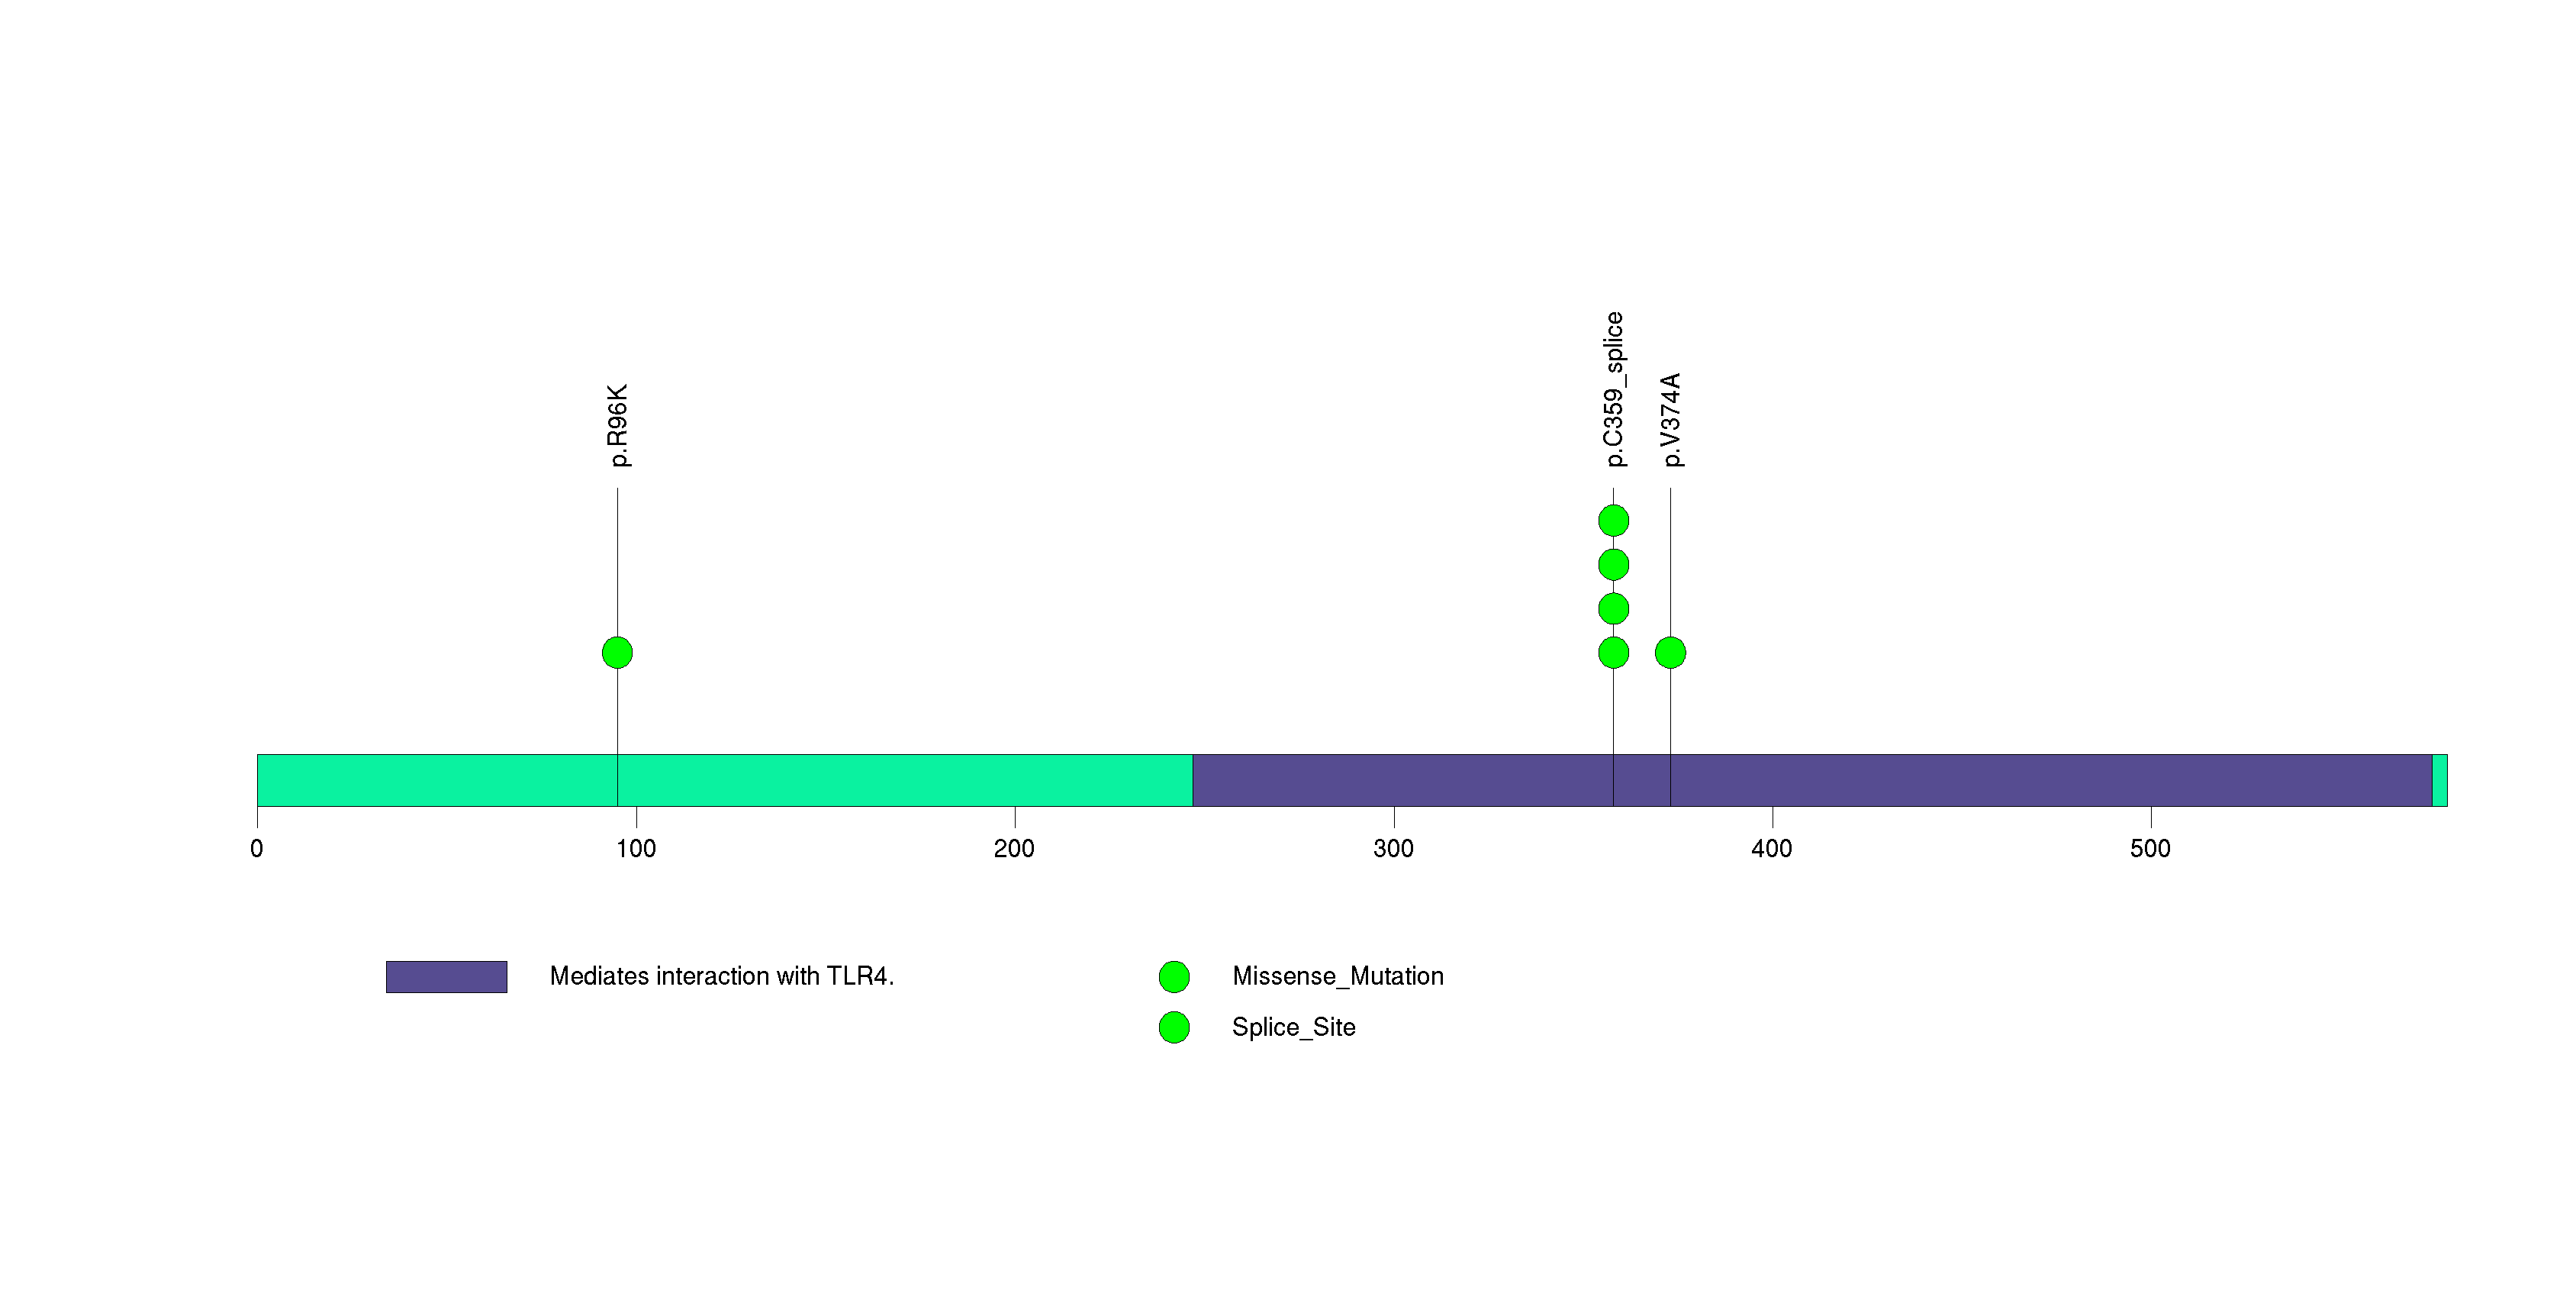
Figure S30. This figure depicts the distribution of mutations and mutation types across the DDX5 significant gene.
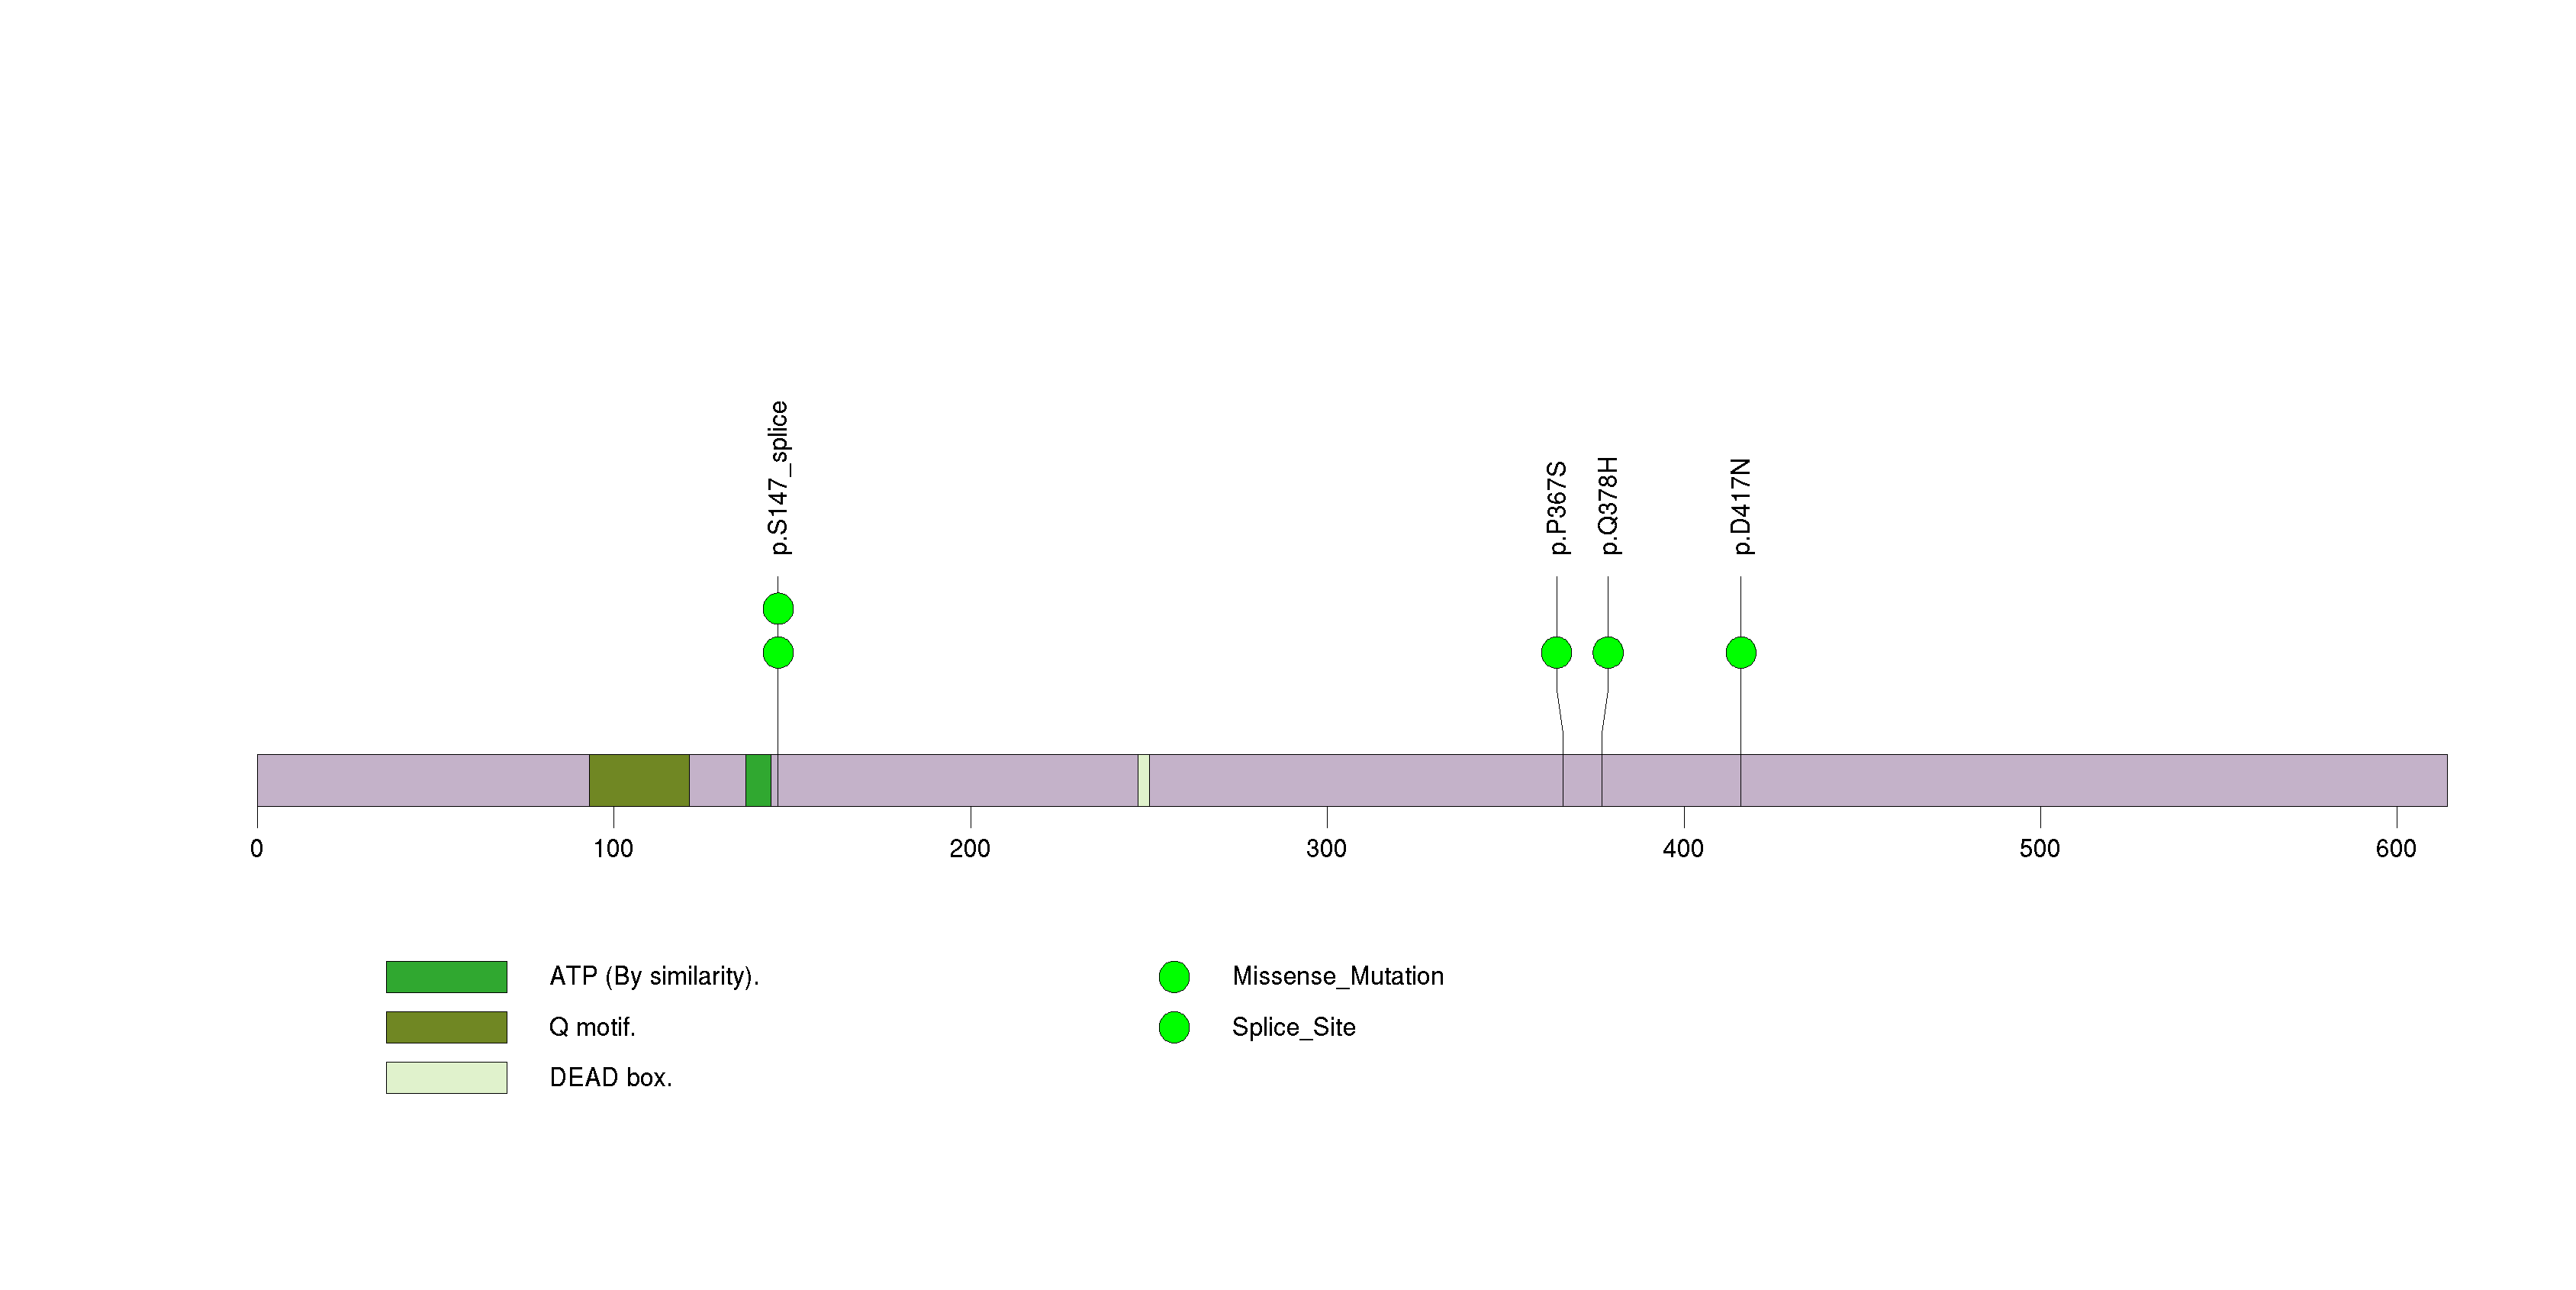
Figure S31. This figure depicts the distribution of mutations and mutation types across the PSD3 significant gene.
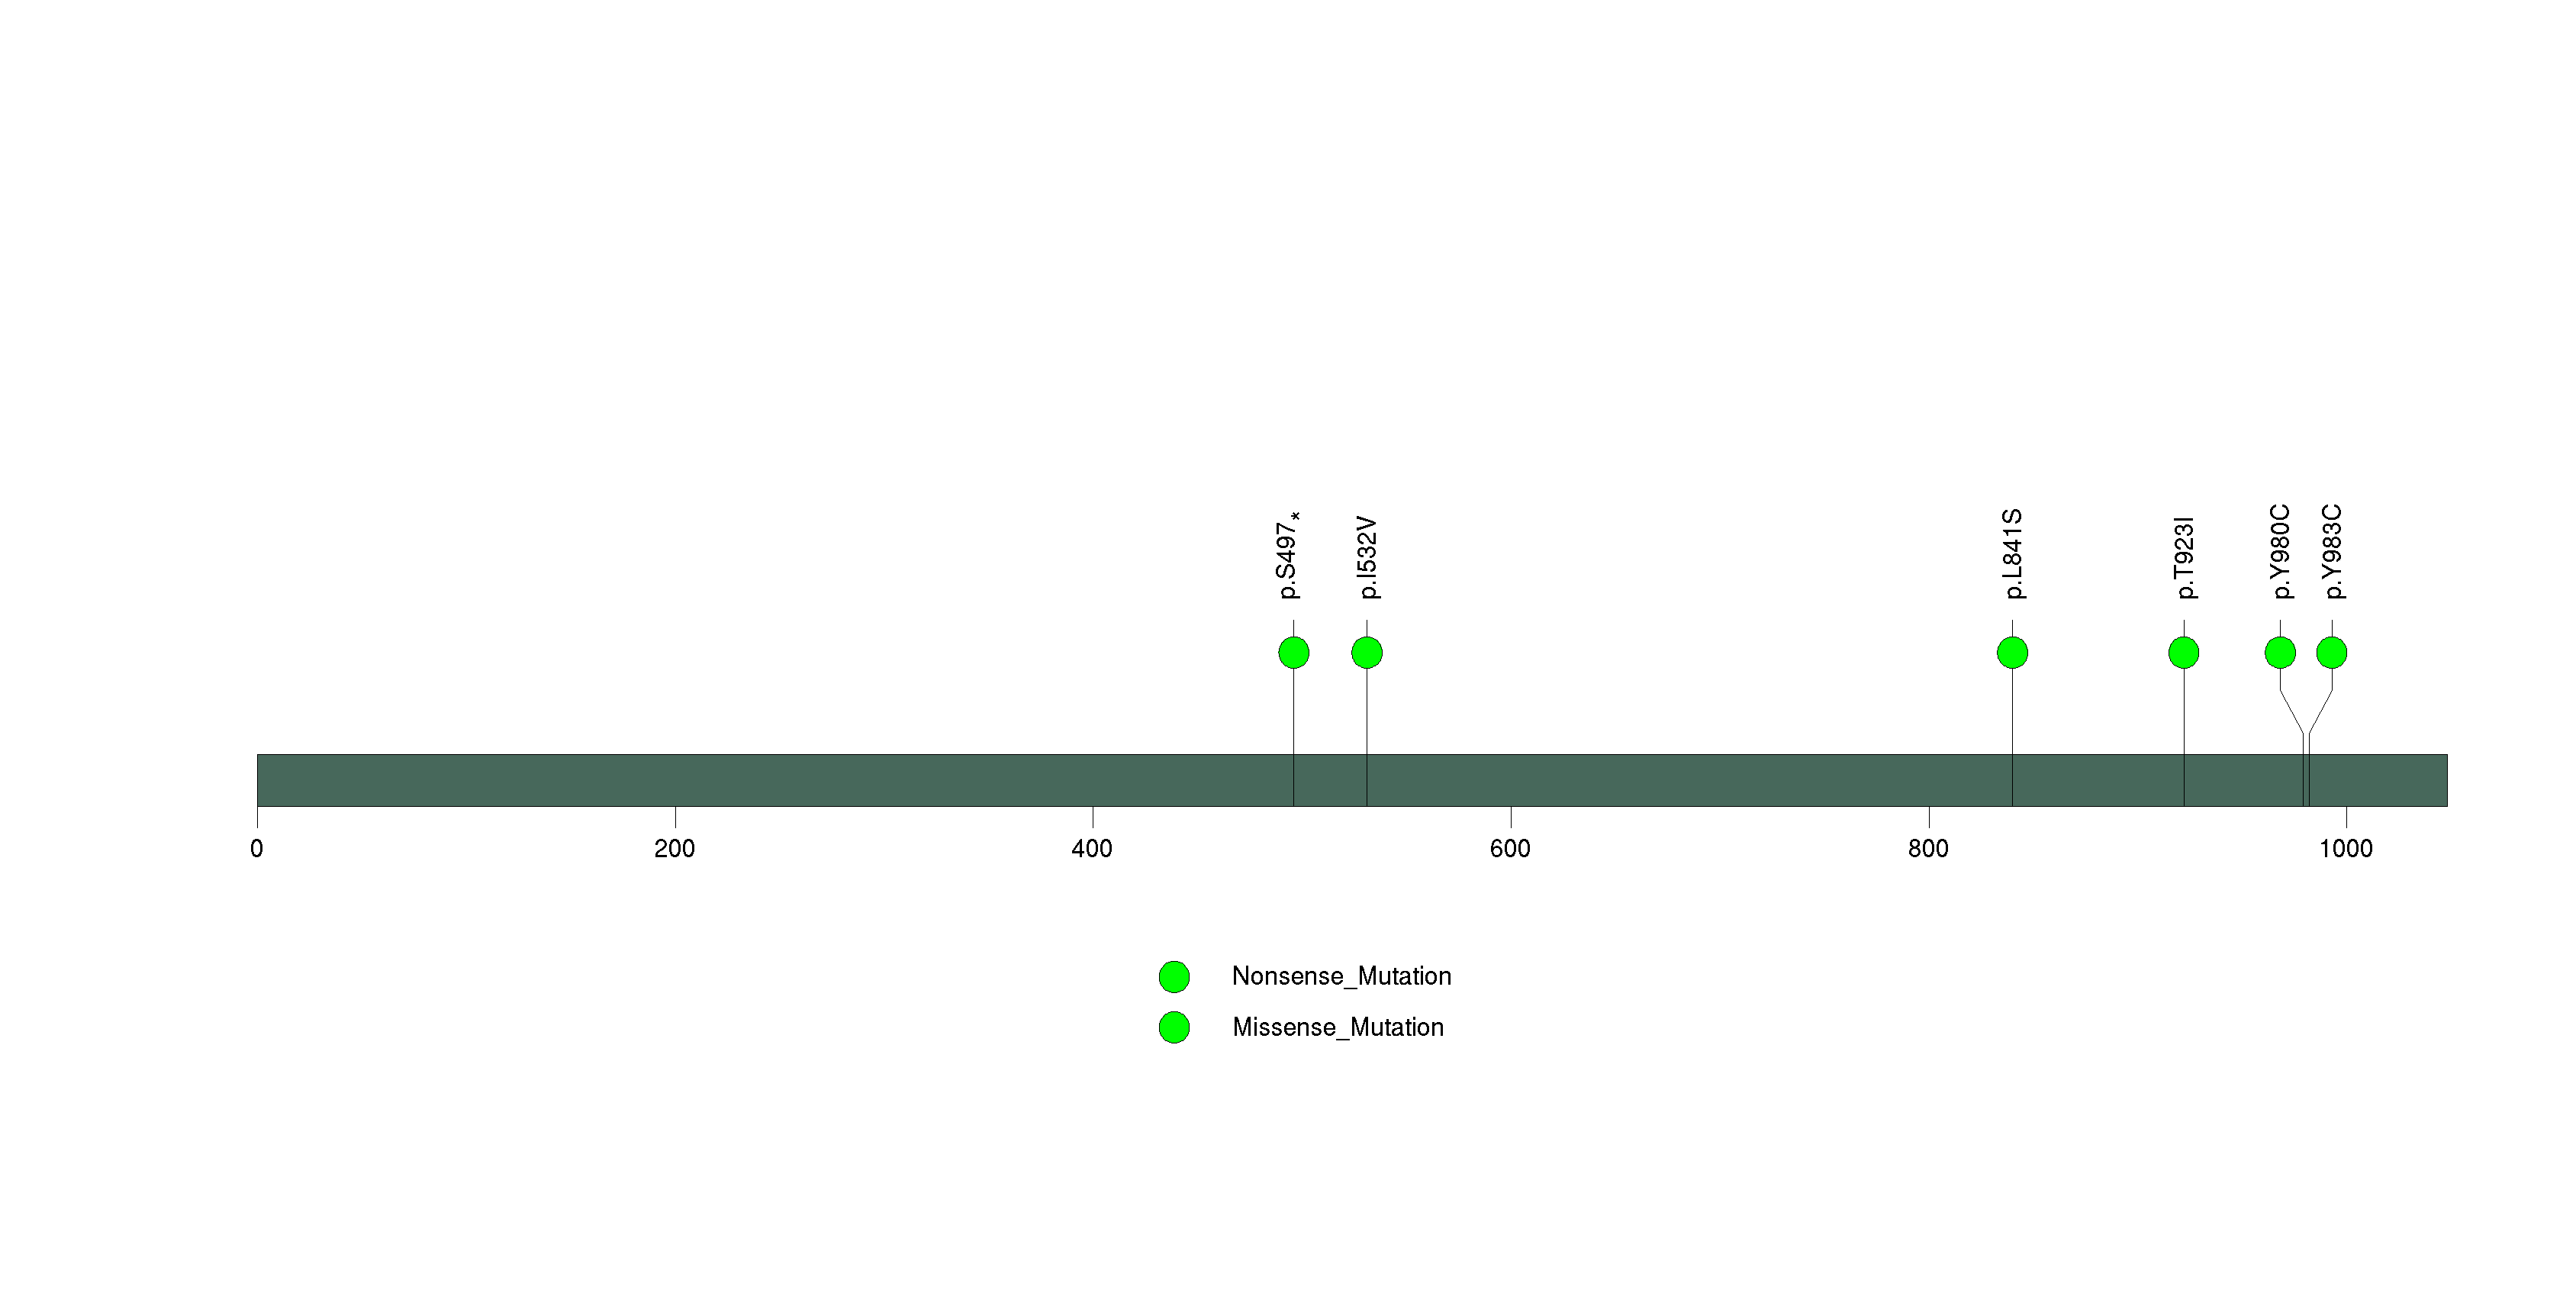
Figure S32. This figure depicts the distribution of mutations and mutation types across the OR4A16 significant gene.
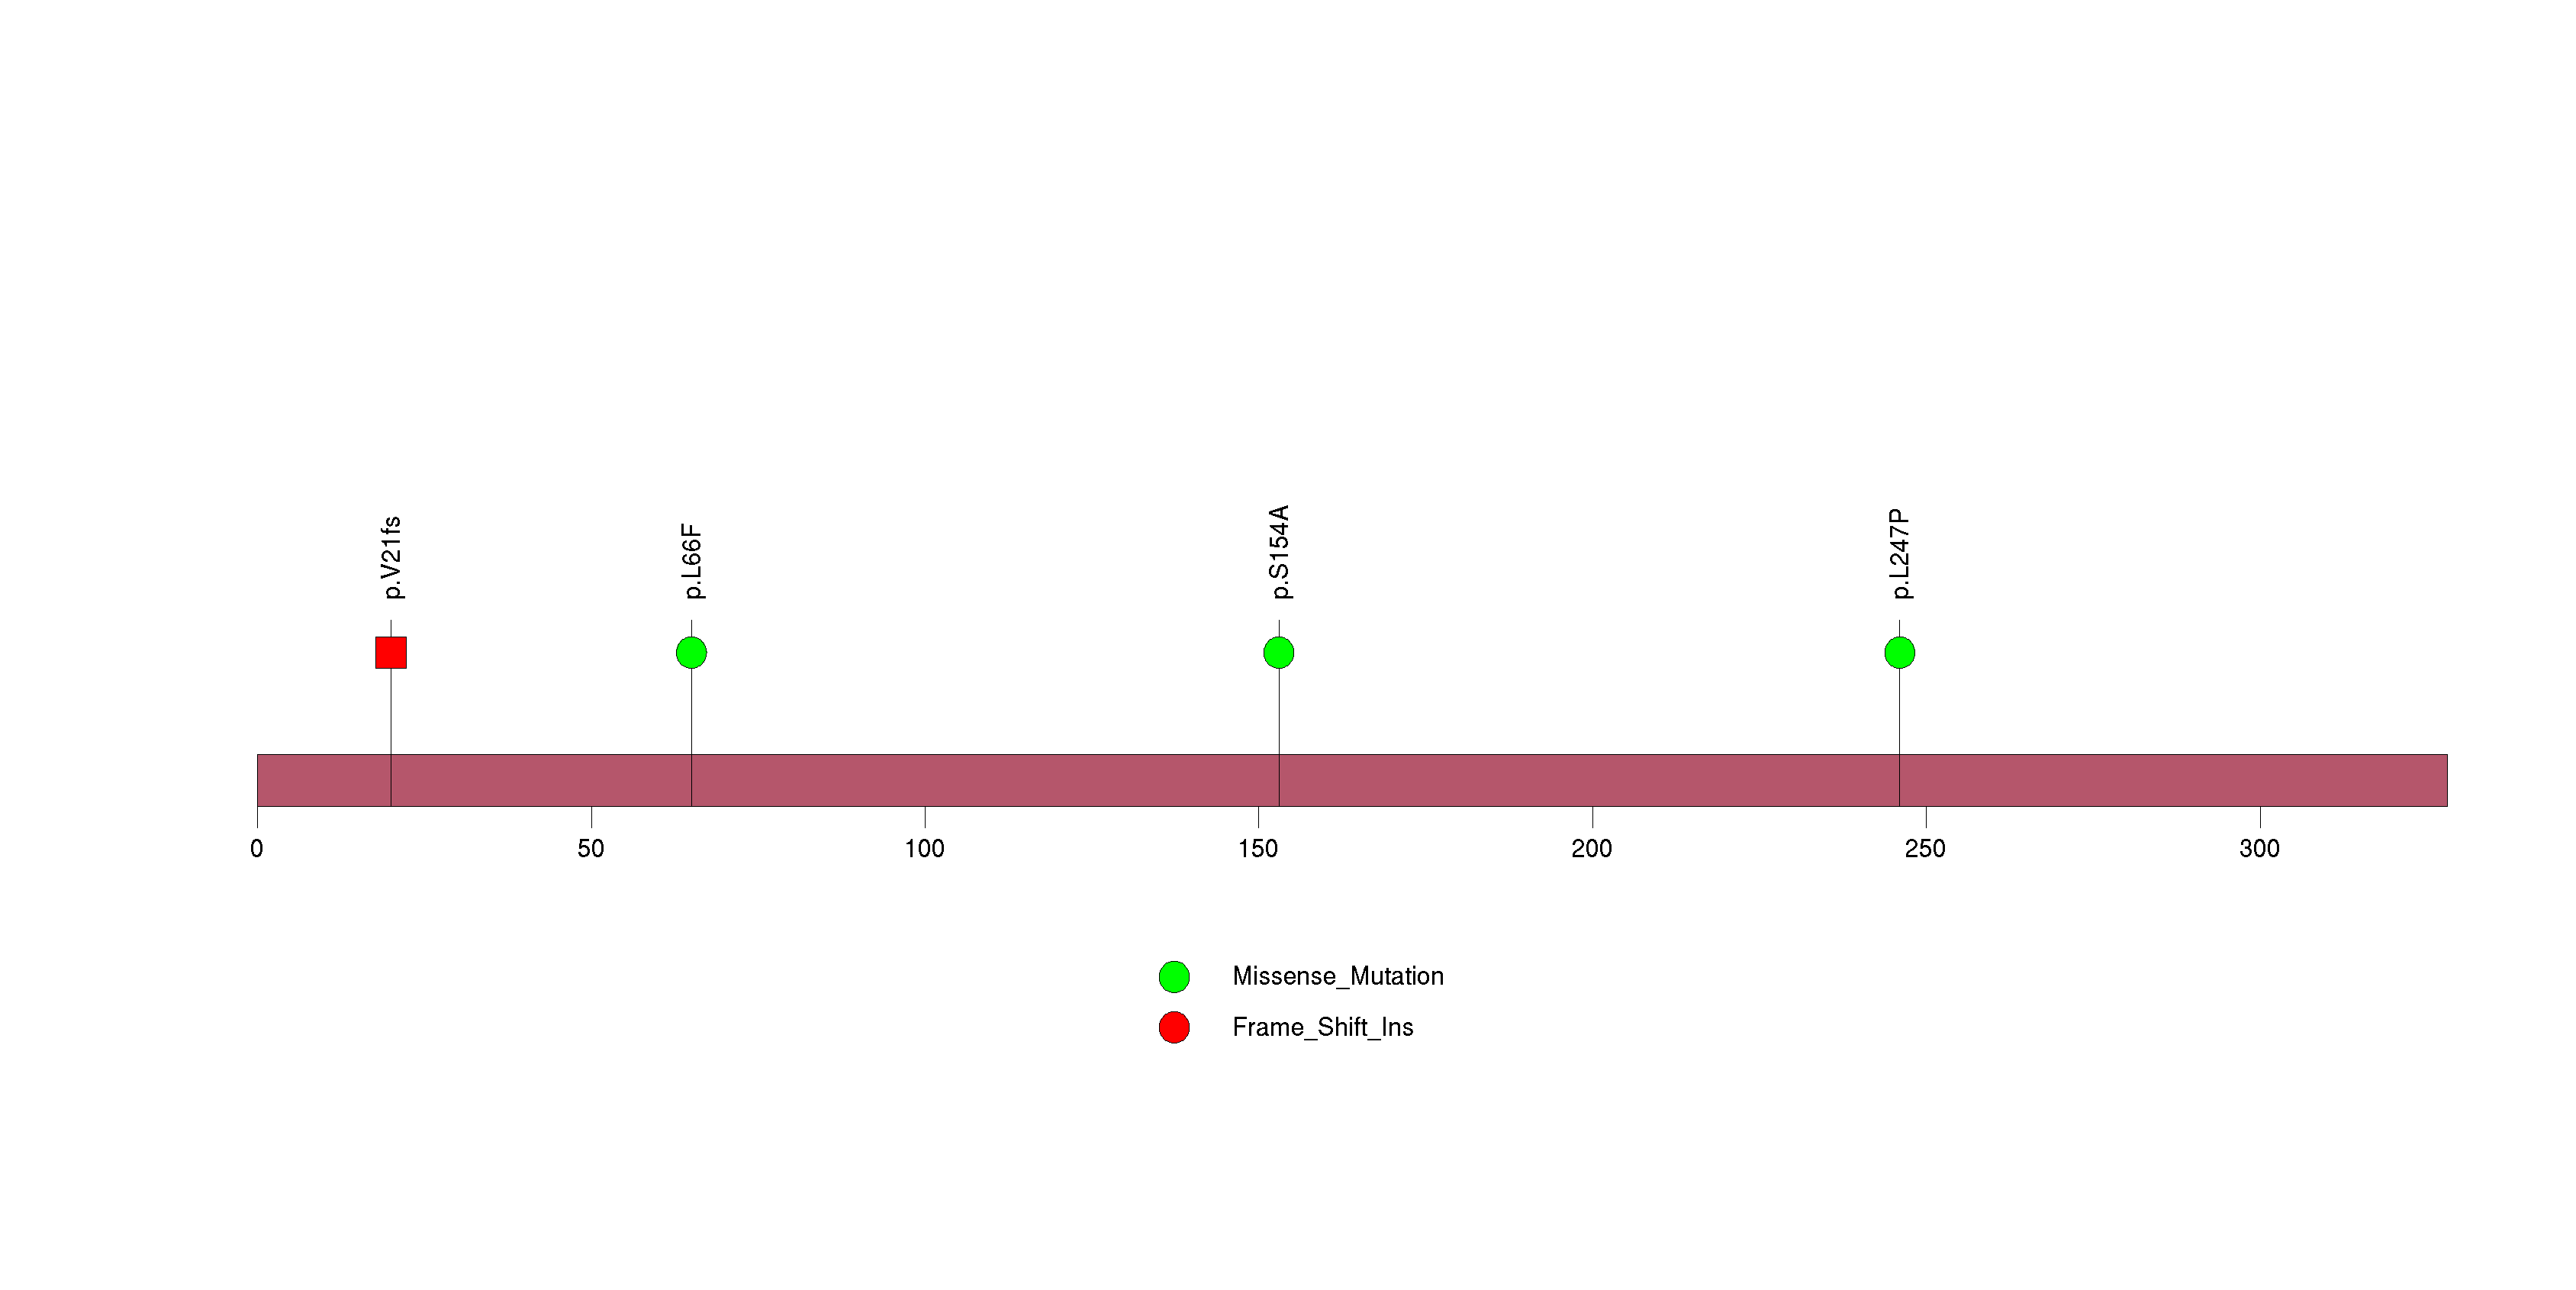
Figure S33. This figure depicts the distribution of mutations and mutation types across the CYP2C19 significant gene.
In this analysis, COSMIC is used as a filter to increase power by restricting the territory of each gene. Cosmic version: v48.
Table 4. Get Full Table Significantly mutated genes (COSMIC territory only). To access the database please go to: COSMIC. Number of significant genes found: 12. Number of genes displayed: 10
| rank | gene | description | n | cos | n_cos | N_cos | cos_ev | p | q |
|---|---|---|---|---|---|---|---|---|---|
| 1 | IDH1 | isocitrate dehydrogenase 1 (NADP+), soluble | 131 | 5 | 131 | 850 | 195452 | 3.1e-14 | 8.4e-11 |
| 2 | IDH2 | isocitrate dehydrogenase 2 (NADP+), mitochondrial | 6 | 6 | 6 | 1020 | 498 | 3.7e-14 | 8.4e-11 |
| 3 | PIK3R1 | phosphoinositide-3-kinase, regulatory subunit 1 (alpha) | 13 | 33 | 6 | 5610 | 12 | 2.8e-13 | 4.2e-10 |
| 4 | PIK3CA | phosphoinositide-3-kinase, catalytic, alpha polypeptide | 15 | 220 | 13 | 37400 | 1923 | 1.2e-12 | 1.4e-09 |
| 5 | TP53 | tumor protein p53 | 113 | 356 | 111 | 60520 | 42165 | 1.8e-12 | 1.6e-09 |
| 6 | PTEN | phosphatase and tensin homolog (mutated in multiple advanced cancers 1) | 8 | 767 | 8 | 130390 | 503 | 3.2e-08 | 0.000022 |
| 7 | EGFR | epidermal growth factor receptor (erythroblastic leukemia viral (v-erb-b) oncogene homolog, avian) | 10 | 293 | 6 | 49810 | 59 | 3.4e-08 | 0.000022 |
| 8 | SMARCA4 | SWI/SNF related, matrix associated, actin dependent regulator of chromatin, subfamily a, member 4 | 10 | 30 | 3 | 5100 | 1 | 9.4e-07 | 0.00047 |
| 9 | NF1 | neurofibromin 1 (neurofibromatosis, von Recklinghausen disease, Watson disease) | 14 | 285 | 5 | 48450 | 7 | 1e-06 | 0.00047 |
| 10 | PTPN11 | protein tyrosine phosphatase, non-receptor type 11 (Noonan syndrome 1) | 4 | 32 | 3 | 5440 | 60 | 1.1e-06 | 0.00047 |
Note:
n - number of (nonsilent) mutations in this gene across the individual set.
cos = number of unique mutated sites in this gene in COSMIC
n_cos = overlap between n and cos.
N_cos = number of individuals times cos.
cos_ev = total evidence: number of reports in COSMIC for mutations seen in this gene.
p = p-value for seeing the observed amount of overlap in this gene)
q = q-value, False Discovery Rate (Benjamini-Hochberg procedure)
Table 5. Get Full Table Genes with Clustered Mutations
| num | gene | desc | n | mindist | nmuts0 | nmuts3 | nmuts12 | npairs0 | npairs3 | npairs12 |
|---|---|---|---|---|---|---|---|---|---|---|
| 3643 | IDH1 | isocitrate dehydrogenase 1 (NADP+), soluble | 131 | 0 | 8515 | 8515 | 8515 | 8515 | 8515 | 8515 |
| 8201 | TP53 | tumor protein p53 | 113 | 0 | 476 | 660 | 1123 | 476 | 660 | 1123 |
| 3644 | IDH2 | isocitrate dehydrogenase 2 (NADP+), mitochondrial | 6 | 0 | 15 | 15 | 15 | 15 | 15 | 15 |
| 1672 | CIC | capicua homolog (Drosophila) | 40 | 0 | 14 | 22 | 42 | 14 | 22 | 42 |
| 683 | ATRX | alpha thalassemia/mental retardation syndrome X-linked (RAD54 homolog, S. cerevisiae) | 78 | 0 | 13 | 17 | 22 | 13 | 17 | 22 |
| 9188 | ZNF844 | zinc finger protein 844 | 6 | 0 | 7 | 7 | 15 | 7 | 7 | 15 |
| 9083 | ZNF57 | zinc finger protein 57 | 7 | 0 | 6 | 6 | 14 | 6 | 6 | 14 |
| 2463 | EGFR | epidermal growth factor receptor (erythroblastic leukemia viral (v-erb-b) oncogene homolog, avian) | 10 | 0 | 4 | 4 | 4 | 4 | 4 | 4 |
| 5967 | PIK3CA | phosphoinositide-3-kinase, catalytic, alpha polypeptide | 15 | 0 | 3 | 5 | 6 | 3 | 5 | 6 |
| 402 | ANKRD30A | ankyrin repeat domain 30A | 7 | 0 | 3 | 3 | 3 | 3 | 3 | 3 |
Note:
n - number of mutations in this gene in the individual set.
mindist - distance (in aa) between closest pair of mutations in this gene
npairs3 - how many pairs of mutations are within 3 aa of each other.
npairs12 - how many pairs of mutations are within 12 aa of each other.
Table 6. Get Full Table A Ranked List of Significantly Mutated Genesets. (Source: MSigDB GSEA Cannonical Pathway Set).Number of significant genesets found: 95. Number of genesets displayed: 10
| rank | geneset | description | genes | N_genes | mut_tally | N | n | npat | nsite | nsil | n1 | n2 | n3 | n4 | n5 | n6 | p_ns_s | p | q |
|---|---|---|---|---|---|---|---|---|---|---|---|---|---|---|---|---|---|---|---|
| 1 | HSA00720_REDUCTIVE_CARBOXYLATE_CYCLE | Genes involved in reductive carboxylate cycle (CO2 fixation) | ACLY, ACO1, ACO2, ACSS1, ACSS2, FH, IDH1, IDH2, LOC441996, MDH1, MDH2, SUCLA2 | 11 | ACLY(3), ACO1(2), ACO2(2), ACSS1(1), ACSS2(3), FH(1), IDH1(131), IDH2(6) | 3363648 | 149 | 140 | 16 | 0 | 128 | 6 | 0 | 13 | 2 | 0 | 2.33e-15 | <1.00e-15 | <8.80e-14 |
| 2 | REDUCTIVE_CARBOXYLATE_CYCLE_CO2_FIXATION | ACO1, ACO2, FH, IDH1, IDH2, MDH1, MDH2, SDHB, SUCLA2 | 9 | ACO1(2), ACO2(2), FH(1), IDH1(131), IDH2(6) | 2251788 | 142 | 138 | 9 | 0 | 126 | 5 | 0 | 11 | 0 | 0 | 1.11e-15 | <1.00e-15 | <8.80e-14 | |
| 3 | TELPATHWAY | Telomerase is a ribonucleotide protein that adds telomeric repeats to the 3' ends of chromosomes. | AKT1, BCL2, EGFR, G22P1, HSPCA, IGF1R, KRAS2, MYC, POLR2A, PPP2CA, PRKCA, RB1, TEP1, TERF1, TERT, TNKS, TP53, XRCC5 | 15 | AKT1(1), EGFR(10), IGF1R(3), POLR2A(3), PPP2CA(3), PRKCA(3), RB1(4), TEP1(5), TERF1(1), TP53(113), XRCC5(1) | 7123118 | 147 | 99 | 95 | 6 | 54 | 16 | 19 | 36 | 18 | 4 | 8.82e-14 | <1.00e-15 | <8.80e-14 |
| 4 | P53PATHWAY | p53 induces cell cycle arrest or apoptosis under conditions of DNA damage. | APAF1, ATM, BAX, BCL2, CCND1, CCNE1, CDK2, CDK4, CDKN1A, E2F1, GADD45A, MDM2, PCNA, RB1, TIMP3, TP53 | 16 | APAF1(1), ATM(4), BAX(1), CCND1(1), CDK2(1), CDK4(1), E2F1(1), MDM2(2), RB1(4), TIMP3(2), TP53(113) | 4580868 | 131 | 92 | 81 | 6 | 49 | 14 | 19 | 29 | 17 | 3 | 9.58e-11 | <1.00e-15 | <8.80e-14 |
| 5 | RBPATHWAY | The ATM protein kinase recognizes DNA damage and blocks cell cycle progression by phosphorylating chk1 and p53, which normally inhibits Rb to allow G1/S transitions. | ATM, CDC2, CDC25A, CDC25B, CDC25C, CDK2, CDK4, CHEK1, MYT1, RB1, TP53, WEE1, YWHAH | 12 | ATM(4), CDC25A(1), CDK2(1), CDK4(1), CHEK1(2), MYT1(2), RB1(4), TP53(113), WEE1(1) | 4452968 | 129 | 91 | 79 | 9 | 49 | 14 | 17 | 27 | 19 | 3 | 6.69e-08 | <1.00e-15 | <8.80e-14 |
| 6 | TERTPATHWAY | hTERC, the RNA subunit of telomerase, and hTERT, the catalytic protein subunit, are required for telomerase activity and are overexpressed in many cancers. | HDAC1, MAX, MYC, SP1, SP3, TP53, WT1, ZNF42 | 7 | MAX(4), SP3(2), TP53(113), WT1(1) | 1784759 | 120 | 91 | 69 | 2 | 49 | 13 | 14 | 28 | 13 | 3 | 6.55e-15 | <1.00e-15 | <8.80e-14 |
| 7 | PLK3PATHWAY | Active Plk3 phosphorylates CDC25c, blocking the G2/M transition, and phosphorylates p53 to induce apoptosis. | ATM, ATR, CDC25C, CHEK1, CHEK2, CNK, TP53, YWHAH | 7 | ATM(4), ATR(4), CHEK1(2), CHEK2(3), TP53(113) | 4056688 | 126 | 88 | 76 | 6 | 50 | 16 | 15 | 28 | 14 | 3 | 2.04e-08 | <1.00e-15 | <8.80e-14 |
| 8 | G1_TO_S_CELL_CYCLE_REACTOME | ATM, CCNA1, CCNB1, CCND1, CCND2, CCND3, CCNE1, CCNE2, CCNG2, CCNH, CDC25A, CDC45L, CDK2, CDK4, CDK7, CDKN1A, CDKN1B, CDKN1C, CDKN2A, CDKN2B, CDKN2C, CDKN2D, CREB3, CREB3L1, CREB3L3, CREB3L4, CREBL1, CREBL1, TNXB, E2F1, E2F2, E2F3, E2F4, E2F5, E2F6, FLJ14001, GADD45A, GBA2, MCM2, MCM3, MCM4, MCM5, MCM6, MCM7, MDM2, MNAT1, MYC, MYT1, NACA, NACA, FKSG17, ORC1L, ORC2L, ORC3L, ORC4L, ORC5L, ORC6L, PCNA, POLA2, POLE, POLE2, PRIM1, PRIM2A, RB1, RBL1, RPA1, RPA2, RPA3, TFDP1, TFDP2, TP53, WEE1 | 64 | ATM(4), CCNA1(1), CCND1(1), CCNE2(1), CCNG2(1), CCNH(2), CDC25A(1), CDK2(1), CDK4(1), CDKN1B(1), CDKN2A(2), CDKN2C(1), CREB3L1(1), E2F1(1), E2F3(1), E2F5(1), GBA2(1), MCM3(2), MCM4(3), MCM5(1), MCM6(1), MCM7(2), MDM2(2), MYT1(2), ORC1L(2), ORC2L(1), ORC3L(1), ORC4L(1), POLE(6), PRIM1(1), RB1(4), RBL1(2), RPA1(2), TNXB(9), TP53(113), WEE1(1) | 19490078 | 178 | 96 | 128 | 22 | 61 | 20 | 24 | 44 | 26 | 3 | 4.78e-08 | 1.22e-15 | 9.33e-14 | |
| 9 | CITRATE_CYCLE_TCA_CYCLE | ACO1, ACO2, CS, DLD, DLST, DLSTP, FH, IDH1, IDH2, IDH3A, IDH3B, IDH3G, MDH1, MDH2, PC, PCK1, SDHA, SDHA, SDHAL2, SDHB, SUCLA2, SUCLG1, SUCLG2 | 20 | ACO1(2), ACO2(2), FH(1), IDH1(131), IDH2(6), IDH3B(1), PC(1), PCK1(3), SUCLG2(1) | 5210151 | 148 | 138 | 15 | 2 | 128 | 8 | 0 | 12 | 0 | 0 | 3.00e-15 | 1.67e-15 | 9.33e-14 | |
| 10 | HSA04210_APOPTOSIS | Genes involved in apoptosis | AIFM1, AKT1, AKT2, AKT3, APAF1, ATM, BAD, BAX, BCL2, BCL2L1, BID, BIRC2, BIRC3, BIRC4, CAPN1, CAPN2, CASP10, CASP3, CASP6, CASP7, CASP8, CASP9, CFLAR, CHP, CHUK, CSF2RB, CYCS, DFFA, DFFB, ENDOG, FADD, FAS, FASLG, IKBKB, IKBKG, IL1A, IL1B, IL1R1, IL1RAP, IL3, IL3RA, IRAK1, IRAK2, IRAK3, IRAK4, MAP3K14, MYD88, NFKB1, NFKB2, NFKBIA, NGFB, NTRK1, PIK3CA, PIK3CB, PIK3CD, PIK3CG, PIK3R1, PIK3R2, PIK3R3, PIK3R5, PPP3CA, PPP3CB, PPP3CC, PPP3R1, PPP3R2, PRKACA, PRKACB, PRKACG, PRKAR1A, PRKAR1B, PRKAR2A, PRKAR2B, RELA, RIPK1, TNF, TNFRSF10A, TNFRSF10B, TNFRSF10C, TNFRSF10D, TNFRSF1A, TNFSF10, TP53, TRADD, TRAF2 | 80 | AIFM1(2), AKT1(1), APAF1(1), ATM(4), BAX(1), BIRC2(1), CFLAR(1), CYCS(2), DFFA(1), FAS(1), IL1B(1), IL1R1(1), IL1RAP(1), IL3RA(2), IRAK2(1), IRAK3(4), IRAK4(1), MAP3K14(1), NFKB1(1), NFKB2(1), PIK3CA(15), PIK3CB(1), PIK3CD(1), PIK3CG(4), PIK3R1(13), PIK3R2(1), PIK3R3(1), PIK3R5(1), PPP3CA(1), PPP3CC(1), PPP3R2(1), PRKAR1A(1), RELA(1), RIPK1(1), TNFRSF10D(1), TP53(113) | 21116382 | 186 | 109 | 129 | 28 | 57 | 27 | 27 | 42 | 30 | 3 | 5.36e-06 | 1.67e-15 | 9.33e-14 |
Table 7. Get Full Table A Ranked List of Significantly Mutated Genesets (Excluding Significantly Mutated Genes). Number of significant genesets found: 0. Number of genesets displayed: 10
| rank | geneset | description | genes | N_genes | mut_tally | N | n | npat | nsite | nsil | n1 | n2 | n3 | n4 | n5 | n6 | p_ns_s | p | q |
|---|---|---|---|---|---|---|---|---|---|---|---|---|---|---|---|---|---|---|---|
| 1 | FLUMAZENILPATHWAY | Flumazenil is a benzodiazepine receptor antagonist that may induce protective preconditioning in ischemic cardiomyocytes. | GABRA1, GABRA2, GABRA3, GABRA4, GABRA5, GABRA6, GPX1, PRKCE, SOD1 | 9 | GABRA1(7), GABRA3(1), GABRA4(3), GABRA5(1), GABRA6(3) | 1995807 | 15 | 9 | 15 | 4 | 3 | 4 | 1 | 5 | 2 | 0 | 0.36 | 0.007 | 1 |
| 2 | P27PATHWAY | p27 blocks the G1/S transition by inhibiting the checkpoint kinase cdk2/cyclin E and is inhibited by cdk2-mediated ubiquitination. | CCNE1, CDK2, CDKN1B, CKS1B, CUL1, E2F1, NEDD8, RB1, RBX1, SKP1A, SKP2, TFDP1, UBE2M | 12 | CDK2(1), CDKN1B(1), CUL1(1), E2F1(1), RB1(4), SKP2(2), UBE2M(1) | 2167354 | 11 | 8 | 11 | 1 | 1 | 1 | 4 | 1 | 4 | 0 | 0.17 | 0.0082 | 1 |
| 3 | SKP2E2FPATHWAY | E2F-1, a transcription factor that promotes the G1/S transition, is repressed by Rb and activated by cdk2/cyclin E. | CCNA1, CCNE1, CDC34, CDK2, CUL1, E2F1, RB1, SKP1A, SKP2, TFDP1 | 9 | CCNA1(1), CDC34(1), CDK2(1), CUL1(1), E2F1(1), RB1(4), SKP2(2) | 2161111 | 11 | 8 | 11 | 1 | 1 | 1 | 4 | 1 | 4 | 0 | 0.19 | 0.01 | 1 |
| 4 | UREACYCLEPATHWAY | Ammonia released from amino acid deamination is used to produce carbamoyl phosphate, which is used to convert ornithine to citrulline, from which urea is eventually formed. | ARG1, ASL, ASS, CPS1, GLS, GLUD1, GOT1 | 6 | ASL(2), CPS1(4), GLS(1), GLUD1(3), GOT1(2) | 1974792 | 12 | 6 | 12 | 2 | 1 | 2 | 0 | 5 | 4 | 0 | 0.44 | 0.028 | 1 |
| 5 | HSA00592_ALPHA_LINOLENIC_ACID_METABOLISM | Genes involved in alpha-Linolenic acid metabolism | ACOX1, ACOX3, FADS2, PLA2G10, PLA2G12A, PLA2G12B, PLA2G1B, PLA2G2A, PLA2G2D, PLA2G2E, PLA2G2F, PLA2G3, PLA2G4A, PLA2G5, PLA2G6 | 15 | ACOX1(2), ACOX3(3), FADS2(2), PLA2G2D(1), PLA2G3(3), PLA2G4A(2), PLA2G5(1), PLA2G6(2) | 2562807 | 16 | 7 | 16 | 2 | 3 | 4 | 2 | 5 | 2 | 0 | 0.11 | 0.031 | 1 |
| 6 | PLCPATHWAY | Phospholipase C hydrolyzes the membrane lipid PIP2 to DAG, which activates protein kinase C, and IP3, which causes calcium influx. | AKT1, PIK3CA, PIK3R1, PLCB1, PLCG1, PRKCA, PRKCB1, VAV1 | 5 | AKT1(1), PLCB1(2), PLCG1(6), PRKCA(3), VAV1(3) | 2289050 | 15 | 10 | 14 | 3 | 4 | 3 | 2 | 4 | 1 | 1 | 0.26 | 0.034 | 1 |
| 7 | MALATEXPATHWAY | The tricarboxylate transfer pathway shuttles acetyl groups of acetyl-CoA between mitochondria and the cytoplasm. | ACLY, CS, MDH1, ME1, PC, PDHA1, SLC25A1, SLC25A11 | 8 | ACLY(3), ME1(1), PC(1), PDHA1(2), SLC25A1(1) | 2347660 | 8 | 7 | 8 | 0 | 1 | 2 | 0 | 3 | 2 | 0 | 0.068 | 0.041 | 1 |
| 8 | SLRPPATHWAY | Small leucine-rich proteoglycans (SLRPs) interact with and reorganize collagen fibers in the extracellular matrix. | BGN, DCN, DSPG3, FMOD, KERA, LUM | 5 | BGN(2), DCN(1), FMOD(1), LUM(2) | 917147 | 6 | 5 | 6 | 2 | 1 | 1 | 0 | 4 | 0 | 0 | 0.69 | 0.054 | 1 |
| 9 | HSA00232_CAFFEINE_METABOLISM | Genes involved in caffeine metabolism | CYP1A2, CYP2A13, CYP2A6, CYP2A7, NAT1, NAT2, XDH | 7 | CYP1A2(1), NAT1(1), NAT2(2), XDH(7) | 2013925 | 11 | 6 | 11 | 0 | 3 | 1 | 0 | 5 | 2 | 0 | 0.052 | 0.055 | 1 |
| 10 | ACETYLCHOLINE_SYNTHESIS | ACHE, CHAT, CHKA, PCYT1A, PDHA1, PDHA2, PEMT, SLC18A3 | 8 | ACHE(2), CHAT(3), PDHA1(2), PDHA2(4) | 1756754 | 11 | 6 | 11 | 1 | 2 | 5 | 1 | 1 | 2 | 0 | 0.048 | 0.058 | 1 |
In brief, we tabulate the number of mutations and the number of covered bases for each gene. The counts are broken down by mutation context category: four context categories that are discovered by MutSig, and one for indel and 'null' mutations, which include indels, nonsense mutations, splice-site mutations, and non-stop (read-through) mutations. For each gene, we calculate the probability of seeing the observed constellation of mutations, i.e. the product P1 x P2 x ... x Pm, or a more extreme one, given the background mutation rates calculated across the dataset. [1]
This is an experimental feature. The full results of the analysis summarized in this report can be downloaded from the TCGA Data Coordination Center.