(primary solid tumor cohort)
This pipeline computes the correlation between significant arm-level copy number variations (cnvs) and selected clinical features.
Testing the association between copy number variation 61 arm-level results and 3 clinical features across 61 patients, 2 significant findings detected with Q value < 0.25.
-
18p loss cnv correlated to 'AGE'.
-
18q loss cnv correlated to 'AGE'.
Table 1. Get Full Table Overview of the association between significant copy number variation of 61 arm-level results and 3 clinical features. Shown in the table are P values (Q values). Thresholded by Q value < 0.25, 2 significant findings detected.
|
Clinical Features |
Time to Death |
AGE | GENDER | ||
| nCNV (%) | nWild-Type | logrank test | t-test | Fisher's exact test | |
| 18p loss | 7 (11%) | 54 |
0.0213 (1.00) |
0.000571 (0.101) |
0.695 (1.00) |
| 18q loss | 9 (15%) | 52 |
0.2 (1.00) |
0.00109 (0.191) |
0.71 (1.00) |
| 1p gain | 8 (13%) | 53 |
0.807 (1.00) |
0.237 (1.00) |
1 (1.00) |
| 1q gain | 33 (54%) | 28 |
0.71 (1.00) |
0.73 (1.00) |
0.423 (1.00) |
| 2p gain | 8 (13%) | 53 |
0.738 (1.00) |
0.115 (1.00) |
0.124 (1.00) |
| 2q gain | 7 (11%) | 54 |
0.867 (1.00) |
0.227 (1.00) |
0.087 (1.00) |
| 4p gain | 4 (7%) | 57 |
0.931 (1.00) |
0.455 (1.00) |
0.129 (1.00) |
| 5p gain | 18 (30%) | 43 |
0.304 (1.00) |
0.227 (1.00) |
1 (1.00) |
| 5q gain | 13 (21%) | 48 |
0.197 (1.00) |
0.201 (1.00) |
1 (1.00) |
| 6p gain | 12 (20%) | 49 |
0.123 (1.00) |
0.79 (1.00) |
0.509 (1.00) |
| 6q gain | 8 (13%) | 53 |
0.00574 (1.00) |
0.506 (1.00) |
0.699 (1.00) |
| 7p gain | 17 (28%) | 44 |
0.816 (1.00) |
0.615 (1.00) |
0.373 (1.00) |
| 7q gain | 18 (30%) | 43 |
0.828 (1.00) |
0.601 (1.00) |
0.397 (1.00) |
| 8p gain | 11 (18%) | 50 |
0.112 (1.00) |
0.577 (1.00) |
0.299 (1.00) |
| 8q gain | 31 (51%) | 30 |
0.271 (1.00) |
0.594 (1.00) |
0.6 (1.00) |
| 9p gain | 3 (5%) | 58 |
0.822 (1.00) |
0.293 (1.00) |
|
| 9q gain | 3 (5%) | 58 |
0.822 (1.00) |
0.293 (1.00) |
|
| 10p gain | 5 (8%) | 56 |
0.166 (1.00) |
0.39 (1.00) |
0.341 (1.00) |
| 12q gain | 3 (5%) | 58 |
0.894 (1.00) |
0.293 (1.00) |
|
| 15q gain | 5 (8%) | 56 |
0.814 (1.00) |
0.328 (1.00) |
0.341 (1.00) |
| 16p gain | 3 (5%) | 58 |
0.0077 (1.00) |
0.149 (1.00) |
1 (1.00) |
| 17p gain | 3 (5%) | 58 |
0.467 (1.00) |
0.711 (1.00) |
0.293 (1.00) |
| 17q gain | 16 (26%) | 45 |
0.0844 (1.00) |
0.876 (1.00) |
0.548 (1.00) |
| 18q gain | 3 (5%) | 58 |
0.937 (1.00) |
0.619 (1.00) |
1 (1.00) |
| 19p gain | 5 (8%) | 56 |
0.759 (1.00) |
0.62 (1.00) |
0.0524 (1.00) |
| 19q gain | 7 (11%) | 54 |
0.795 (1.00) |
0.822 (1.00) |
0.087 (1.00) |
| 20p gain | 12 (20%) | 49 |
0.238 (1.00) |
0.0865 (1.00) |
0.322 (1.00) |
| 20q gain | 13 (21%) | 48 |
0.361 (1.00) |
0.059 (1.00) |
0.517 (1.00) |
| 21q gain | 4 (7%) | 57 |
0.696 (1.00) |
0.613 (1.00) |
0.129 (1.00) |
| 22q gain | 6 (10%) | 55 |
0.16 (1.00) |
0.068 (1.00) |
0.658 (1.00) |
| Xq gain | 4 (7%) | 57 |
0.228 (1.00) |
0.223 (1.00) |
1 (1.00) |
| 1p loss | 11 (18%) | 50 |
0.689 (1.00) |
0.511 (1.00) |
0.504 (1.00) |
| 1q loss | 3 (5%) | 58 |
0.862 (1.00) |
0.134 (1.00) |
1 (1.00) |
| 2p loss | 3 (5%) | 58 |
0.293 (1.00) |
||
| 2q loss | 4 (7%) | 57 |
0.0102 (1.00) |
0.615 (1.00) |
|
| 3p loss | 5 (8%) | 56 |
0.721 (1.00) |
0.763 (1.00) |
0.341 (1.00) |
| 3q loss | 3 (5%) | 58 |
0.628 (1.00) |
0.237 (1.00) |
0.293 (1.00) |
| 4p loss | 9 (15%) | 52 |
0.508 (1.00) |
0.864 (1.00) |
1 (1.00) |
| 4q loss | 15 (25%) | 46 |
0.515 (1.00) |
0.779 (1.00) |
1 (1.00) |
| 5q loss | 4 (7%) | 57 |
0.00925 (1.00) |
0.953 (1.00) |
1 (1.00) |
| 6q loss | 10 (16%) | 51 |
0.258 (1.00) |
0.944 (1.00) |
0.473 (1.00) |
| 7p loss | 5 (8%) | 56 |
0.489 (1.00) |
0.661 (1.00) |
0.0524 (1.00) |
| 7q loss | 7 (11%) | 54 |
0.935 (1.00) |
0.429 (1.00) |
0.24 (1.00) |
| 8p loss | 28 (46%) | 33 |
0.439 (1.00) |
0.262 (1.00) |
0.423 (1.00) |
| 8q loss | 5 (8%) | 56 |
0.582 (1.00) |
0.855 (1.00) |
0.341 (1.00) |
| 9p loss | 15 (25%) | 46 |
0.77 (1.00) |
0.266 (1.00) |
1 (1.00) |
| 9q loss | 13 (21%) | 48 |
0.611 (1.00) |
0.27 (1.00) |
0.753 (1.00) |
| 10p loss | 3 (5%) | 58 |
0.7 (1.00) |
0.0302 (1.00) |
0.547 (1.00) |
| 10q loss | 12 (20%) | 49 |
0.514 (1.00) |
0.588 (1.00) |
0.742 (1.00) |
| 11p loss | 5 (8%) | 56 |
0.691 (1.00) |
0.279 (1.00) |
0.341 (1.00) |
| 11q loss | 8 (13%) | 53 |
0.244 (1.00) |
0.375 (1.00) |
1 (1.00) |
| 12p loss | 3 (5%) | 58 |
0.489 (1.00) |
0.509 (1.00) |
1 (1.00) |
| 13q loss | 22 (36%) | 39 |
0.212 (1.00) |
0.162 (1.00) |
1 (1.00) |
| 14q loss | 21 (34%) | 40 |
0.64 (1.00) |
0.549 (1.00) |
1 (1.00) |
| 15q loss | 7 (11%) | 54 |
0.924 (1.00) |
0.363 (1.00) |
1 (1.00) |
| 16p loss | 11 (18%) | 50 |
0.39 (1.00) |
0.89 (1.00) |
1 (1.00) |
| 16q loss | 19 (31%) | 42 |
0.902 (1.00) |
0.743 (1.00) |
0.571 (1.00) |
| 17p loss | 25 (41%) | 36 |
0.245 (1.00) |
0.372 (1.00) |
0.787 (1.00) |
| 19p loss | 4 (7%) | 57 |
0.23 (1.00) |
0.474 (1.00) |
0.287 (1.00) |
| 21q loss | 9 (15%) | 52 |
0.0736 (1.00) |
0.76 (1.00) |
0.0203 (1.00) |
| 22q loss | 9 (15%) | 52 |
0.624 (1.00) |
0.696 (1.00) |
0.0596 (1.00) |
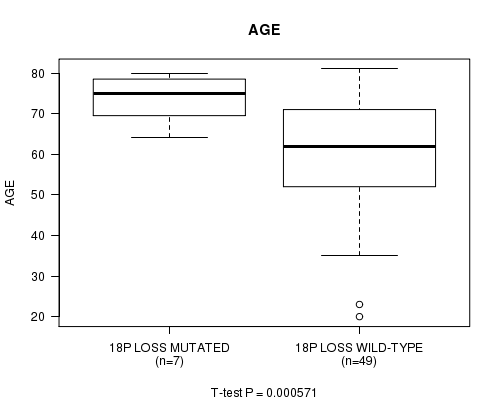
P value = 0.000571 (t-test), Q value = 0.1
Table S1. Gene #57: '18p loss mutation analysis' versus Clinical Feature #2: 'AGE'
| nPatients | Mean (Std.Dev) | |
|---|---|---|
| ALL | 56 | 61.8 (14.0) |
| 18P LOSS MUTATED | 7 | 73.6 (6.4) |
| 18P LOSS WILD-TYPE | 49 | 60.1 (14.0) |
Figure S1. Get High-res Image Gene #57: '18p loss mutation analysis' versus Clinical Feature #2: 'AGE'
P value = 0.00109 (t-test), Q value = 0.19
Table S2. Gene #58: '18q loss mutation analysis' versus Clinical Feature #2: 'AGE'
| nPatients | Mean (Std.Dev) | |
|---|---|---|
| ALL | 56 | 61.8 (14.0) |
| 18Q LOSS MUTATED | 9 | 71.6 (6.9) |
| 18Q LOSS WILD-TYPE | 47 | 60.0 (14.3) |
Figure S2. Get High-res Image Gene #58: '18q loss mutation analysis' versus Clinical Feature #2: 'AGE'

-
Mutation data file = broad_values_by_arm.mutsig.cluster.txt
-
Clinical data file = LIHC-TP.clin.merged.picked.txt
-
Number of patients = 61
-
Number of significantly arm-level cnvs = 61
-
Number of selected clinical features = 3
-
Exclude genes that fewer than K tumors have mutations, K = 3
For survival clinical features, the Kaplan-Meier survival curves of tumors with and without gene mutations were plotted and the statistical significance P values were estimated by logrank test (Bland and Altman 2004) using the 'survdiff' function in R
For continuous numerical clinical features, two-tailed Student's t test with unequal variance (Lehmann and Romano 2005) was applied to compare the clinical values between tumors with and without gene mutations using 't.test' function in R
For binary or multi-class clinical features (nominal or ordinal), two-tailed Fisher's exact tests (Fisher 1922) were used to estimate the P values using the 'fisher.test' function in R
For multiple hypothesis correction, Q value is the False Discovery Rate (FDR) analogue of the P value (Benjamini and Hochberg 1995), defined as the minimum FDR at which the test may be called significant. We used the 'Benjamini and Hochberg' method of 'p.adjust' function in R to convert P values into Q values.
This is an experimental feature. The full results of the analysis summarized in this report can be downloaded from the TCGA Data Coordination Center.