(primary solid tumor cohort)
This pipeline uses various statistical tests to identify mRNAs whose expression levels correlated to selected clinical features.
Testing the association between 18266 genes and 2 clinical features across 117 samples, statistically thresholded by Q value < 0.05, 2 clinical features related to at least one genes.
-
1 gene correlated to 'AGE'.
-
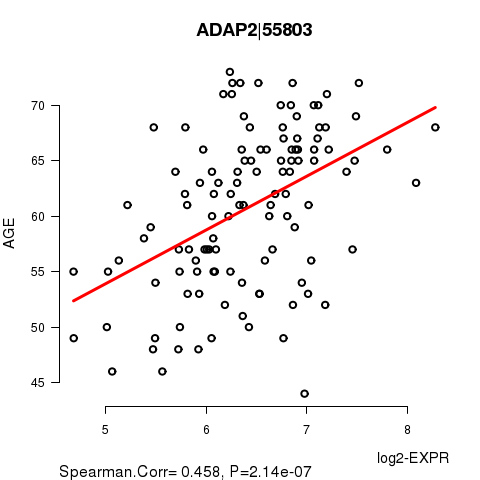
ADAP2|55803
-
25 genes correlated to 'RADIATIONS.RADIATION.REGIMENINDICATION'.
-
C14ORF126|112487 , CEBPZ|10153 , SFRS2|6427 , ABHD11|83451 , CDC40|51362 , ...
Complete statistical result table is provided in Supplement Table 1
Table 1. Get Full Table This table shows the clinical features, statistical methods used, and the number of genes that are significantly associated with each clinical feature at Q value < 0.05.
| Clinical feature | Statistical test | Significant genes | Associated with | Associated with | ||
|---|---|---|---|---|---|---|
| AGE | Spearman correlation test | N=1 | older | N=1 | younger | N=0 |
| RADIATIONS RADIATION REGIMENINDICATION | t test | N=25 | yes | N=6 | no | N=19 |
Table S1. Basic characteristics of clinical feature: 'AGE'
| AGE | Mean (SD) | 60.68 (7.2) |
| Significant markers | N = 1 | |
| pos. correlated | 1 | |
| neg. correlated | 0 |
Table S2. Get Full Table List of one gene significantly correlated to 'AGE' by Spearman correlation test
| SpearmanCorr | corrP | Q | |
|---|---|---|---|
| ADAP2|55803 | 0.4576 | 2.137e-07 | 0.0039 |
Figure S1. Get High-res Image As an example, this figure shows the association of ADAP2|55803 to 'AGE'. P value = 2.14e-07 with Spearman correlation analysis. The straight line presents the best linear regression.
25 genes related to 'RADIATIONS.RADIATION.REGIMENINDICATION'.
Table S3. Basic characteristics of clinical feature: 'RADIATIONS.RADIATION.REGIMENINDICATION'
| RADIATIONS.RADIATION.REGIMENINDICATION | Labels | N |
| NO | 5 | |
| YES | 112 | |
| Significant markers | N = 25 | |
| Higher in YES | 6 | |
| Higher in NO | 19 |
Table S4. Get Full Table List of top 10 genes differentially expressed by 'RADIATIONS.RADIATION.REGIMENINDICATION'
| T(pos if higher in 'YES') | ttestP | Q | AUC | |
|---|---|---|---|---|
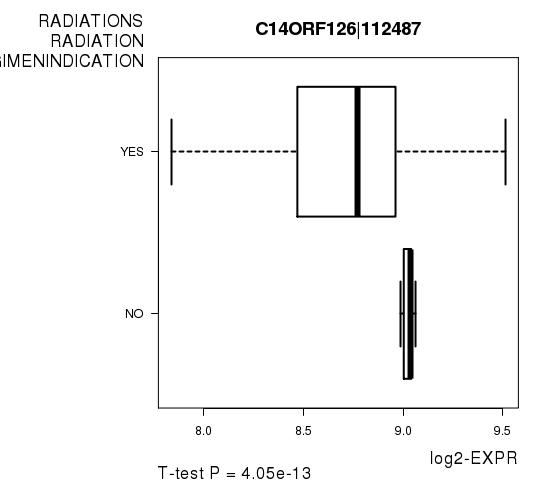
| C14ORF126|112487 | -8.6 | 4.054e-13 | 7.1e-09 | 0.8321 |
| CEBPZ|10153 | -8.3 | 4.183e-12 | 7.32e-08 | 0.8179 |
| SFRS2|6427 | -9.72 | 1.026e-11 | 1.8e-07 | 0.85 |
| ABHD11|83451 | 10.36 | 3.235e-11 | 5.66e-07 | 0.8911 |
| CDC40|51362 | -7.63 | 1.711e-08 | 0.000299 | 0.8161 |
| SFRS13A|10772 | -8.51 | 1.764e-08 | 0.000309 | 0.8536 |
| MCOLN2|255231 | -6.02 | 3.092e-08 | 0.000541 | 0.6839 |
| CLK4|57396 | -9.1 | 3.244e-08 | 0.000567 | 0.8821 |
| ZNF596|169270 | -9.54 | 3.95e-08 | 0.000691 | 0.8964 |
| COL11A2|1302 | -6.43 | 6.235e-08 | 0.00109 | 0.7982 |
Figure S2. Get High-res Image As an example, this figure shows the association of C14ORF126|112487 to 'RADIATIONS.RADIATION.REGIMENINDICATION'. P value = 4.05e-13 with T-test analysis.
-
Expresson data file = PRAD-TP.uncv2.mRNAseq_RSEM_normalized_log2.txt
-
Clinical data file = PRAD-TP.clin.merged.picked.txt
-
Number of patients = 117
-
Number of genes = 18266
-
Number of clinical features = 2
For continuous numerical clinical features, Spearman's rank correlation coefficients (Spearman 1904) and two-tailed P values were estimated using 'cor.test' function in R
For two-class clinical features, two-tailed Student's t test with unequal variance (Lehmann and Romano 2005) was applied to compare the log2-expression levels between the two clinical classes using 't.test' function in R
For multiple hypothesis correction, Q value is the False Discovery Rate (FDR) analogue of the P value (Benjamini and Hochberg 1995), defined as the minimum FDR at which the test may be called significant. We used the 'Benjamini and Hochberg' method of 'p.adjust' function in R to convert P values into Q values.
This is an experimental feature. The full results of the analysis summarized in this report can be downloaded from the TCGA Data Coordination Center.