(primary solid tumor cohort)
This pipeline uses various statistical tests to identify genes whose promoter methylation levels correlated to selected clinical features.
Testing the association between 17323 genes and 2 clinical features across 114 samples, statistically thresholded by Q value < 0.05, 2 clinical features related to at least one genes.
-
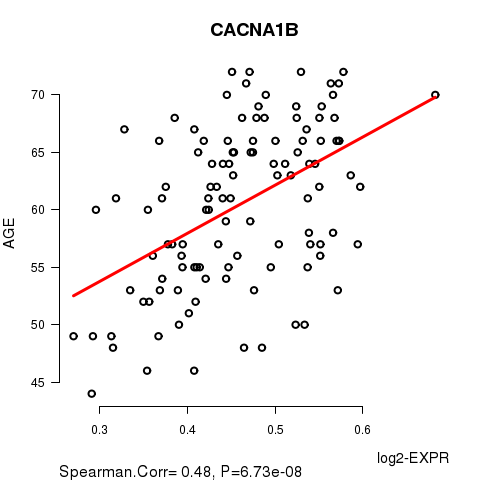
2 genes correlated to 'AGE'.
-
CACNA1B , RASGRF1
-
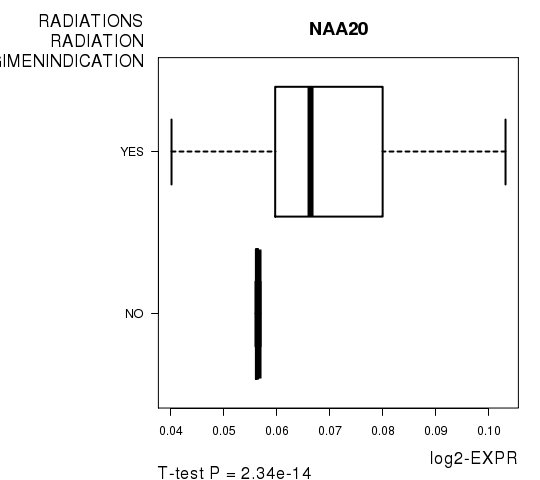
54 genes correlated to 'RADIATIONS.RADIATION.REGIMENINDICATION'.
-
NAA20 , ZNF280D , SCD , HIST1H2BB , ZKSCAN4 , ...
Complete statistical result table is provided in Supplement Table 1
Table 1. Get Full Table This table shows the clinical features, statistical methods used, and the number of genes that are significantly associated with each clinical feature at Q value < 0.05.
| Clinical feature | Statistical test | Significant genes | Associated with | Associated with | ||
|---|---|---|---|---|---|---|
| AGE | Spearman correlation test | N=2 | older | N=2 | younger | N=0 |
| RADIATIONS RADIATION REGIMENINDICATION | t test | N=54 | yes | N=42 | no | N=12 |
Table S1. Basic characteristics of clinical feature: 'AGE'
| AGE | Mean (SD) | 60.44 (7.1) |
| Significant markers | N = 2 | |
| pos. correlated | 2 | |
| neg. correlated | 0 |
Table S2. Get Full Table List of 2 genes significantly correlated to 'AGE' by Spearman correlation test
| SpearmanCorr | corrP | Q | |
|---|---|---|---|
| CACNA1B | 0.4795 | 6.731e-08 | 0.00117 |
| RASGRF1 | 0.4381 | 1.089e-06 | 0.0189 |
Figure S1. Get High-res Image As an example, this figure shows the association of CACNA1B to 'AGE'. P value = 6.73e-08 with Spearman correlation analysis. The straight line presents the best linear regression.
54 genes related to 'RADIATIONS.RADIATION.REGIMENINDICATION'.
Table S3. Basic characteristics of clinical feature: 'RADIATIONS.RADIATION.REGIMENINDICATION'
| RADIATIONS.RADIATION.REGIMENINDICATION | Labels | N |
| NO | 5 | |
| YES | 109 | |
| Significant markers | N = 54 | |
| Higher in YES | 42 | |
| Higher in NO | 12 |
Table S4. Get Full Table List of top 10 genes differentially expressed by 'RADIATIONS.RADIATION.REGIMENINDICATION'
| T(pos if higher in 'YES') | ttestP | Q | AUC | |
|---|---|---|---|---|
| NAA20 | 9.34 | 2.343e-14 | 4.06e-10 | 0.8606 |
| ZNF280D | 9.24 | 1.219e-13 | 2.11e-09 | 0.7963 |
| SCD | -8.93 | 2.37e-12 | 4.1e-08 | 0.8385 |
| HIST1H2BB | 7.7 | 6.301e-12 | 1.09e-07 | 0.7174 |
| ZKSCAN4 | 9.27 | 2.297e-11 | 3.98e-07 | 0.8606 |
| CLEC4C | -7.34 | 6.21e-11 | 1.08e-06 | 0.7596 |
| AASDHPPT | 7.41 | 7.077e-11 | 1.23e-06 | 0.8569 |
| ZNF525 | 9.23 | 1.761e-10 | 3.05e-06 | 0.8826 |
| VWDE | 6.83 | 4.661e-10 | 8.07e-06 | 0.7725 |
| PIK3CA | 6.82 | 7.493e-09 | 0.00013 | 0.7908 |
Figure S2. Get High-res Image As an example, this figure shows the association of NAA20 to 'RADIATIONS.RADIATION.REGIMENINDICATION'. P value = 2.34e-14 with T-test analysis.
-
Expresson data file = PRAD-TP.meth.for_correlation.filtered_data.txt
-
Clinical data file = PRAD-TP.clin.merged.picked.txt
-
Number of patients = 114
-
Number of genes = 17323
-
Number of clinical features = 2
For continuous numerical clinical features, Spearman's rank correlation coefficients (Spearman 1904) and two-tailed P values were estimated using 'cor.test' function in R
For two-class clinical features, two-tailed Student's t test with unequal variance (Lehmann and Romano 2005) was applied to compare the log2-expression levels between the two clinical classes using 't.test' function in R
For multiple hypothesis correction, Q value is the False Discovery Rate (FDR) analogue of the P value (Benjamini and Hochberg 1995), defined as the minimum FDR at which the test may be called significant. We used the 'Benjamini and Hochberg' method of 'p.adjust' function in R to convert P values into Q values.
This is an experimental feature. The full results of the analysis summarized in this report can be downloaded from the TCGA Data Coordination Center.