(primary solid tumor cohort)
This pipeline uses various statistical tests to identify RPPAs whose expression levels correlated to selected clinical features.
Testing the association between 171 genes and 9 clinical features across 130 samples, statistically thresholded by Q value < 0.05, 1 clinical feature related to at least one genes.
-
2 genes correlated to 'HISTOLOGICAL.TYPE'.
-
RAF1|C-RAF-R-V , BCL2L1|BCL-X-R-C
-
No genes correlated to 'Time to Death', 'AGE', 'GENDER', 'PATHOLOGY.T', 'PATHOLOGY.N', 'PATHOLOGICSPREAD(M)', 'TUMOR.STAGE', and 'RADIATIONS.RADIATION.REGIMENINDICATION'.
Complete statistical result table is provided in Supplement Table 1
Table 1. Get Full Table This table shows the clinical features, statistical methods used, and the number of genes that are significantly associated with each clinical feature at Q value < 0.05.
| Clinical feature | Statistical test | Significant genes | Associated with | Associated with | ||
|---|---|---|---|---|---|---|
| Time to Death | Cox regression test | N=0 | ||||
| AGE | Spearman correlation test | N=0 | ||||
| GENDER | t test | N=0 | ||||
| HISTOLOGICAL TYPE | t test | N=2 | rectal mucinous adenocarcinoma | N=1 | rectal adenocarcinoma | N=1 |
| PATHOLOGY T | Spearman correlation test | N=0 | ||||
| PATHOLOGY N | Spearman correlation test | N=0 | ||||
| PATHOLOGICSPREAD(M) | ANOVA test | N=0 | ||||
| TUMOR STAGE | Spearman correlation test | N=0 | ||||
| RADIATIONS RADIATION REGIMENINDICATION | t test | N=0 |
Table S1. Basic characteristics of clinical feature: 'Time to Death'
| Time to Death | Duration (Months) | 0.2-121.1 (median=6.2) |
| censored | N = 91 | |
| death | N = 11 | |
| Significant markers | N = 0 |
Table S2. Basic characteristics of clinical feature: 'AGE'
| AGE | Mean (SD) | 65.55 (12) |
| Significant markers | N = 0 |
Table S3. Basic characteristics of clinical feature: 'GENDER'
| GENDER | Labels | N |
| FEMALE | 60 | |
| MALE | 70 | |
| Significant markers | N = 0 |
Table S4. Basic characteristics of clinical feature: 'HISTOLOGICAL.TYPE'
| HISTOLOGICAL.TYPE | Labels | N |
| RECTAL ADENOCARCINOMA | 117 | |
| RECTAL MUCINOUS ADENOCARCINOMA | 10 | |
| Significant markers | N = 2 | |
| Higher in RECTAL MUCINOUS ADENOCARCINOMA | 1 | |
| Higher in RECTAL ADENOCARCINOMA | 1 |
Table S5. Get Full Table List of 2 genes differentially expressed by 'HISTOLOGICAL.TYPE'
| T(pos if higher in 'RECTAL MUCINOUS ADENOCARCINOMA') | ttestP | Q | AUC | |
|---|---|---|---|---|
| RAF1|C-RAF-R-V | 5.18 | 0.0001255 | 0.0215 | 0.8385 |
| BCL2L1|BCL-X-R-C | -4.9 | 0.0002677 | 0.0455 | 0.8068 |
Figure S1. Get High-res Image As an example, this figure shows the association of RAF1|C-RAF-R-V to 'HISTOLOGICAL.TYPE'. P value = 0.000126 with T-test analysis.
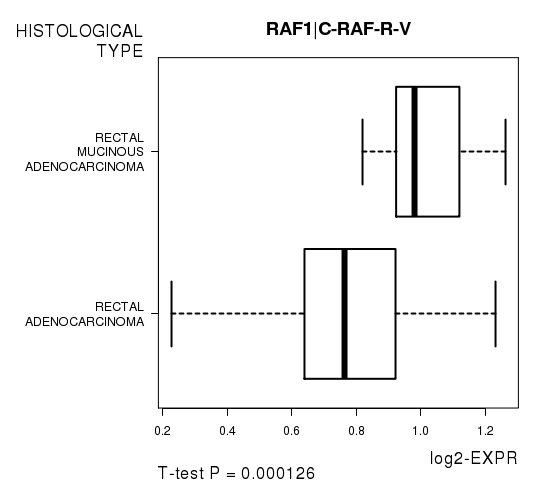
Table S6. Basic characteristics of clinical feature: 'PATHOLOGY.T'
| PATHOLOGY.T | Mean (SD) | 2.82 (0.62) |
| N | ||
| T1 | 5 | |
| T2 | 23 | |
| T3 | 91 | |
| T4 | 10 | |
| Significant markers | N = 0 |
Table S7. Basic characteristics of clinical feature: 'PATHOLOGY.N'
| PATHOLOGY.N | Mean (SD) | 0.7 (0.79) |
| N | ||
| N0 | 64 | |
| N1 | 37 | |
| N2 | 26 | |
| Significant markers | N = 0 |
Table S8. Basic characteristics of clinical feature: 'PATHOLOGICSPREAD(M)'
| PATHOLOGICSPREAD(M) | Labels | N |
| M0 | 98 | |
| M1 | 18 | |
| M1A | 2 | |
| MX | 10 | |
| Significant markers | N = 0 |
Table S9. Basic characteristics of clinical feature: 'TUMOR.STAGE'
| TUMOR.STAGE | Mean (SD) | 2.48 (0.96) |
| N | ||
| Stage 1 | 21 | |
| Stage 2 | 40 | |
| Stage 3 | 42 | |
| Stage 4 | 19 | |
| Significant markers | N = 0 |
No gene related to 'RADIATIONS.RADIATION.REGIMENINDICATION'.
Table S10. Basic characteristics of clinical feature: 'RADIATIONS.RADIATION.REGIMENINDICATION'
| RADIATIONS.RADIATION.REGIMENINDICATION | Labels | N |
| NO | 5 | |
| YES | 125 | |
| Significant markers | N = 0 |
-
Expresson data file = READ-TP.rppa.txt
-
Clinical data file = READ-TP.clin.merged.picked.txt
-
Number of patients = 130
-
Number of genes = 171
-
Number of clinical features = 9
For survival clinical features, Wald's test in univariate Cox regression analysis with proportional hazards model (Andersen and Gill 1982) was used to estimate the P values using the 'coxph' function in R. Kaplan-Meier survival curves were plot using the four quartile subgroups of patients based on expression levels
For continuous numerical clinical features, Spearman's rank correlation coefficients (Spearman 1904) and two-tailed P values were estimated using 'cor.test' function in R
For two-class clinical features, two-tailed Student's t test with unequal variance (Lehmann and Romano 2005) was applied to compare the log2-expression levels between the two clinical classes using 't.test' function in R
For multi-class clinical features (ordinal or nominal), one-way analysis of variance (Howell 2002) was applied to compare the log2-expression levels between different clinical classes using 'anova' function in R
For multiple hypothesis correction, Q value is the False Discovery Rate (FDR) analogue of the P value (Benjamini and Hochberg 1995), defined as the minimum FDR at which the test may be called significant. We used the 'Benjamini and Hochberg' method of 'p.adjust' function in R to convert P values into Q values.
This is an experimental feature. The full results of the analysis summarized in this report can be downloaded from the TCGA Data Coordination Center.