(primary solid tumor cohort)
This pipeline uses various statistical tests to identify mRNAs whose expression levels correlated to selected clinical features.
Testing the association between 17814 genes and 8 clinical features across 69 samples, statistically thresholded by Q value < 0.05, 2 clinical features related to at least one genes.
-
11 genes correlated to 'GENDER'.
-
DDX3Y , RPS4Y1 , RPS4Y2 , EIF1AY , JARID1D , ...
-
12 genes correlated to 'HISTOLOGICAL.TYPE'.
-
TLE6 , FBXO2 , USP42 , AGR3 , CARD6 , ...
-
No genes correlated to 'Time to Death', 'AGE', 'PATHOLOGY.T', 'PATHOLOGY.N', 'PATHOLOGICSPREAD(M)', and 'TUMOR.STAGE'.
Complete statistical result table is provided in Supplement Table 1
Table 1. Get Full Table This table shows the clinical features, statistical methods used, and the number of genes that are significantly associated with each clinical feature at Q value < 0.05.
| Clinical feature | Statistical test | Significant genes | Associated with | Associated with | ||
|---|---|---|---|---|---|---|
| Time to Death | Cox regression test | N=0 | ||||
| AGE | Spearman correlation test | N=0 | ||||
| GENDER | t test | N=11 | male | N=11 | female | N=0 |
| HISTOLOGICAL TYPE | t test | N=12 | rectal mucinous adenocarcinoma | N=6 | rectal adenocarcinoma | N=6 |
| PATHOLOGY T | Spearman correlation test | N=0 | ||||
| PATHOLOGY N | Spearman correlation test | N=0 | ||||
| PATHOLOGICSPREAD(M) | t test | N=0 | ||||
| TUMOR STAGE | Spearman correlation test | N=0 |
Table S1. Basic characteristics of clinical feature: 'Time to Death'
| Time to Death | Duration (Months) | 0.9-52 (median=6) |
| censored | N = 35 | |
| death | N = 4 | |
| Significant markers | N = 0 |
Table S2. Basic characteristics of clinical feature: 'AGE'
| AGE | Mean (SD) | 66.62 (11) |
| Significant markers | N = 0 |
Table S3. Basic characteristics of clinical feature: 'GENDER'
| GENDER | Labels | N |
| FEMALE | 31 | |
| MALE | 38 | |
| Significant markers | N = 11 | |
| Higher in MALE | 11 | |
| Higher in FEMALE | 0 |
Table S4. Get Full Table List of top 10 genes differentially expressed by 'GENDER'
| T(pos if higher in 'MALE') | ttestP | Q | AUC | |
|---|---|---|---|---|
| DDX3Y | 12.58 | 3.494e-19 | 6.22e-15 | 0.9652 |
| RPS4Y1 | 11.98 | 2.93e-17 | 5.22e-13 | 0.9244 |
| RPS4Y2 | 11.51 | 1.822e-16 | 3.24e-12 | 0.9669 |
| EIF1AY | 10.97 | 2.286e-16 | 4.07e-12 | 0.9593 |
| JARID1D | 10.54 | 8.569e-16 | 1.53e-11 | 0.9491 |
| CYORF15A | 10.03 | 1.685e-14 | 3e-10 | 0.9491 |
| UTY | 7.97 | 4.7e-11 | 8.37e-07 | 0.9177 |
| CYORF15B | 7.8 | 7.005e-11 | 1.25e-06 | 0.9032 |
| ZFY | 7.67 | 1.14e-10 | 2.03e-06 | 0.8964 |
| TTTY14 | 5.84 | 1.885e-07 | 0.00336 | 0.8973 |
Figure S1. Get High-res Image As an example, this figure shows the association of DDX3Y to 'GENDER'. P value = 3.49e-19 with T-test analysis.
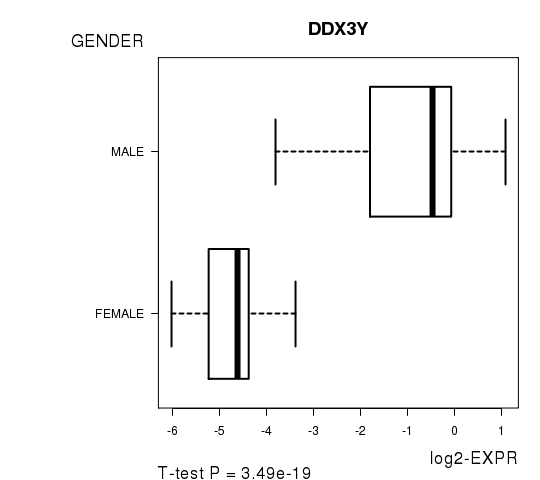
Table S5. Basic characteristics of clinical feature: 'HISTOLOGICAL.TYPE'
| HISTOLOGICAL.TYPE | Labels | N |
| RECTAL ADENOCARCINOMA | 58 | |
| RECTAL MUCINOUS ADENOCARCINOMA | 7 | |
| Significant markers | N = 12 | |
| Higher in RECTAL MUCINOUS ADENOCARCINOMA | 6 | |
| Higher in RECTAL ADENOCARCINOMA | 6 |
Table S6. Get Full Table List of top 10 genes differentially expressed by 'HISTOLOGICAL.TYPE'
| T(pos if higher in 'RECTAL MUCINOUS ADENOCARCINOMA') | ttestP | Q | AUC | |
|---|---|---|---|---|
| TLE6 | 11.58 | 2.77e-13 | 4.93e-09 | 0.9828 |
| FBXO2 | -7.64 | 2.189e-10 | 3.9e-06 | 0.867 |
| USP42 | -6.71 | 2.684e-08 | 0.000478 | 0.867 |
| AGR3 | 6.79 | 8.791e-08 | 0.00157 | 0.8768 |
| CARD6 | 6.15 | 1.932e-07 | 0.00344 | 0.8448 |
| LOC643641 | -6.6 | 4.407e-07 | 0.00785 | 0.8547 |
| MECR | -5.75 | 4.437e-07 | 0.0079 | 0.7734 |
| RAB27B | 6.36 | 4.44e-07 | 0.00791 | 0.8645 |
| TTLL7 | 7.44 | 7.9e-07 | 0.0141 | 0.936 |
| PLCB2 | 6.6 | 9.349e-07 | 0.0166 | 0.8966 |
Figure S2. Get High-res Image As an example, this figure shows the association of TLE6 to 'HISTOLOGICAL.TYPE'. P value = 2.77e-13 with T-test analysis.
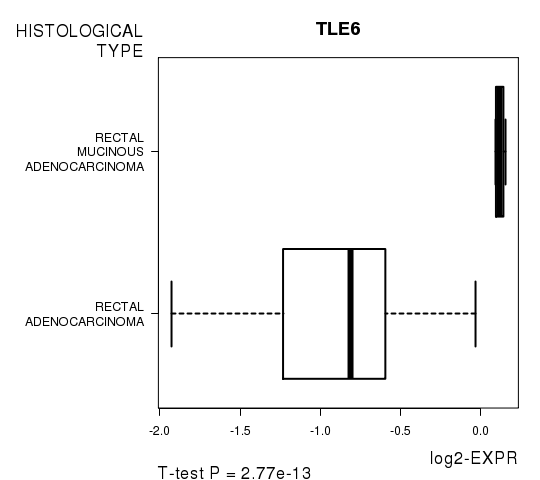
Table S7. Basic characteristics of clinical feature: 'PATHOLOGY.T'
| PATHOLOGY.T | Mean (SD) | 2.7 (0.69) |
| N | ||
| T1 | 5 | |
| T2 | 15 | |
| T3 | 45 | |
| T4 | 4 | |
| Significant markers | N = 0 |
Table S8. Basic characteristics of clinical feature: 'PATHOLOGY.N'
| PATHOLOGY.N | Mean (SD) | 0.57 (0.78) |
| N | ||
| N0 | 42 | |
| N1 | 15 | |
| N2 | 12 | |
| Significant markers | N = 0 |
Table S9. Basic characteristics of clinical feature: 'PATHOLOGICSPREAD(M)'
| PATHOLOGICSPREAD(M) | Labels | N |
| M0 | 57 | |
| M1 | 12 | |
| Significant markers | N = 0 |
-
Expresson data file = READ-TP.medianexp.txt
-
Clinical data file = READ-TP.clin.merged.picked.txt
-
Number of patients = 69
-
Number of genes = 17814
-
Number of clinical features = 8
For survival clinical features, Wald's test in univariate Cox regression analysis with proportional hazards model (Andersen and Gill 1982) was used to estimate the P values using the 'coxph' function in R. Kaplan-Meier survival curves were plot using the four quartile subgroups of patients based on expression levels
For continuous numerical clinical features, Spearman's rank correlation coefficients (Spearman 1904) and two-tailed P values were estimated using 'cor.test' function in R
For two-class clinical features, two-tailed Student's t test with unequal variance (Lehmann and Romano 2005) was applied to compare the log2-expression levels between the two clinical classes using 't.test' function in R
For multiple hypothesis correction, Q value is the False Discovery Rate (FDR) analogue of the P value (Benjamini and Hochberg 1995), defined as the minimum FDR at which the test may be called significant. We used the 'Benjamini and Hochberg' method of 'p.adjust' function in R to convert P values into Q values.
This is an experimental feature. The full results of the analysis summarized in this report can be downloaded from the TCGA Data Coordination Center.