(primary solid tumor cohort)
This pipeline computes the correlation between significant arm-level copy number variations (cnvs) and selected clinical features.
Testing the association between copy number variation 74 arm-level results and 9 clinical features across 161 patients, 6 significant findings detected with Q value < 0.25.
-
20p gain cnv correlated to 'GENDER'.
-
20q gain cnv correlated to 'GENDER'.
-
1p loss cnv correlated to 'PATHOLOGICSPREAD(M)' and 'TUMOR.STAGE'.
-
12p loss cnv correlated to 'PATHOLOGY.N' and 'TUMOR.STAGE'.
Table 1. Get Full Table Overview of the association between significant copy number variation of 74 arm-level results and 9 clinical features. Shown in the table are P values (Q values). Thresholded by Q value < 0.25, 6 significant findings detected.
|
Clinical Features |
Time to Death |
AGE | GENDER |
HISTOLOGICAL TYPE |
PATHOLOGY T |
PATHOLOGY N |
PATHOLOGICSPREAD(M) |
TUMOR STAGE |
RADIATIONS RADIATION REGIMENINDICATION |
||
| nCNV (%) | nWild-Type | logrank test | t-test | Fisher's exact test | Chi-square test | Fisher's exact test | Fisher's exact test | Fisher's exact test | Fisher's exact test | Fisher's exact test | |
| 1p loss | 6 (4%) | 155 |
0.00489 (1.00) |
0.688 (1.00) |
0.222 (1.00) |
0.885 (1.00) |
0.335 (1.00) |
0.313 (1.00) |
0.000111 (0.0726) |
0.000345 (0.224) |
1 (1.00) |
| 12p loss | 11 (7%) | 150 |
0.174 (1.00) |
0.705 (1.00) |
0.527 (1.00) |
0.361 (1.00) |
0.0564 (1.00) |
0.000243 (0.158) |
0.46 (1.00) |
0.000228 (0.148) |
0.301 (1.00) |
| 20p gain | 61 (38%) | 100 |
0.0693 (1.00) |
0.207 (1.00) |
0.000128 (0.0831) |
0.685 (1.00) |
0.0515 (1.00) |
0.691 (1.00) |
0.149 (1.00) |
0.19 (1.00) |
0.651 (1.00) |
| 20q gain | 75 (47%) | 86 |
0.0524 (1.00) |
0.134 (1.00) |
0.00037 (0.24) |
0.399 (1.00) |
0.000745 (0.481) |
0.264 (1.00) |
0.0532 (1.00) |
0.189 (1.00) |
0.665 (1.00) |
| 1p gain | 6 (4%) | 155 |
0.212 (1.00) |
0.403 (1.00) |
0.712 (1.00) |
1 (1.00) |
0.809 (1.00) |
0.45 (1.00) |
1 (1.00) |
1 (1.00) |
|
| 1q gain | 19 (12%) | 142 |
0.77 (1.00) |
0.521 (1.00) |
0.22 (1.00) |
0.3 (1.00) |
0.422 (1.00) |
0.214 (1.00) |
0.384 (1.00) |
0.335 (1.00) |
0.106 (1.00) |
| 2p gain | 10 (6%) | 151 |
0.692 (1.00) |
0.292 (1.00) |
0.741 (1.00) |
0.586 (1.00) |
0.272 (1.00) |
0.291 (1.00) |
1 (1.00) |
0.0578 (1.00) |
1 (1.00) |
| 2q gain | 11 (7%) | 150 |
0.406 (1.00) |
0.588 (1.00) |
0.527 (1.00) |
0.605 (1.00) |
0.532 (1.00) |
0.291 (1.00) |
0.831 (1.00) |
0.213 (1.00) |
1 (1.00) |
| 3p gain | 4 (2%) | 157 |
0.543 (1.00) |
0.648 (1.00) |
0.862 (1.00) |
0.856 (1.00) |
0.394 (1.00) |
1 (1.00) |
0.529 (1.00) |
1 (1.00) |
|
| 3q gain | 13 (8%) | 148 |
0.377 (1.00) |
0.0273 (1.00) |
0.0157 (1.00) |
0.484 (1.00) |
1 (1.00) |
0.767 (1.00) |
0.503 (1.00) |
1 (1.00) |
1 (1.00) |
| 4p gain | 3 (2%) | 158 |
0.159 (1.00) |
0.273 (1.00) |
0.0522 (1.00) |
0.729 (1.00) |
1 (1.00) |
0.284 (1.00) |
1 (1.00) |
||
| 5p gain | 26 (16%) | 135 |
0.975 (1.00) |
0.763 (1.00) |
0.19 (1.00) |
0.494 (1.00) |
0.935 (1.00) |
0.681 (1.00) |
0.253 (1.00) |
0.108 (1.00) |
0.184 (1.00) |
| 5q gain | 6 (4%) | 155 |
0.137 (1.00) |
0.792 (1.00) |
0.403 (1.00) |
0.0419 (1.00) |
0.901 (1.00) |
0.877 (1.00) |
1 (1.00) |
0.594 (1.00) |
1 (1.00) |
| 6p gain | 11 (7%) | 150 |
0.788 (1.00) |
0.838 (1.00) |
0.758 (1.00) |
0.799 (1.00) |
0.243 (1.00) |
0.727 (1.00) |
1 (1.00) |
0.453 (1.00) |
1 (1.00) |
| 6q gain | 10 (6%) | 151 |
0.35 (1.00) |
0.891 (1.00) |
1 (1.00) |
0.78 (1.00) |
0.354 (1.00) |
0.746 (1.00) |
0.661 (1.00) |
0.719 (1.00) |
1 (1.00) |
| 7p gain | 49 (30%) | 112 |
0.524 (1.00) |
0.0136 (1.00) |
0.117 (1.00) |
0.319 (1.00) |
0.464 (1.00) |
0.556 (1.00) |
0.673 (1.00) |
0.181 (1.00) |
0.641 (1.00) |
| 7q gain | 44 (27%) | 117 |
0.735 (1.00) |
0.00432 (1.00) |
0.37 (1.00) |
0.446 (1.00) |
0.204 (1.00) |
0.643 (1.00) |
0.255 (1.00) |
0.157 (1.00) |
1 (1.00) |
| 8p gain | 50 (31%) | 111 |
0.599 (1.00) |
0.0443 (1.00) |
0.386 (1.00) |
0.487 (1.00) |
0.0857 (1.00) |
0.585 (1.00) |
0.0932 (1.00) |
0.59 (1.00) |
0.174 (1.00) |
| 8q gain | 68 (42%) | 93 |
0.302 (1.00) |
0.03 (1.00) |
0.421 (1.00) |
0.635 (1.00) |
0.0122 (1.00) |
0.191 (1.00) |
0.153 (1.00) |
0.258 (1.00) |
0.651 (1.00) |
| 9p gain | 11 (7%) | 150 |
0.844 (1.00) |
0.319 (1.00) |
0.353 (1.00) |
0.708 (1.00) |
0.051 (1.00) |
0.127 (1.00) |
1 (1.00) |
0.00597 (1.00) |
0.301 (1.00) |
| 9q gain | 15 (9%) | 146 |
0.856 (1.00) |
0.188 (1.00) |
0.595 (1.00) |
0.942 (1.00) |
0.144 (1.00) |
0.134 (1.00) |
0.871 (1.00) |
0.161 (1.00) |
0.391 (1.00) |
| 10p gain | 23 (14%) | 138 |
0.976 (1.00) |
0.34 (1.00) |
0.362 (1.00) |
0.315 (1.00) |
0.537 (1.00) |
0.752 (1.00) |
0.41 (1.00) |
0.071 (1.00) |
1 (1.00) |
| 10q gain | 10 (6%) | 151 |
0.634 (1.00) |
0.987 (1.00) |
0.741 (1.00) |
0.646 (1.00) |
0.894 (1.00) |
0.746 (1.00) |
0.812 (1.00) |
0.696 (1.00) |
1 (1.00) |
| 11p gain | 4 (2%) | 157 |
0.572 (1.00) |
0.648 (1.00) |
0.676 (1.00) |
0.385 (1.00) |
0.183 (1.00) |
1 (1.00) |
0.335 (1.00) |
1 (1.00) |
|
| 11q gain | 8 (5%) | 153 |
0.24 (1.00) |
0.77 (1.00) |
1 (1.00) |
0.802 (1.00) |
0.864 (1.00) |
0.743 (1.00) |
0.774 (1.00) |
0.709 (1.00) |
1 (1.00) |
| 12p gain | 15 (9%) | 146 |
0.726 (1.00) |
0.273 (1.00) |
0.105 (1.00) |
0.998 (1.00) |
0.374 (1.00) |
0.655 (1.00) |
0.163 (1.00) |
0.676 (1.00) |
1 (1.00) |
| 12q gain | 10 (6%) | 151 |
0.669 (1.00) |
0.0563 (1.00) |
0.741 (1.00) |
0.309 (1.00) |
0.894 (1.00) |
0.152 (1.00) |
0.812 (1.00) |
0.61 (1.00) |
0.277 (1.00) |
| 13q gain | 30 (19%) | 131 |
0.331 (1.00) |
0.731 (1.00) |
0.222 (1.00) |
0.501 (1.00) |
0.676 (1.00) |
0.474 (1.00) |
0.617 (1.00) |
0.69 (1.00) |
1 (1.00) |
| 15q gain | 7 (4%) | 154 |
0.178 (1.00) |
0.414 (1.00) |
0.243 (1.00) |
0.364 (1.00) |
0.569 (1.00) |
0.0674 (1.00) |
1 (1.00) |
0.439 (1.00) |
1 (1.00) |
| 16p gain | 12 (7%) | 149 |
0.575 (1.00) |
0.614 (1.00) |
0.763 (1.00) |
0.61 (1.00) |
0.341 (1.00) |
0.0675 (1.00) |
0.118 (1.00) |
0.00787 (1.00) |
0.325 (1.00) |
| 16q gain | 8 (5%) | 153 |
0.671 (1.00) |
0.864 (1.00) |
1 (1.00) |
0.862 (1.00) |
0.0719 (1.00) |
0.354 (1.00) |
0.195 (1.00) |
0.0167 (1.00) |
1 (1.00) |
| 17p gain | 6 (4%) | 155 |
0.16 (1.00) |
0.55 (1.00) |
1 (1.00) |
0.805 (1.00) |
0.812 (1.00) |
0.0818 (1.00) |
0.0268 (1.00) |
0.142 (1.00) |
1 (1.00) |
| 17q gain | 9 (6%) | 152 |
0.174 (1.00) |
0.666 (1.00) |
0.741 (1.00) |
0.879 (1.00) |
0.829 (1.00) |
0.118 (1.00) |
0.0225 (1.00) |
0.197 (1.00) |
1 (1.00) |
| 18p gain | 13 (8%) | 148 |
0.61 (1.00) |
0.564 (1.00) |
1 (1.00) |
0.813 (1.00) |
1 (1.00) |
0.0956 (1.00) |
0.614 (1.00) |
0.632 (1.00) |
0.347 (1.00) |
| 18q gain | 7 (4%) | 154 |
0.598 (1.00) |
0.619 (1.00) |
0.441 (1.00) |
0.313 (1.00) |
0.563 (1.00) |
0.777 (1.00) |
0.146 (1.00) |
0.89 (1.00) |
1 (1.00) |
| 19p gain | 10 (6%) | 151 |
0.965 (1.00) |
0.429 (1.00) |
0.0155 (1.00) |
0.536 (1.00) |
0.806 (1.00) |
0.0475 (1.00) |
0.043 (1.00) |
0.0455 (1.00) |
1 (1.00) |
| 19q gain | 17 (11%) | 144 |
0.309 (1.00) |
0.214 (1.00) |
0.121 (1.00) |
0.509 (1.00) |
0.404 (1.00) |
0.105 (1.00) |
0.219 (1.00) |
0.0247 (1.00) |
0.432 (1.00) |
| 22q gain | 3 (2%) | 158 |
0.765 (1.00) |
0.266 (1.00) |
1 (1.00) |
0.927 (1.00) |
0.817 (1.00) |
0.382 (1.00) |
1 (1.00) |
0.284 (1.00) |
1 (1.00) |
| 2p loss | 3 (2%) | 158 |
0.566 (1.00) |
0.817 (1.00) |
0.437 (1.00) |
0.223 (1.00) |
0.336 (1.00) |
0.0909 (1.00) |
|||
| 2q loss | 4 (2%) | 157 |
0.867 (1.00) |
1 (1.00) |
0.308 (1.00) |
0.614 (1.00) |
0.0917 (1.00) |
0.149 (1.00) |
0.16 (1.00) |
0.12 (1.00) |
|
| 3p loss | 10 (6%) | 151 |
0.633 (1.00) |
0.561 (1.00) |
1 (1.00) |
0.865 (1.00) |
0.729 (1.00) |
0.746 (1.00) |
1 (1.00) |
0.677 (1.00) |
1 (1.00) |
| 3q loss | 6 (4%) | 155 |
0.727 (1.00) |
0.639 (1.00) |
0.403 (1.00) |
0.852 (1.00) |
1 (1.00) |
0.877 (1.00) |
1 (1.00) |
0.734 (1.00) |
1 (1.00) |
| 4p loss | 24 (15%) | 137 |
0.704 (1.00) |
0.129 (1.00) |
0.824 (1.00) |
0.0812 (1.00) |
0.0367 (1.00) |
1 (1.00) |
0.565 (1.00) |
0.0682 (1.00) |
0.161 (1.00) |
| 4q loss | 20 (12%) | 141 |
0.748 (1.00) |
0.338 (1.00) |
0.466 (1.00) |
0.0279 (1.00) |
0.0243 (1.00) |
0.837 (1.00) |
1 (1.00) |
0.301 (1.00) |
0.117 (1.00) |
| 5p loss | 7 (4%) | 154 |
0.415 (1.00) |
0.607 (1.00) |
1 (1.00) |
0.022 (1.00) |
0.614 (1.00) |
0.375 (1.00) |
1 (1.00) |
0.397 (1.00) |
1 (1.00) |
| 5q loss | 15 (9%) | 146 |
0.12 (1.00) |
0.5 (1.00) |
0.286 (1.00) |
0.000403 (0.26) |
0.0522 (1.00) |
0.903 (1.00) |
0.242 (1.00) |
0.181 (1.00) |
0.391 (1.00) |
| 6p loss | 8 (5%) | 153 |
0.958 (1.00) |
0.0474 (1.00) |
0.715 (1.00) |
0.0136 (1.00) |
0.134 (1.00) |
0.166 (1.00) |
0.578 (1.00) |
0.229 (1.00) |
1 (1.00) |
| 6q loss | 12 (7%) | 149 |
0.611 (1.00) |
0.218 (1.00) |
0.763 (1.00) |
0.191 (1.00) |
0.202 (1.00) |
0.428 (1.00) |
0.85 (1.00) |
0.0368 (1.00) |
1 (1.00) |
| 7p loss | 3 (2%) | 158 |
0.213 (1.00) |
0.192 (1.00) |
0.273 (1.00) |
0.721 (1.00) |
0.0916 (1.00) |
0.0806 (1.00) |
1 (1.00) |
0.456 (1.00) |
1 (1.00) |
| 7q loss | 5 (3%) | 156 |
0.208 (1.00) |
0.14 (1.00) |
0.0819 (1.00) |
0.454 (1.00) |
0.379 (1.00) |
0.477 (1.00) |
1 (1.00) |
0.929 (1.00) |
1 (1.00) |
| 8p loss | 10 (6%) | 151 |
0.27 (1.00) |
0.439 (1.00) |
0.741 (1.00) |
0.0385 (1.00) |
0.592 (1.00) |
0.4 (1.00) |
0.812 (1.00) |
0.625 (1.00) |
1 (1.00) |
| 8q loss | 3 (2%) | 158 |
0.607 (1.00) |
1 (1.00) |
0.00448 (1.00) |
1 (1.00) |
1 (1.00) |
||||
| 9p loss | 26 (16%) | 135 |
0.0551 (1.00) |
0.513 (1.00) |
0.663 (1.00) |
0.414 (1.00) |
0.0526 (1.00) |
0.357 (1.00) |
1 (1.00) |
0.625 (1.00) |
0.591 (1.00) |
| 9q loss | 11 (7%) | 150 |
0.199 (1.00) |
0.368 (1.00) |
1 (1.00) |
0.675 (1.00) |
0.187 (1.00) |
0.212 (1.00) |
0.831 (1.00) |
0.968 (1.00) |
0.301 (1.00) |
| 10p loss | 10 (6%) | 151 |
0.203 (1.00) |
0.355 (1.00) |
0.318 (1.00) |
0.0191 (1.00) |
0.0663 (1.00) |
0.452 (1.00) |
0.661 (1.00) |
0.342 (1.00) |
0.0315 (1.00) |
| 10q loss | 9 (6%) | 152 |
0.263 (1.00) |
0.676 (1.00) |
0.741 (1.00) |
0.0248 (1.00) |
0.302 (1.00) |
0.652 (1.00) |
0.792 (1.00) |
0.25 (1.00) |
0.253 (1.00) |
| 11p loss | 12 (7%) | 149 |
0.347 (1.00) |
0.237 (1.00) |
0.548 (1.00) |
0.297 (1.00) |
0.168 (1.00) |
0.834 (1.00) |
0.0806 (1.00) |
0.489 (1.00) |
1 (1.00) |
| 11q loss | 9 (6%) | 152 |
0.356 (1.00) |
0.466 (1.00) |
0.315 (1.00) |
0.469 (1.00) |
0.24 (1.00) |
0.713 (1.00) |
0.36 (1.00) |
0.506 (1.00) |
1 (1.00) |
| 12q loss | 6 (4%) | 155 |
0.335 (1.00) |
0.21 (1.00) |
0.0819 (1.00) |
0.705 (1.00) |
0.191 (1.00) |
0.0333 (1.00) |
1 (1.00) |
0.0852 (1.00) |
1 (1.00) |
| 13q loss | 5 (3%) | 156 |
0.866 (1.00) |
1 (1.00) |
0.325 (1.00) |
0.702 (1.00) |
0.356 (1.00) |
0.635 (1.00) |
0.577 (1.00) |
0.148 (1.00) |
|
| 14q loss | 10 (6%) | 151 |
0.208 (1.00) |
0.0776 (1.00) |
1 (1.00) |
0.905 (1.00) |
0.879 (1.00) |
0.519 (1.00) |
0.416 (1.00) |
0.816 (1.00) |
1 (1.00) |
| 15q loss | 10 (6%) | 151 |
0.58 (1.00) |
0.328 (1.00) |
1 (1.00) |
0.117 (1.00) |
0.109 (1.00) |
0.427 (1.00) |
0.812 (1.00) |
0.641 (1.00) |
0.0315 (1.00) |
| 16p loss | 9 (6%) | 152 |
0.606 (1.00) |
0.396 (1.00) |
0.0853 (1.00) |
0.386 (1.00) |
0.192 (1.00) |
0.81 (1.00) |
1 (1.00) |
0.862 (1.00) |
1 (1.00) |
| 16q loss | 14 (9%) | 147 |
0.539 (1.00) |
0.941 (1.00) |
0.406 (1.00) |
0.464 (1.00) |
0.124 (1.00) |
0.264 (1.00) |
1 (1.00) |
0.849 (1.00) |
0.369 (1.00) |
| 17p loss | 32 (20%) | 129 |
0.463 (1.00) |
0.351 (1.00) |
0.547 (1.00) |
0.022 (1.00) |
0.0683 (1.00) |
0.286 (1.00) |
0.927 (1.00) |
0.436 (1.00) |
0.0541 (1.00) |
| 17q loss | 9 (6%) | 152 |
0.858 (1.00) |
0.667 (1.00) |
0.487 (1.00) |
0.0316 (1.00) |
0.936 (1.00) |
0.368 (1.00) |
0.247 (1.00) |
0.407 (1.00) |
0.253 (1.00) |
| 18p loss | 12 (7%) | 149 |
0.278 (1.00) |
0.872 (1.00) |
1 (1.00) |
0.952 (1.00) |
0.553 (1.00) |
0.362 (1.00) |
0.587 (1.00) |
0.38 (1.00) |
1 (1.00) |
| 18q loss | 24 (15%) | 137 |
0.213 (1.00) |
0.46 (1.00) |
0.505 (1.00) |
0.836 (1.00) |
0.579 (1.00) |
0.224 (1.00) |
0.249 (1.00) |
0.438 (1.00) |
1 (1.00) |
| 19p loss | 16 (10%) | 145 |
0.671 (1.00) |
0.905 (1.00) |
0.283 (1.00) |
0.544 (1.00) |
0.54 (1.00) |
0.284 (1.00) |
0.759 (1.00) |
0.511 (1.00) |
1 (1.00) |
| 19q loss | 12 (7%) | 149 |
0.879 (1.00) |
0.182 (1.00) |
0.364 (1.00) |
0.559 (1.00) |
0.421 (1.00) |
0.233 (1.00) |
0.702 (1.00) |
0.141 (1.00) |
1 (1.00) |
| 20p loss | 4 (2%) | 157 |
0.286 (1.00) |
0.873 (1.00) |
0.304 (1.00) |
0.862 (1.00) |
0.253 (1.00) |
0.726 (1.00) |
0.0855 (1.00) |
0.307 (1.00) |
1 (1.00) |
| 21q loss | 29 (18%) | 132 |
0.996 (1.00) |
0.668 (1.00) |
1 (1.00) |
0.647 (1.00) |
0.413 (1.00) |
0.977 (1.00) |
0.852 (1.00) |
0.691 (1.00) |
1 (1.00) |
| 22q loss | 22 (14%) | 139 |
0.655 (1.00) |
0.465 (1.00) |
1 (1.00) |
0.208 (1.00) |
0.67 (1.00) |
0.694 (1.00) |
0.731 (1.00) |
0.551 (1.00) |
0.525 (1.00) |
| Xq loss | 7 (4%) | 154 |
0.139 (1.00) |
0.289 (1.00) |
0.702 (1.00) |
0.207 (1.00) |
0.0874 (1.00) |
0.374 (1.00) |
1 (1.00) |
0.166 (1.00) |
0.202 (1.00) |
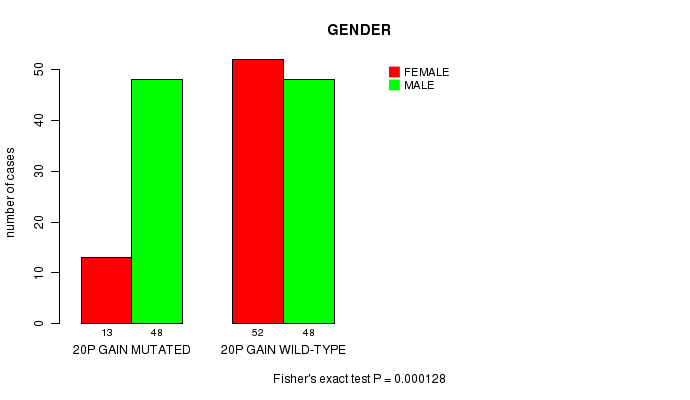
P value = 0.000128 (Fisher's exact test), Q value = 0.083
Table S1. Gene #34: '20p gain mutation analysis' versus Clinical Feature #3: 'GENDER'
| nPatients | FEMALE | MALE |
|---|---|---|
| ALL | 65 | 96 |
| 20P GAIN MUTATED | 13 | 48 |
| 20P GAIN WILD-TYPE | 52 | 48 |
Figure S1. Get High-res Image Gene #34: '20p gain mutation analysis' versus Clinical Feature #3: 'GENDER'
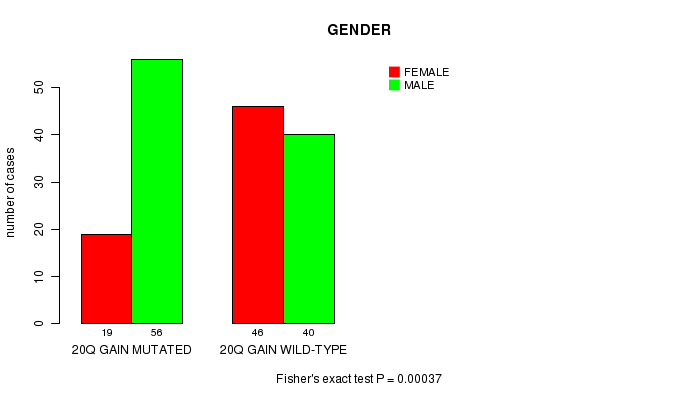
P value = 0.00037 (Fisher's exact test), Q value = 0.24
Table S2. Gene #35: '20q gain mutation analysis' versus Clinical Feature #3: 'GENDER'
| nPatients | FEMALE | MALE |
|---|---|---|
| ALL | 65 | 96 |
| 20Q GAIN MUTATED | 19 | 56 |
| 20Q GAIN WILD-TYPE | 46 | 40 |
Figure S2. Get High-res Image Gene #35: '20q gain mutation analysis' versus Clinical Feature #3: 'GENDER'
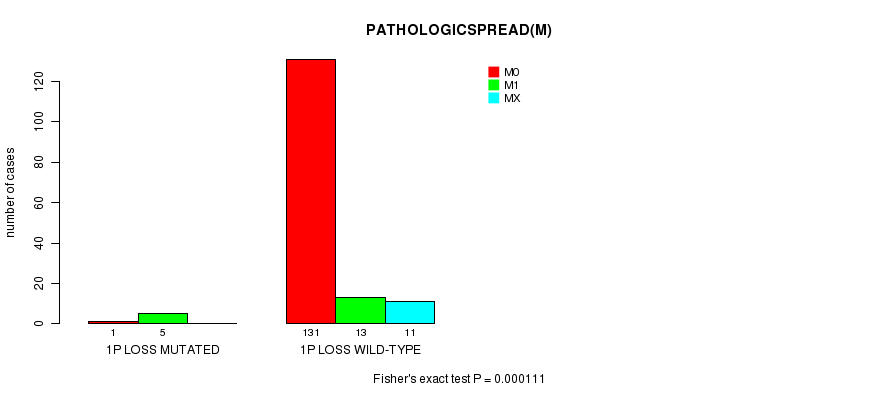
P value = 0.000111 (Fisher's exact test), Q value = 0.073
Table S3. Gene #37: '1p loss mutation analysis' versus Clinical Feature #7: 'PATHOLOGICSPREAD(M)'
| nPatients | M0 | M1 | MX |
|---|---|---|---|
| ALL | 132 | 18 | 11 |
| 1P LOSS MUTATED | 1 | 5 | 0 |
| 1P LOSS WILD-TYPE | 131 | 13 | 11 |
Figure S3. Get High-res Image Gene #37: '1p loss mutation analysis' versus Clinical Feature #7: 'PATHOLOGICSPREAD(M)'
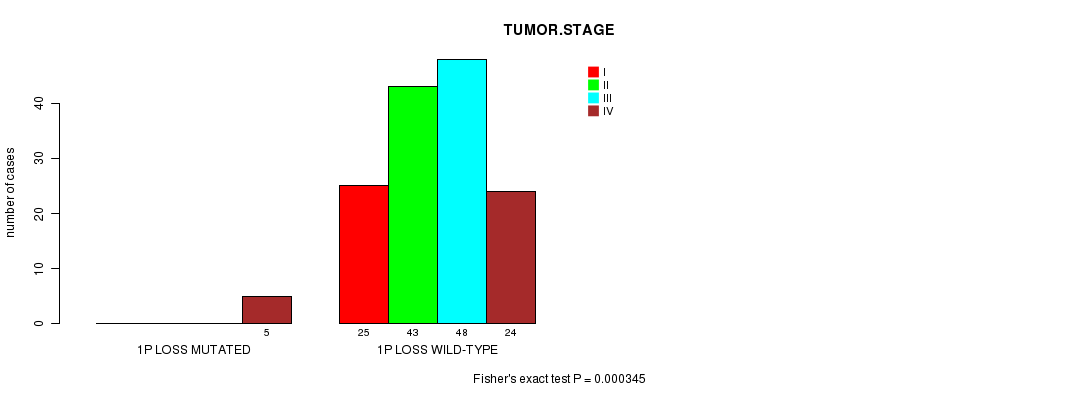
P value = 0.000345 (Fisher's exact test), Q value = 0.22
Table S4. Gene #37: '1p loss mutation analysis' versus Clinical Feature #8: 'TUMOR.STAGE'
| nPatients | I | II | III | IV |
|---|---|---|---|---|
| ALL | 25 | 43 | 48 | 29 |
| 1P LOSS MUTATED | 0 | 0 | 0 | 5 |
| 1P LOSS WILD-TYPE | 25 | 43 | 48 | 24 |
Figure S4. Get High-res Image Gene #37: '1p loss mutation analysis' versus Clinical Feature #8: 'TUMOR.STAGE'
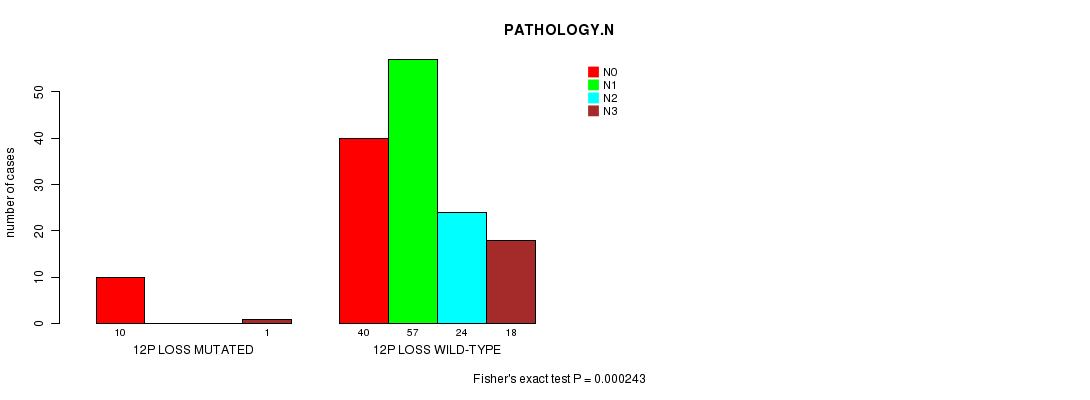
P value = 0.000243 (Fisher's exact test), Q value = 0.16
Table S5. Gene #58: '12p loss mutation analysis' versus Clinical Feature #6: 'PATHOLOGY.N'
| nPatients | N0 | N1 | N2 | N3 |
|---|---|---|---|---|
| ALL | 50 | 57 | 24 | 19 |
| 12P LOSS MUTATED | 10 | 0 | 0 | 1 |
| 12P LOSS WILD-TYPE | 40 | 57 | 24 | 18 |
Figure S5. Get High-res Image Gene #58: '12p loss mutation analysis' versus Clinical Feature #6: 'PATHOLOGY.N'
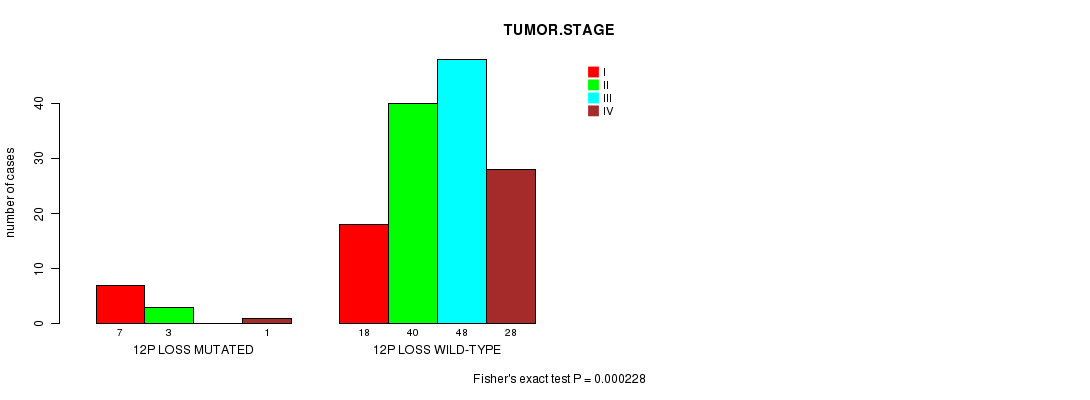
P value = 0.000228 (Fisher's exact test), Q value = 0.15
Table S6. Gene #58: '12p loss mutation analysis' versus Clinical Feature #8: 'TUMOR.STAGE'
| nPatients | I | II | III | IV |
|---|---|---|---|---|
| ALL | 25 | 43 | 48 | 29 |
| 12P LOSS MUTATED | 7 | 3 | 0 | 1 |
| 12P LOSS WILD-TYPE | 18 | 40 | 48 | 28 |
Figure S6. Get High-res Image Gene #58: '12p loss mutation analysis' versus Clinical Feature #8: 'TUMOR.STAGE'
-
Mutation data file = broad_values_by_arm.mutsig.cluster.txt
-
Clinical data file = STAD-TP.clin.merged.picked.txt
-
Number of patients = 161
-
Number of significantly arm-level cnvs = 74
-
Number of selected clinical features = 9
-
Exclude genes that fewer than K tumors have mutations, K = 3
For survival clinical features, the Kaplan-Meier survival curves of tumors with and without gene mutations were plotted and the statistical significance P values were estimated by logrank test (Bland and Altman 2004) using the 'survdiff' function in R
For continuous numerical clinical features, two-tailed Student's t test with unequal variance (Lehmann and Romano 2005) was applied to compare the clinical values between tumors with and without gene mutations using 't.test' function in R
For binary or multi-class clinical features (nominal or ordinal), two-tailed Fisher's exact tests (Fisher 1922) were used to estimate the P values using the 'fisher.test' function in R
For multi-class clinical features (nominal or ordinal), Chi-square tests (Greenwood and Nikulin 1996) were used to estimate the P values using the 'chisq.test' function in R
For multiple hypothesis correction, Q value is the False Discovery Rate (FDR) analogue of the P value (Benjamini and Hochberg 1995), defined as the minimum FDR at which the test may be called significant. We used the 'Benjamini and Hochberg' method of 'p.adjust' function in R to convert P values into Q values.
This is an experimental feature. The full results of the analysis summarized in this report can be downloaded from the TCGA Data Coordination Center.