(primary solid tumor cohort)
This pipeline uses various statistical tests to identify mRNAs whose expression levels correlated to selected clinical features.
Testing the association between 19433 genes and 8 clinical features across 43 samples, statistically thresholded by Q value < 0.05, 4 clinical features related to at least one genes.
-
11 genes correlated to 'GENDER'.
-
XIST|7503_CALCULATED , USP9Y|8287_CALCULATED , TSIX|9383_CALCULATED , ZFY|7544_CALCULATED , PRKY|5616_CALCULATED , ...
-
117 genes correlated to 'HISTOLOGICAL.TYPE'.
-
SEL1L|6400_CALCULATED , BIRC5|332_CALCULATED , EPR1|8475_CALCULATED , YAP1|10413_CALCULATED , BTBD6|90135_CALCULATED , ...
-
2 genes correlated to 'PATHOLOGY.N'.
-
NKX2-2|4821_CALCULATED , PEX5L|51555_CALCULATED
-
1 gene correlated to 'PATHOLOGICSPREAD(M)'.
-
DBR1|51163_CALCULATED
-
No genes correlated to 'Time to Death', 'AGE', 'PATHOLOGY.T', and 'TUMOR.STAGE'.
Complete statistical result table is provided in Supplement Table 1
Table 1. Get Full Table This table shows the clinical features, statistical methods used, and the number of genes that are significantly associated with each clinical feature at Q value < 0.05.
| Clinical feature | Statistical test | Significant genes | Associated with | Associated with | ||
|---|---|---|---|---|---|---|
| Time to Death | Cox regression test | N=0 | ||||
| AGE | Spearman correlation test | N=0 | ||||
| GENDER | t test | N=11 | male | N=9 | female | N=2 |
| HISTOLOGICAL TYPE | ANOVA test | N=117 | ||||
| PATHOLOGY T | Spearman correlation test | N=0 | ||||
| PATHOLOGY N | Spearman correlation test | N=2 | higher pN | N=1 | lower pN | N=1 |
| PATHOLOGICSPREAD(M) | ANOVA test | N=1 | ||||
| TUMOR STAGE | Spearman correlation test | N=0 |
Table S1. Basic characteristics of clinical feature: 'Time to Death'
| Time to Death | Duration (Months) | 1-54 (median=14) |
| censored | N = 13 | |
| death | N = 5 | |
| Significant markers | N = 0 |
Table S2. Basic characteristics of clinical feature: 'AGE'
| AGE | Mean (SD) | 70.37 (10) |
| Significant markers | N = 0 |
Table S3. Basic characteristics of clinical feature: 'GENDER'
| GENDER | Labels | N |
| FEMALE | 20 | |
| MALE | 23 | |
| Significant markers | N = 11 | |
| Higher in MALE | 9 | |
| Higher in FEMALE | 2 |
Table S4. Get Full Table List of top 10 genes differentially expressed by 'GENDER'
| T(pos if higher in 'MALE') | ttestP | Q | AUC | |
|---|---|---|---|---|
| XIST|7503_CALCULATED | -19.68 | 5.119e-22 | 9.94e-18 | 1 |
| USP9Y|8287_CALCULATED | 28.46 | 3.31e-21 | 6.43e-17 | 1 |
| TSIX|9383_CALCULATED | -18.32 | 5.512e-21 | 1.07e-16 | 1 |
| ZFY|7544_CALCULATED | 22.33 | 4.944e-20 | 9.6e-16 | 1 |
| PRKY|5616_CALCULATED | 17.07 | 3.058e-17 | 5.94e-13 | 1 |
| RPS4Y1|6192_CALCULATED | 19.5 | 1.478e-15 | 2.87e-11 | 1 |
| TMSB4Y|9087_CALCULATED | 17.9 | 3.703e-15 | 7.19e-11 | 1 |
| EIF1AY|9086_CALCULATED | 20.73 | 1.294e-14 | 2.51e-10 | 1 |
| KDM5D|8284_CALCULATED | 23.59 | 1.51e-12 | 2.93e-08 | 1 |
| UTY|7404_CALCULATED | 19.54 | 1.591e-12 | 3.09e-08 | 1 |
Figure S1. Get High-res Image As an example, this figure shows the association of XIST|7503_CALCULATED to 'GENDER'. P value = 5.12e-22 with T-test analysis.
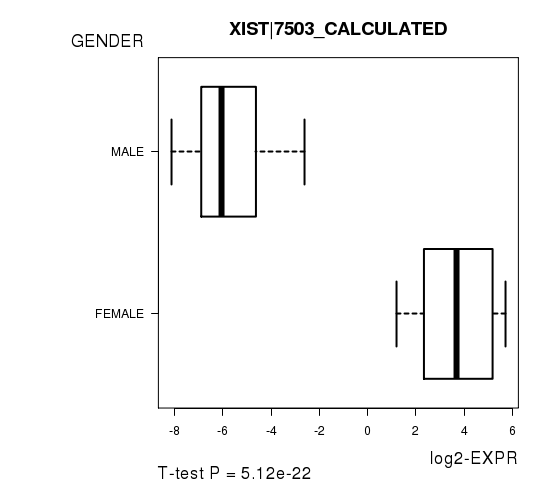
Table S5. Basic characteristics of clinical feature: 'HISTOLOGICAL.TYPE'
| HISTOLOGICAL.TYPE | Labels | N |
| STOMACH ADENOCARCINOMA - DIFFUSE TYPE | 2 | |
| STOMACH ADENOCARCINOMA - NOT OTHERWISE SPECIFIED (NOS) | 25 | |
| STOMACH INTESTINAL ADENOCARCINOMA - MUCINOUS TYPE | 1 | |
| STOMACH INTESTINAL ADENOCARCINOMA - TUBULAR TYPE | 1 | |
| STOMACH INTESTINAL ADENOCARCINOMA - TYPE NOT OTHERWISE SPECIFIED (NOS) | 9 | |
| Significant markers | N = 117 |
Table S6. Get Full Table List of top 10 genes differentially expressed by 'HISTOLOGICAL.TYPE'
| ANOVA_P | Q | |
|---|---|---|
| SEL1L|6400_CALCULATED | 7.396e-13 | 1.44e-08 |
| BIRC5|332_CALCULATED | 1.14e-11 | 2.22e-07 |
| EPR1|8475_CALCULATED | 3.636e-11 | 7.07e-07 |
| YAP1|10413_CALCULATED | 4.648e-11 | 9.03e-07 |
| BTBD6|90135_CALCULATED | 1.764e-10 | 3.43e-06 |
| DLGAP5|9787_CALCULATED | 4.193e-10 | 8.15e-06 |
| TK1|7083_CALCULATED | 6.594e-10 | 1.28e-05 |
| REST|5978_CALCULATED | 8.98e-10 | 1.74e-05 |
| GRIK1|2897_CALCULATED | 1.099e-09 | 2.13e-05 |
| SPC25|57405_CALCULATED | 1.494e-09 | 2.9e-05 |
Figure S2. Get High-res Image As an example, this figure shows the association of SEL1L|6400_CALCULATED to 'HISTOLOGICAL.TYPE'. P value = 7.4e-13 with ANOVA analysis.
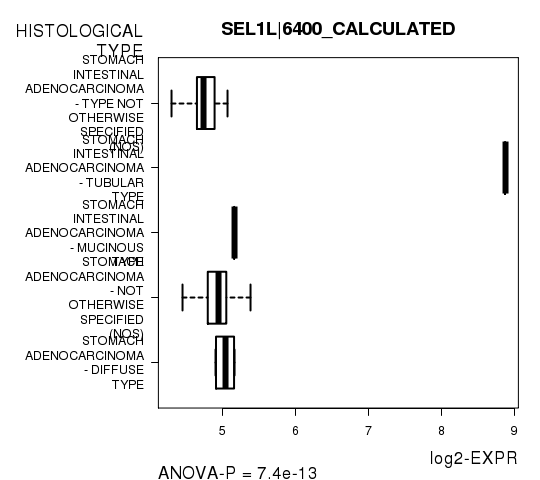
Table S7. Basic characteristics of clinical feature: 'PATHOLOGY.T'
| PATHOLOGY.T | Mean (SD) | 2.74 (0.93) |
| N | ||
| T1 | 2 | |
| T2 | 14 | |
| T3 | 9 | |
| T4 | 9 | |
| Significant markers | N = 0 |
Table S8. Basic characteristics of clinical feature: 'PATHOLOGY.N'
| PATHOLOGY.N | Mean (SD) | 1.22 (1) |
| N | ||
| N0 | 8 | |
| N1 | 14 | |
| N2 | 5 | |
| N3 | 5 | |
| Significant markers | N = 2 | |
| pos. correlated | 1 | |
| neg. correlated | 1 |
Table S9. Get Full Table List of 2 genes significantly correlated to 'PATHOLOGY.N' by Spearman correlation test
| SpearmanCorr | corrP | Q | |
|---|---|---|---|
| NKX2-2|4821_CALCULATED | 0.8641 | 2.19e-07 | 0.00426 |
| PEX5L|51555_CALCULATED | -0.7489 | 1.933e-06 | 0.0376 |
Figure S3. Get High-res Image As an example, this figure shows the association of NKX2-2|4821_CALCULATED to 'PATHOLOGY.N'. P value = 2.19e-07 with Spearman correlation analysis.
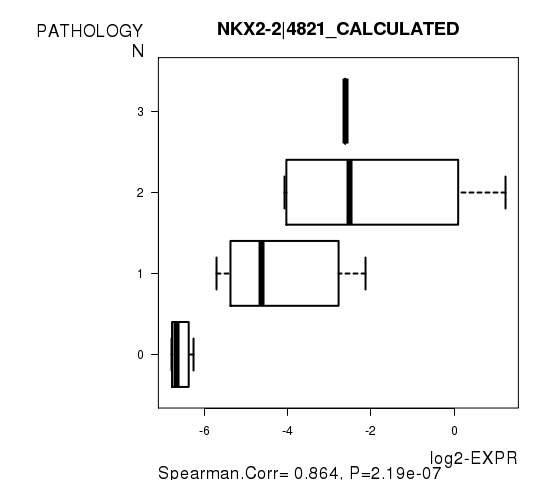
Table S10. Basic characteristics of clinical feature: 'PATHOLOGICSPREAD(M)'
| PATHOLOGICSPREAD(M) | Labels | N |
| M0 | 34 | |
| M1 | 7 | |
| MX | 2 | |
| Significant markers | N = 1 |
Table S11. Get Full Table List of one gene differentially expressed by 'PATHOLOGICSPREAD(M)'
| ANOVA_P | Q | |
|---|---|---|
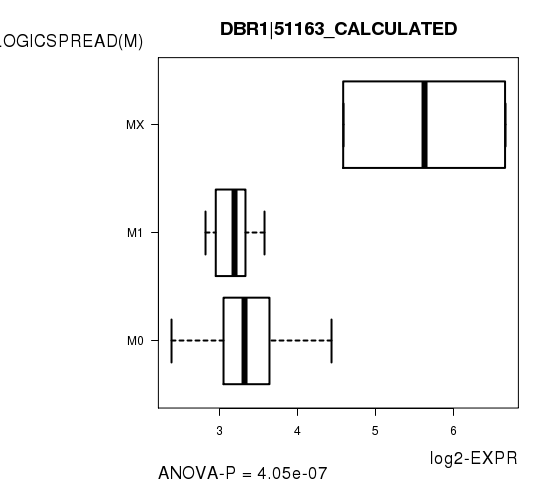
| DBR1|51163_CALCULATED | 4.046e-07 | 0.00786 |
Figure S4. Get High-res Image As an example, this figure shows the association of DBR1|51163_CALCULATED to 'PATHOLOGICSPREAD(M)'. P value = 4.05e-07 with ANOVA analysis.
-
Expresson data file = STAD-TP.mRNAseq_RPKM_log2.txt
-
Clinical data file = STAD-TP.clin.merged.picked.txt
-
Number of patients = 43
-
Number of genes = 19433
-
Number of clinical features = 8
For survival clinical features, Wald's test in univariate Cox regression analysis with proportional hazards model (Andersen and Gill 1982) was used to estimate the P values using the 'coxph' function in R. Kaplan-Meier survival curves were plot using the four quartile subgroups of patients based on expression levels
For continuous numerical clinical features, Spearman's rank correlation coefficients (Spearman 1904) and two-tailed P values were estimated using 'cor.test' function in R
For two-class clinical features, two-tailed Student's t test with unequal variance (Lehmann and Romano 2005) was applied to compare the log2-expression levels between the two clinical classes using 't.test' function in R
For multi-class clinical features (ordinal or nominal), one-way analysis of variance (Howell 2002) was applied to compare the log2-expression levels between different clinical classes using 'anova' function in R
For multiple hypothesis correction, Q value is the False Discovery Rate (FDR) analogue of the P value (Benjamini and Hochberg 1995), defined as the minimum FDR at which the test may be called significant. We used the 'Benjamini and Hochberg' method of 'p.adjust' function in R to convert P values into Q values.
This is an experimental feature. The full results of the analysis summarized in this report can be downloaded from the TCGA Data Coordination Center.