(primary solid tumor cohort)
This pipeline computes the correlation between significantly recurrent gene mutations and selected clinical features.
Testing the association between mutation status of 40 genes and 8 clinical features across 116 patients, 3 significant findings detected with Q value < 0.25.
-
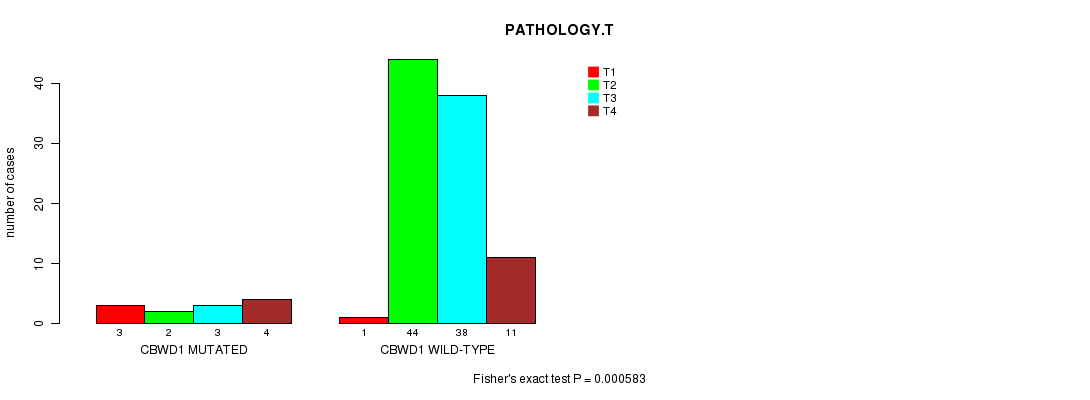
CBWD1 mutation correlated to 'PATHOLOGY.T'.
-
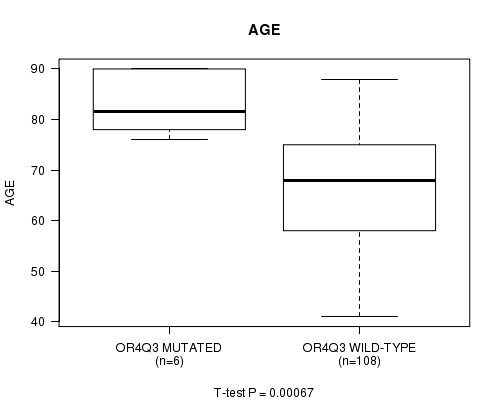
OR4Q3 mutation correlated to 'AGE'.
-
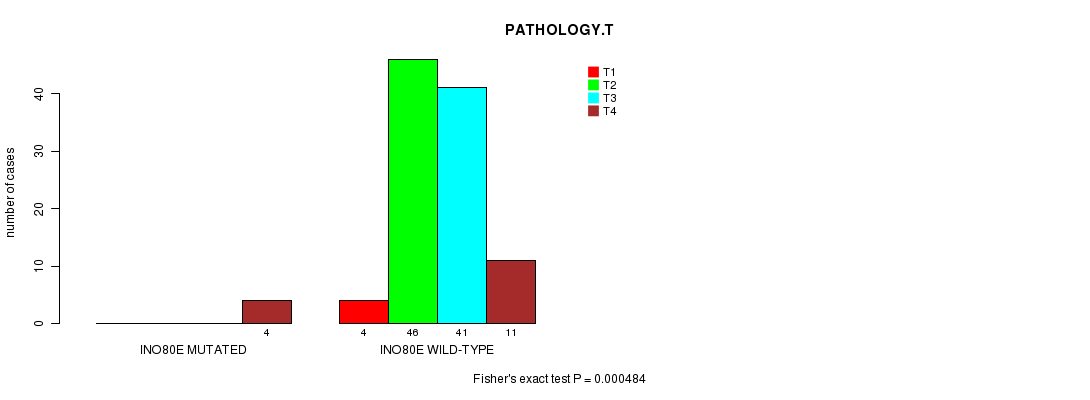
INO80E mutation correlated to 'PATHOLOGY.T'.
Table 1. Get Full Table Overview of the association between mutation status of 40 genes and 8 clinical features. Shown in the table are P values (Q values). Thresholded by Q value < 0.25, 3 significant findings detected.
|
Clinical Features |
Time to Death |
AGE | GENDER |
HISTOLOGICAL TYPE |
PATHOLOGY T |
PATHOLOGY N |
PATHOLOGICSPREAD(M) |
TUMOR STAGE |
||
| nMutated (%) | nWild-Type | logrank test | t-test | Fisher's exact test | Chi-square test | Fisher's exact test | Fisher's exact test | Fisher's exact test | Fisher's exact test | |
| CBWD1 | 14 (12%) | 102 |
0.303 (1.00) |
0.0229 (1.00) |
0.243 (1.00) |
0.312 (1.00) |
0.000583 (0.182) |
0.692 (1.00) |
0.505 (1.00) |
0.264 (1.00) |
| OR4Q3 | 6 (5%) | 110 |
0.344 (1.00) |
0.00067 (0.208) |
0.4 (1.00) |
0.812 (1.00) |
0.224 (1.00) |
0.0842 (1.00) |
0.114 (1.00) |
0.263 (1.00) |
| INO80E | 5 (4%) | 111 |
0.936 (1.00) |
0.0798 (1.00) |
0.805 (1.00) |
0.000484 (0.151) |
0.913 (1.00) |
0.554 (1.00) |
0.0587 (1.00) |
|
| TP53 | 52 (45%) | 64 |
0.0826 (1.00) |
0.519 (1.00) |
0.345 (1.00) |
0.0205 (1.00) |
0.754 (1.00) |
0.975 (1.00) |
0.123 (1.00) |
0.747 (1.00) |
| KRAS | 14 (12%) | 102 |
0.353 (1.00) |
0.496 (1.00) |
0.243 (1.00) |
0.701 (1.00) |
0.8 (1.00) |
0.348 (1.00) |
0.623 (1.00) |
0.41 (1.00) |
| PIK3CA | 24 (21%) | 92 |
0.407 (1.00) |
0.457 (1.00) |
0.253 (1.00) |
0.789 (1.00) |
0.669 (1.00) |
0.655 (1.00) |
1 (1.00) |
0.375 (1.00) |
| ARID1A | 22 (19%) | 94 |
0.225 (1.00) |
0.814 (1.00) |
0.0525 (1.00) |
0.298 (1.00) |
0.114 (1.00) |
0.422 (1.00) |
0.0193 (1.00) |
0.168 (1.00) |
| PGM5 | 16 (14%) | 100 |
0.962 (1.00) |
0.00184 (0.566) |
0.0138 (1.00) |
0.495 (1.00) |
0.00445 (1.00) |
0.898 (1.00) |
0.555 (1.00) |
0.381 (1.00) |
| ACVR2A | 13 (11%) | 103 |
0.00155 (0.478) |
0.218 (1.00) |
0.131 (1.00) |
0.263 (1.00) |
0.128 (1.00) |
0.881 (1.00) |
0.371 (1.00) |
0.414 (1.00) |
| RPL22 | 9 (8%) | 107 |
0.478 (1.00) |
0.0449 (1.00) |
0.48 (1.00) |
0.591 (1.00) |
0.0528 (1.00) |
0.303 (1.00) |
0.000925 (0.287) |
0.099 (1.00) |
| OR8H3 | 10 (9%) | 106 |
0.626 (1.00) |
0.424 (1.00) |
0.738 (1.00) |
0.0783 (1.00) |
0.774 (1.00) |
0.113 (1.00) |
0.724 (1.00) |
0.688 (1.00) |
| RHOA | 7 (6%) | 109 |
0.0968 (1.00) |
0.0615 (1.00) |
0.701 (1.00) |
0.451 (1.00) |
0.559 (1.00) |
0.765 (1.00) |
0.681 (1.00) |
0.157 (1.00) |
| TRIM48 | 10 (9%) | 106 |
0.322 (1.00) |
0.157 (1.00) |
0.191 (1.00) |
0.448 (1.00) |
0.0924 (1.00) |
0.698 (1.00) |
0.0506 (1.00) |
0.241 (1.00) |
| ZNF804B | 18 (16%) | 98 |
0.909 (1.00) |
0.267 (1.00) |
0.61 (1.00) |
0.416 (1.00) |
1 (1.00) |
0.13 (1.00) |
0.382 (1.00) |
0.0243 (1.00) |
| EDNRB | 12 (10%) | 104 |
0.877 (1.00) |
0.831 (1.00) |
0.537 (1.00) |
0.365 (1.00) |
0.233 (1.00) |
0.339 (1.00) |
0.451 (1.00) |
0.885 (1.00) |
| SPRYD5 | 8 (7%) | 108 |
0.143 (1.00) |
0.135 (1.00) |
1 (1.00) |
0.904 (1.00) |
0.0528 (1.00) |
0.765 (1.00) |
0.103 (1.00) |
0.0411 (1.00) |
| PCDH15 | 22 (19%) | 94 |
0.855 (1.00) |
0.534 (1.00) |
0.63 (1.00) |
0.878 (1.00) |
0.407 (1.00) |
0.757 (1.00) |
0.649 (1.00) |
0.222 (1.00) |
| HLA-B | 9 (8%) | 107 |
0.963 (1.00) |
0.717 (1.00) |
0.028 (1.00) |
0.556 (1.00) |
0.126 (1.00) |
0.111 (1.00) |
0.329 (1.00) |
0.303 (1.00) |
| TUSC3 | 9 (8%) | 107 |
0.76 (1.00) |
0.28 (1.00) |
1 (1.00) |
0.783 (1.00) |
0.46 (1.00) |
0.488 (1.00) |
0.329 (1.00) |
0.551 (1.00) |
| TPTE | 14 (12%) | 102 |
0.382 (1.00) |
0.92 (1.00) |
0.401 (1.00) |
0.00396 (1.00) |
0.283 (1.00) |
0.263 (1.00) |
0.505 (1.00) |
0.974 (1.00) |
| C17ORF63 | 3 (3%) | 113 |
0.524 (1.00) |
0.562 (1.00) |
0.836 (1.00) |
0.121 (1.00) |
0.437 (1.00) |
1 (1.00) |
0.532 (1.00) |
|
| SLITRK6 | 10 (9%) | 106 |
0.231 (1.00) |
0.693 (1.00) |
0.738 (1.00) |
0.742 (1.00) |
0.925 (1.00) |
0.619 (1.00) |
0.26 (1.00) |
0.327 (1.00) |
| RNF43 | 13 (11%) | 103 |
0.0257 (1.00) |
0.0612 (1.00) |
0.368 (1.00) |
0.151 (1.00) |
0.062 (1.00) |
0.881 (1.00) |
0.484 (1.00) |
0.185 (1.00) |
| TM7SF4 | 7 (6%) | 109 |
0.915 (1.00) |
0.553 (1.00) |
0.701 (1.00) |
0.855 (1.00) |
0.619 (1.00) |
0.847 (1.00) |
1 (1.00) |
0.676 (1.00) |
| WBSCR17 | 12 (10%) | 104 |
0.116 (1.00) |
0.185 (1.00) |
0.537 (1.00) |
0.281 (1.00) |
0.419 (1.00) |
0.965 (1.00) |
0.333 (1.00) |
0.835 (1.00) |
| OR4C16 | 8 (7%) | 108 |
0.614 (1.00) |
0.415 (1.00) |
0.475 (1.00) |
0.245 (1.00) |
0.346 (1.00) |
0.798 (1.00) |
0.695 (1.00) |
0.788 (1.00) |
| SMAD4 | 7 (6%) | 109 |
0.103 (1.00) |
0.051 (1.00) |
0.701 (1.00) |
0.663 (1.00) |
0.9 (1.00) |
1 (1.00) |
0.153 (1.00) |
1 (1.00) |
| ASTN2 | 14 (12%) | 102 |
0.525 (1.00) |
0.266 (1.00) |
0.401 (1.00) |
0.169 (1.00) |
0.119 (1.00) |
0.933 (1.00) |
0.224 (1.00) |
0.747 (1.00) |
| IAPP | 4 (3%) | 112 |
0.485 (1.00) |
1 (1.00) |
0.937 (1.00) |
1 (1.00) |
0.897 (1.00) |
0.189 (1.00) |
0.107 (1.00) |
|
| IRF2 | 8 (7%) | 108 |
0.74 (1.00) |
0.234 (1.00) |
0.0568 (1.00) |
0.762 (1.00) |
0.0166 (1.00) |
0.873 (1.00) |
0.288 (1.00) |
0.928 (1.00) |
| CDH20 | 14 (12%) | 102 |
0.525 (1.00) |
0.129 (1.00) |
0.0172 (1.00) |
0.698 (1.00) |
0.393 (1.00) |
0.845 (1.00) |
0.623 (1.00) |
0.824 (1.00) |
| OR2T6 | 6 (5%) | 110 |
0.996 (1.00) |
0.988 (1.00) |
0.68 (1.00) |
0.542 (1.00) |
0.0647 (1.00) |
0.442 (1.00) |
0.622 (1.00) |
0.105 (1.00) |
| PARK2 | 9 (8%) | 107 |
0.73 (1.00) |
0.00874 (1.00) |
1 (1.00) |
0.109 (1.00) |
0.292 (1.00) |
0.351 (1.00) |
0.329 (1.00) |
0.199 (1.00) |
| PDZRN4 | 11 (9%) | 105 |
0.699 (1.00) |
0.61 (1.00) |
0.522 (1.00) |
0.952 (1.00) |
0.172 (1.00) |
0.766 (1.00) |
0.0645 (1.00) |
0.93 (1.00) |
| CYP7B1 | 7 (6%) | 109 |
1 (1.00) |
0.333 (1.00) |
1 (1.00) |
0.0234 (1.00) |
1 (1.00) |
0.0797 (1.00) |
0.681 (1.00) |
0.378 (1.00) |
| CHRM2 | 6 (5%) | 110 |
0.373 (1.00) |
0.4 (1.00) |
0.0979 (1.00) |
0.478 (1.00) |
1 (1.00) |
1 (1.00) |
0.186 (1.00) |
|
| KIAA0748 | 7 (6%) | 109 |
0.337 (1.00) |
0.375 (1.00) |
1 (1.00) |
0.735 (1.00) |
0.699 (1.00) |
0.568 (1.00) |
1 (1.00) |
0.199 (1.00) |
| FMOD | 8 (7%) | 108 |
0.911 (1.00) |
0.753 (1.00) |
0.711 (1.00) |
0.434 (1.00) |
0.559 (1.00) |
0.021 (1.00) |
1 (1.00) |
0.863 (1.00) |
| BMPR2 | 9 (8%) | 107 |
0.621 (1.00) |
0.281 (1.00) |
0.48 (1.00) |
0.801 (1.00) |
0.781 (1.00) |
0.596 (1.00) |
1 (1.00) |
0.885 (1.00) |
| CNBD1 | 5 (4%) | 111 |
0.136 (1.00) |
1 (1.00) |
0.769 (1.00) |
1 (1.00) |
1 (1.00) |
P value = 0.000583 (Fisher's exact test), Q value = 0.18
Table S1. Gene #4: 'CBWD1 MUTATION STATUS' versus Clinical Feature #5: 'PATHOLOGY.T'
| nPatients | T1 | T2 | T3 | T4 |
|---|---|---|---|---|
| ALL | 4 | 46 | 41 | 15 |
| CBWD1 MUTATED | 3 | 2 | 3 | 4 |
| CBWD1 WILD-TYPE | 1 | 44 | 38 | 11 |
Figure S1. Get High-res Image Gene #4: 'CBWD1 MUTATION STATUS' versus Clinical Feature #5: 'PATHOLOGY.T'
P value = 0.00067 (t-test), Q value = 0.21
Table S2. Gene #27: 'OR4Q3 MUTATION STATUS' versus Clinical Feature #2: 'AGE'
| nPatients | Mean (Std.Dev) | |
|---|---|---|
| ALL | 114 | 68.1 (11.1) |
| OR4Q3 MUTATED | 6 | 82.8 (6.0) |
| OR4Q3 WILD-TYPE | 108 | 67.3 (10.7) |
Figure S2. Get High-res Image Gene #27: 'OR4Q3 MUTATION STATUS' versus Clinical Feature #2: 'AGE'
P value = 0.000484 (Fisher's exact test), Q value = 0.15
Table S3. Gene #40: 'INO80E MUTATION STATUS' versus Clinical Feature #5: 'PATHOLOGY.T'
| nPatients | T1 | T2 | T3 | T4 |
|---|---|---|---|---|
| ALL | 4 | 46 | 41 | 15 |
| INO80E MUTATED | 0 | 0 | 0 | 4 |
| INO80E WILD-TYPE | 4 | 46 | 41 | 11 |
Figure S3. Get High-res Image Gene #40: 'INO80E MUTATION STATUS' versus Clinical Feature #5: 'PATHOLOGY.T'
-
Mutation data file = STAD-TP.mutsig.cluster.txt
-
Clinical data file = STAD-TP.clin.merged.picked.txt
-
Number of patients = 116
-
Number of significantly mutated genes = 40
-
Number of selected clinical features = 8
-
Exclude genes that fewer than K tumors have mutations, K = 3
For survival clinical features, the Kaplan-Meier survival curves of tumors with and without gene mutations were plotted and the statistical significance P values were estimated by logrank test (Bland and Altman 2004) using the 'survdiff' function in R
For continuous numerical clinical features, two-tailed Student's t test with unequal variance (Lehmann and Romano 2005) was applied to compare the clinical values between tumors with and without gene mutations using 't.test' function in R
For binary or multi-class clinical features (nominal or ordinal), two-tailed Fisher's exact tests (Fisher 1922) were used to estimate the P values using the 'fisher.test' function in R
For multi-class clinical features (nominal or ordinal), Chi-square tests (Greenwood and Nikulin 1996) were used to estimate the P values using the 'chisq.test' function in R
For multiple hypothesis correction, Q value is the False Discovery Rate (FDR) analogue of the P value (Benjamini and Hochberg 1995), defined as the minimum FDR at which the test may be called significant. We used the 'Benjamini and Hochberg' method of 'p.adjust' function in R to convert P values into Q values.
This is an experimental feature. The full results of the analysis summarized in this report can be downloaded from the TCGA Data Coordination Center.