(primary solid tumor cohort)
This pipeline uses various statistical tests to identify mRNAs whose expression levels correlated to selected clinical features.
Testing the association between 18015 genes and 5 clinical features across 198 samples, statistically thresholded by Q value < 0.05, 5 clinical features related to at least one genes.
-
83 genes correlated to 'AGE'.
-
C12ORF52|84934 , EPN3|55040 , GOT2|2806 , KBTBD2|25948 , GPI|2821 , ...
-
33 genes correlated to 'GENDER'.
-
DDX3Y|8653 , RPS4Y1|6192 , ZFY|7544 , USP9Y|8287 , KDM5D|8284 , ...
-
3625 genes correlated to 'HISTOLOGICAL.TYPE'.
-
FN1|2335 , LDLR|3949 , FAM176A|84141 , ANKLE2|23141 , PTPRE|5791 , ...
-
38 genes correlated to 'RADIATIONS.RADIATION.REGIMENINDICATION'.
-
FLJ37543|285668 , C14ORF180|400258 , A2ML1|144568 , LOC440173|440173 , TAS2R43|259289 , ...
-
25 genes correlated to 'RADIATIONEXPOSURE'.
-
ZNF804B|219578 , DMPK|1760 , SLC12A1|6557 , FOLR4|390243 , CXORF30|645090 , ...
Complete statistical result table is provided in Supplement Table 1
Table 1. Get Full Table This table shows the clinical features, statistical methods used, and the number of genes that are significantly associated with each clinical feature at Q value < 0.05.
| Clinical feature | Statistical test | Significant genes | Associated with | Associated with | ||
|---|---|---|---|---|---|---|
| AGE | Spearman correlation test | N=83 | older | N=46 | younger | N=37 |
| GENDER | t test | N=33 | male | N=13 | female | N=20 |
| HISTOLOGICAL TYPE | ANOVA test | N=3625 | ||||
| RADIATIONS RADIATION REGIMENINDICATION | t test | N=38 | yes | N=22 | no | N=16 |
| RADIATIONEXPOSURE | t test | N=25 | yes | N=0 | no | N=25 |
Table S1. Basic characteristics of clinical feature: 'AGE'
| AGE | Mean (SD) | 46.74 (16) |
| Significant markers | N = 83 | |
| pos. correlated | 46 | |
| neg. correlated | 37 |
Table S2. Get Full Table List of top 10 genes significantly correlated to 'AGE' by Spearman correlation test
| SpearmanCorr | corrP | Q | |
|---|---|---|---|
| C12ORF52|84934 | 0.408 | 2.433e-09 | 4.38e-05 |
| EPN3|55040 | 0.3949 | 8.517e-09 | 0.000153 |
| GOT2|2806 | 0.3892 | 1.453e-08 | 0.000262 |
| KBTBD2|25948 | -0.3806 | 3.176e-08 | 0.000572 |
| GPI|2821 | 0.3789 | 3.715e-08 | 0.000669 |
| GPR173|54328 | -0.3784 | 4.199e-08 | 0.000756 |
| MST1P9|11223 | -0.376 | 4.795e-08 | 0.000864 |
| PTPN12|5782 | -0.376 | 4.81e-08 | 0.000866 |
| HADH|3033 | 0.3726 | 6.458e-08 | 0.00116 |
| ALDOA|226 | 0.3725 | 6.51e-08 | 0.00117 |
Figure S1. Get High-res Image As an example, this figure shows the association of C12ORF52|84934 to 'AGE'. P value = 2.43e-09 with Spearman correlation analysis. The straight line presents the best linear regression.
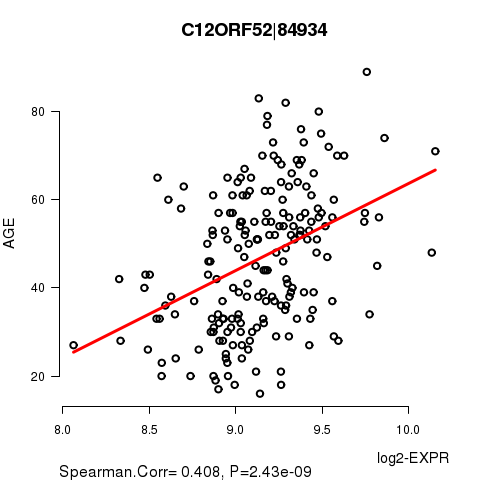
Table S3. Basic characteristics of clinical feature: 'GENDER'
| GENDER | Labels | N |
| FEMALE | 146 | |
| MALE | 52 | |
| Significant markers | N = 33 | |
| Higher in MALE | 13 | |
| Higher in FEMALE | 20 |
Table S4. Get Full Table List of top 10 genes differentially expressed by 'GENDER'
| T(pos if higher in 'MALE') | ttestP | Q | AUC | |
|---|---|---|---|---|
| DDX3Y|8653 | 72.55 | 1.046e-99 | 1.88e-95 | 1 |
| RPS4Y1|6192 | 59.63 | 6.738e-94 | 1.21e-89 | 1 |
| ZFY|7544 | 62.73 | 6.467e-88 | 1.16e-83 | 1 |
| USP9Y|8287 | 61.51 | 8.561e-78 | 1.54e-73 | 1 |
| KDM5D|8284 | 65.97 | 3.356e-76 | 6.04e-72 | 1 |
| UTY|7404 | 63.25 | 3.346e-74 | 6.03e-70 | 1 |
| NLGN4Y|22829 | 44.85 | 2.175e-63 | 3.92e-59 | 1 |
| PRKY|5616 | 27.66 | 1.737e-62 | 3.13e-58 | 0.9982 |
| CYORF15A|246126 | 49.43 | 1.619e-51 | 2.91e-47 | 1 |
| CYORF15B|84663 | 46.07 | 3.858e-49 | 6.95e-45 | 1 |
Figure S2. Get High-res Image As an example, this figure shows the association of DDX3Y|8653 to 'GENDER'. P value = 1.05e-99 with T-test analysis.

Table S5. Basic characteristics of clinical feature: 'HISTOLOGICAL.TYPE'
| HISTOLOGICAL.TYPE | Labels | N |
| OTHER | 7 | |
| THYROID PAPILLARY CARCINOMA - CLASSICAL/USUAL | 113 | |
| THYROID PAPILLARY CARCINOMA - FOLLICULAR (>= 99% FOLLICULAR PATTERNED) | 58 | |
| THYROID PAPILLARY CARCINOMA - TALL CELL (>= 50% TALL CELL FEATURES) | 20 | |
| Significant markers | N = 3625 |
Table S6. Get Full Table List of top 10 genes differentially expressed by 'HISTOLOGICAL.TYPE'
| ANOVA_P | Q | |
|---|---|---|
| FN1|2335 | 1.749e-29 | 3.15e-25 |
| LDLR|3949 | 1.138e-27 | 2.05e-23 |
| FAM176A|84141 | 4.052e-27 | 7.3e-23 |
| ANKLE2|23141 | 6.008e-27 | 1.08e-22 |
| PTPRE|5791 | 2.186e-26 | 3.94e-22 |
| TMPRSS6|164656 | 3.242e-26 | 5.84e-22 |
| SFTPB|6439 | 7.071e-26 | 1.27e-21 |
| CREB5|9586 | 7.528e-26 | 1.36e-21 |
| KCNN4|3783 | 9.053e-25 | 1.63e-20 |
| GABRB2|2561 | 9.205e-25 | 1.66e-20 |
Figure S3. Get High-res Image As an example, this figure shows the association of FN1|2335 to 'HISTOLOGICAL.TYPE'. P value = 1.75e-29 with ANOVA analysis.

38 genes related to 'RADIATIONS.RADIATION.REGIMENINDICATION'.
Table S7. Basic characteristics of clinical feature: 'RADIATIONS.RADIATION.REGIMENINDICATION'
| RADIATIONS.RADIATION.REGIMENINDICATION | Labels | N |
| NO | 12 | |
| YES | 186 | |
| Significant markers | N = 38 | |
| Higher in YES | 22 | |
| Higher in NO | 16 |
Table S8. Get Full Table List of top 10 genes differentially expressed by 'RADIATIONS.RADIATION.REGIMENINDICATION'
| T(pos if higher in 'YES') | ttestP | Q | AUC | |
|---|---|---|---|---|
| FLJ37543|285668 | 10.71 | 2.564e-14 | 4.6e-10 | 0.8484 |
| C14ORF180|400258 | 8.73 | 1.291e-12 | 2.32e-08 | 0.8645 |
| A2ML1|144568 | 8.27 | 1.664e-10 | 2.99e-06 | 0.8168 |
| LOC440173|440173 | 7.5 | 2.426e-09 | 4.35e-05 | 0.8936 |
| TAS2R43|259289 | 6.77 | 9.702e-09 | 0.000174 | 0.7729 |
| HCFC1|3054 | -8.94 | 1.695e-08 | 0.000304 | 0.8844 |
| HPR|3250 | 7.89 | 4.509e-08 | 0.000809 | 0.9041 |
| DNAH14|127602 | -7.75 | 4.973e-08 | 0.000892 | 0.8392 |
| ENPP3|5169 | 7.36 | 1.021e-07 | 0.00183 | 0.8383 |
| TMEM20|159371 | 7.59 | 1.353e-07 | 0.00243 | 0.8401 |
Figure S4. Get High-res Image As an example, this figure shows the association of FLJ37543|285668 to 'RADIATIONS.RADIATION.REGIMENINDICATION'. P value = 2.56e-14 with T-test analysis.

Table S9. Basic characteristics of clinical feature: 'RADIATIONEXPOSURE'
| RADIATIONEXPOSURE | Labels | N |
| NO | 162 | |
| YES | 8 | |
| Significant markers | N = 25 | |
| Higher in YES | 0 | |
| Higher in NO | 25 |
Table S10. Get Full Table List of top 10 genes differentially expressed by 'RADIATIONEXPOSURE'
| T(pos if higher in 'YES') | ttestP | Q | AUC | |
|---|---|---|---|---|
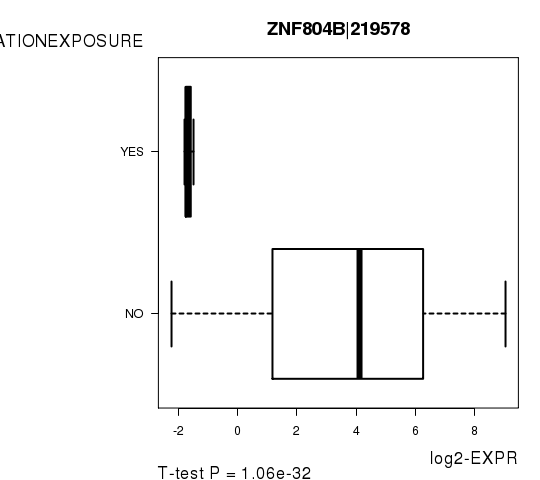
| ZNF804B|219578 | -17.38 | 1.064e-32 | 1.88e-28 | 0.9667 |
| DMPK|1760 | -10.6 | 1.848e-18 | 3.26e-14 | 0.8287 |
| SLC12A1|6557 | -10.36 | 3.087e-17 | 5.45e-13 | 0.9007 |
| FOLR4|390243 | -9.99 | 1.262e-15 | 2.23e-11 | 0.8889 |
| CXORF30|645090 | -9.59 | 5.821e-12 | 1.03e-07 | 0.9231 |
| ASCL1|429 | -9.01 | 1.117e-11 | 1.97e-07 | 0.8419 |
| C17ORF64|124773 | -8.19 | 3.835e-11 | 6.77e-07 | 0.846 |
| GRIA1|2890 | -8.62 | 6.718e-11 | 1.19e-06 | 0.8359 |
| FAM138F|641702 | -7.58 | 2.274e-10 | 4.01e-06 | 0.8361 |
| LOC127841|127841 | -7.35 | 1.147e-09 | 2.02e-05 | 0.8534 |
Figure S5. Get High-res Image As an example, this figure shows the association of ZNF804B|219578 to 'RADIATIONEXPOSURE'. P value = 1.06e-32 with T-test analysis.
-
Expresson data file = THCA-TP.uncv2.mRNAseq_RSEM_normalized_log2.txt
-
Clinical data file = THCA-TP.clin.merged.picked.txt
-
Number of patients = 198
-
Number of genes = 18015
-
Number of clinical features = 5
For continuous numerical clinical features, Spearman's rank correlation coefficients (Spearman 1904) and two-tailed P values were estimated using 'cor.test' function in R
For two-class clinical features, two-tailed Student's t test with unequal variance (Lehmann and Romano 2005) was applied to compare the log2-expression levels between the two clinical classes using 't.test' function in R
For multi-class clinical features (ordinal or nominal), one-way analysis of variance (Howell 2002) was applied to compare the log2-expression levels between different clinical classes using 'anova' function in R
For multiple hypothesis correction, Q value is the False Discovery Rate (FDR) analogue of the P value (Benjamini and Hochberg 1995), defined as the minimum FDR at which the test may be called significant. We used the 'Benjamini and Hochberg' method of 'p.adjust' function in R to convert P values into Q values.
This is an experimental feature. The full results of the analysis summarized in this report can be downloaded from the TCGA Data Coordination Center.