(primary solid tumor cohort)
This pipeline uses various statistical tests to identify genes whose promoter methylation levels correlated to selected clinical features.
Testing the association between 17081 genes and 5 clinical features across 195 samples, statistically thresholded by Q value < 0.05, 5 clinical features related to at least one genes.
-
80 genes correlated to 'AGE'.
-
C7ORF13 , C1ORF59 , DLK2 , INA , ZNF274 , ...
-
8 genes correlated to 'GENDER'.
-
UTP14C , KIF4B , METTL1 , FAM35A , WBP11P1 , ...
-
1280 genes correlated to 'HISTOLOGICAL.TYPE'.
-
EMP1 , PON2 , LY6G6C , CLCF1 , LOC100126784 , ...
-
29 genes correlated to 'RADIATIONS.RADIATION.REGIMENINDICATION'.
-
KIF15 , STX17 , MAP3K3 , SIK1 , RPL32 , ...
-
56 genes correlated to 'RADIATIONEXPOSURE'.
-
ATL2 , ALKBH2 , C1ORF96 , WDR5B , ATP5L2 , ...
Complete statistical result table is provided in Supplement Table 1
Table 1. Get Full Table This table shows the clinical features, statistical methods used, and the number of genes that are significantly associated with each clinical feature at Q value < 0.05.
| Clinical feature | Statistical test | Significant genes | Associated with | Associated with | ||
|---|---|---|---|---|---|---|
| AGE | Spearman correlation test | N=80 | older | N=80 | younger | N=0 |
| GENDER | t test | N=8 | male | N=5 | female | N=3 |
| HISTOLOGICAL TYPE | ANOVA test | N=1280 | ||||
| RADIATIONS RADIATION REGIMENINDICATION | t test | N=29 | yes | N=16 | no | N=13 |
| RADIATIONEXPOSURE | t test | N=56 | yes | N=28 | no | N=28 |
Table S1. Basic characteristics of clinical feature: 'AGE'
| AGE | Mean (SD) | 46.55 (16) |
| Significant markers | N = 80 | |
| pos. correlated | 80 | |
| neg. correlated | 0 |
Table S2. Get Full Table List of top 10 genes significantly correlated to 'AGE' by Spearman correlation test
| SpearmanCorr | corrP | Q | |
|---|---|---|---|
| C7ORF13 | 0.5246 | 3.501e-15 | 5.98e-11 |
| C1ORF59 | 0.5215 | 5.38e-15 | 9.19e-11 |
| DLK2 | 0.5124 | 1.907e-14 | 3.26e-10 |
| INA | 0.5114 | 2.185e-14 | 3.73e-10 |
| ZNF274 | 0.4969 | 1.482e-13 | 2.53e-09 |
| ANKRD43 | 0.4967 | 1.527e-13 | 2.61e-09 |
| ZNF518B | 0.4885 | 4.341e-13 | 7.41e-09 |
| SYNGR3 | 0.4718 | 3.359e-12 | 5.74e-08 |
| GNPNAT1 | 0.471 | 3.691e-12 | 6.3e-08 |
| NHLRC1 | 0.468 | 5.254e-12 | 8.97e-08 |
Figure S1. Get High-res Image As an example, this figure shows the association of C7ORF13 to 'AGE'. P value = 3.5e-15 with Spearman correlation analysis. The straight line presents the best linear regression.
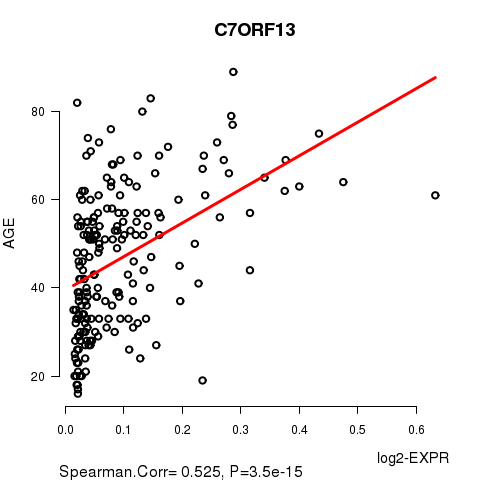
Table S3. Basic characteristics of clinical feature: 'GENDER'
| GENDER | Labels | N |
| FEMALE | 146 | |
| MALE | 49 | |
| Significant markers | N = 8 | |
| Higher in MALE | 5 | |
| Higher in FEMALE | 3 |
Table S4. Get Full Table List of 8 genes differentially expressed by 'GENDER'
| T(pos if higher in 'MALE') | ttestP | Q | AUC | |
|---|---|---|---|---|
| UTP14C | 26.79 | 9.062e-63 | 1.55e-58 | 0.999 |
| KIF4B | -12.9 | 7.244e-23 | 1.24e-18 | 0.9405 |
| METTL1 | 8.17 | 7.481e-12 | 1.28e-07 | 0.8707 |
| FAM35A | -6.44 | 1.438e-09 | 2.46e-05 | 0.812 |
| WBP11P1 | 6.56 | 7.008e-09 | 0.00012 | 0.8156 |
| ANKRD20A4 | 6.1 | 2.664e-08 | 0.000455 | 0.7643 |
| CCDC121 | 5.84 | 7.92e-08 | 0.00135 | 0.7386 |
| C14ORF33 | -5.08 | 1.893e-06 | 0.0323 | 0.7025 |
Figure S2. Get High-res Image As an example, this figure shows the association of UTP14C to 'GENDER'. P value = 9.06e-63 with T-test analysis.
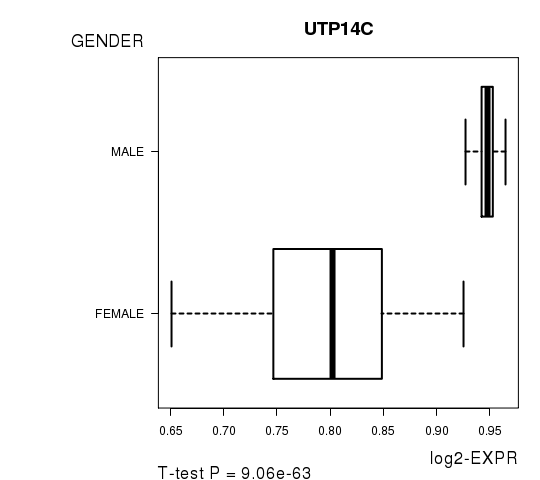
Table S5. Basic characteristics of clinical feature: 'HISTOLOGICAL.TYPE'
| HISTOLOGICAL.TYPE | Labels | N |
| OTHER | 7 | |
| THYROID PAPILLARY CARCINOMA - CLASSICAL/USUAL | 113 | |
| THYROID PAPILLARY CARCINOMA - FOLLICULAR (>= 99% FOLLICULAR PATTERNED) | 55 | |
| THYROID PAPILLARY CARCINOMA - TALL CELL (>= 50% TALL CELL FEATURES) | 20 | |
| Significant markers | N = 1280 |
Table S6. Get Full Table List of top 10 genes differentially expressed by 'HISTOLOGICAL.TYPE'
| ANOVA_P | Q | |
|---|---|---|
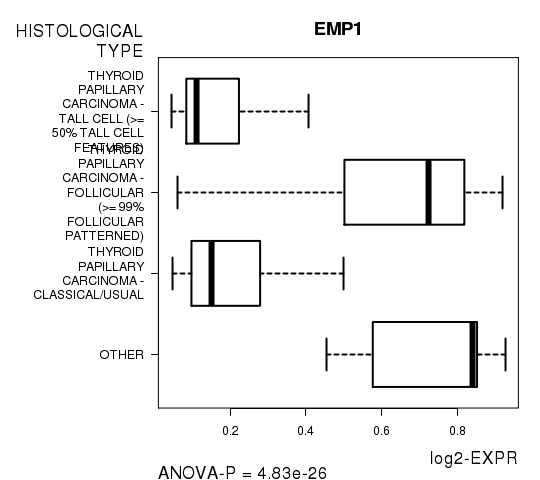
| EMP1 | 4.828e-26 | 8.25e-22 |
| PON2 | 4.85e-25 | 8.28e-21 |
| LY6G6C | 1.263e-24 | 2.16e-20 |
| CLCF1 | 1.28e-24 | 2.19e-20 |
| LOC100126784 | 3.598e-24 | 6.14e-20 |
| LAMP3 | 6.362e-24 | 1.09e-19 |
| LEPR | 9.36e-24 | 1.6e-19 |
| LEPROT | 9.36e-24 | 1.6e-19 |
| RELL1 | 1.845e-23 | 3.15e-19 |
| ZNRF2 | 3.055e-23 | 5.21e-19 |
Figure S3. Get High-res Image As an example, this figure shows the association of EMP1 to 'HISTOLOGICAL.TYPE'. P value = 4.83e-26 with ANOVA analysis.
29 genes related to 'RADIATIONS.RADIATION.REGIMENINDICATION'.
Table S7. Basic characteristics of clinical feature: 'RADIATIONS.RADIATION.REGIMENINDICATION'
| RADIATIONS.RADIATION.REGIMENINDICATION | Labels | N |
| NO | 12 | |
| YES | 183 | |
| Significant markers | N = 29 | |
| Higher in YES | 16 | |
| Higher in NO | 13 |
Table S8. Get Full Table List of top 10 genes differentially expressed by 'RADIATIONS.RADIATION.REGIMENINDICATION'
| T(pos if higher in 'YES') | ttestP | Q | AUC | |
|---|---|---|---|---|
| KIF15 | 8 | 1.137e-13 | 1.94e-09 | 0.8019 |
| STX17 | 7.92 | 2.779e-13 | 4.75e-09 | 0.6685 |
| MAP3K3 | -9.73 | 4.039e-13 | 6.9e-09 | 0.8547 |
| SIK1 | 6.61 | 3.609e-10 | 6.16e-06 | 0.7117 |
| RPL32 | 6.42 | 5.726e-09 | 9.78e-05 | 0.7532 |
| TAF7 | 6.06 | 9.459e-09 | 0.000162 | 0.698 |
| POMP | -6.31 | 1.076e-08 | 0.000184 | 0.8338 |
| MYOM2 | 6 | 1.654e-08 | 0.000282 | 0.5073 |
| GPR120 | 6.11 | 1.994e-08 | 0.00034 | 0.6612 |
| TXNIP | -6.24 | 4.907e-08 | 0.000838 | 0.7523 |
Figure S4. Get High-res Image As an example, this figure shows the association of KIF15 to 'RADIATIONS.RADIATION.REGIMENINDICATION'. P value = 1.14e-13 with T-test analysis.

Table S9. Basic characteristics of clinical feature: 'RADIATIONEXPOSURE'
| RADIATIONEXPOSURE | Labels | N |
| NO | 160 | |
| YES | 8 | |
| Significant markers | N = 56 | |
| Higher in YES | 28 | |
| Higher in NO | 28 |
Table S10. Get Full Table List of top 10 genes differentially expressed by 'RADIATIONEXPOSURE'
| T(pos if higher in 'YES') | ttestP | Q | AUC | |
|---|---|---|---|---|
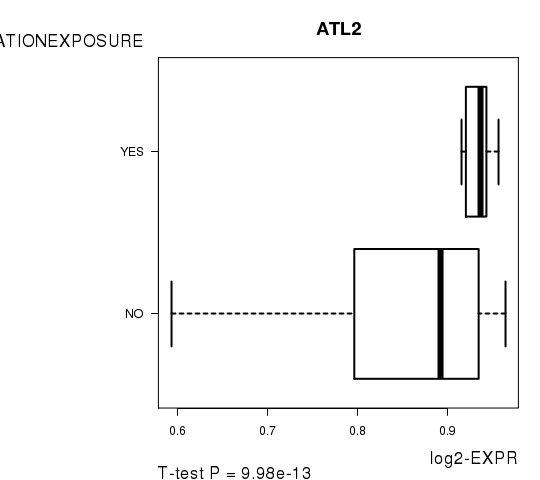
| ATL2 | 8.35 | 9.978e-13 | 1.7e-08 | 0.7766 |
| ALKBH2 | -7.52 | 3.447e-12 | 5.89e-08 | 0.85 |
| C1ORF96 | 8.01 | 7.181e-12 | 1.23e-07 | 0.7039 |
| WDR5B | -7.17 | 4.638e-11 | 7.92e-07 | 0.7773 |
| ATP5L2 | 6.64 | 4.411e-10 | 7.53e-06 | 0.7469 |
| ATP5I | -7.83 | 5.168e-10 | 8.83e-06 | 0.7742 |
| DHX57 | 6.65 | 5.975e-10 | 1.02e-05 | 0.682 |
| LOC100132707 | -6.58 | 8.041e-10 | 1.37e-05 | 0.6961 |
| NKX2-2 | -6.61 | 1.612e-09 | 2.75e-05 | 0.7805 |
| LRRC20 | -6.54 | 2.626e-09 | 4.48e-05 | 0.7695 |
Figure S5. Get High-res Image As an example, this figure shows the association of ATL2 to 'RADIATIONEXPOSURE'. P value = 9.98e-13 with T-test analysis.
-
Expresson data file = THCA-TP.meth.for_correlation.filtered_data.txt
-
Clinical data file = THCA-TP.clin.merged.picked.txt
-
Number of patients = 195
-
Number of genes = 17081
-
Number of clinical features = 5
For continuous numerical clinical features, Spearman's rank correlation coefficients (Spearman 1904) and two-tailed P values were estimated using 'cor.test' function in R
For two-class clinical features, two-tailed Student's t test with unequal variance (Lehmann and Romano 2005) was applied to compare the log2-expression levels between the two clinical classes using 't.test' function in R
For multi-class clinical features (ordinal or nominal), one-way analysis of variance (Howell 2002) was applied to compare the log2-expression levels between different clinical classes using 'anova' function in R
For multiple hypothesis correction, Q value is the False Discovery Rate (FDR) analogue of the P value (Benjamini and Hochberg 1995), defined as the minimum FDR at which the test may be called significant. We used the 'Benjamini and Hochberg' method of 'p.adjust' function in R to convert P values into Q values.
This is an experimental feature. The full results of the analysis summarized in this report can be downloaded from the TCGA Data Coordination Center.