(primary solid tumor cohort)
This pipeline computes the correlation between cancer subtypes identified by different molecular patterns and selected clinical features.
Testing the association between subtypes identified by 8 different clustering approaches and 6 clinical features across 218 patients, 11 significant findings detected with P value < 0.05 and Q value < 0.25.
-
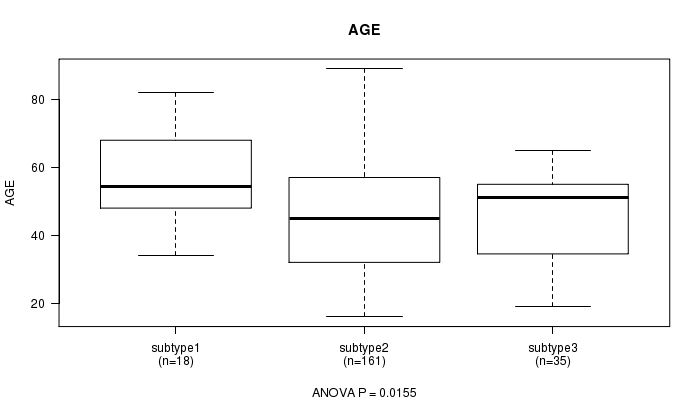
3 subtypes identified in current cancer cohort by 'CN CNMF'. These subtypes do not correlate to any clinical features.
-
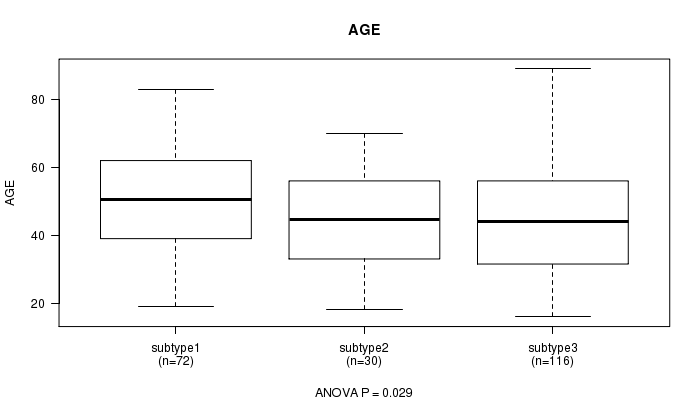
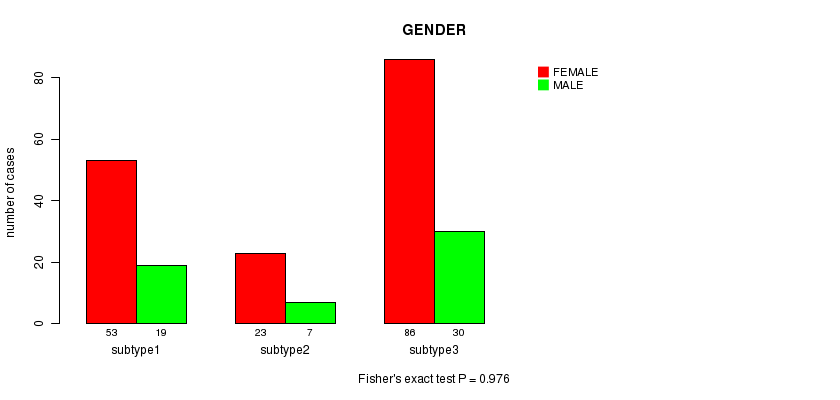
3 subtypes identified in current cancer cohort by 'METHLYATION CNMF'. These subtypes correlate to 'HISTOLOGICAL.TYPE'.
-
CNMF clustering analysis on RPPA data identified 3 subtypes that correlate to 'AGE' and 'HISTOLOGICAL.TYPE'.
-
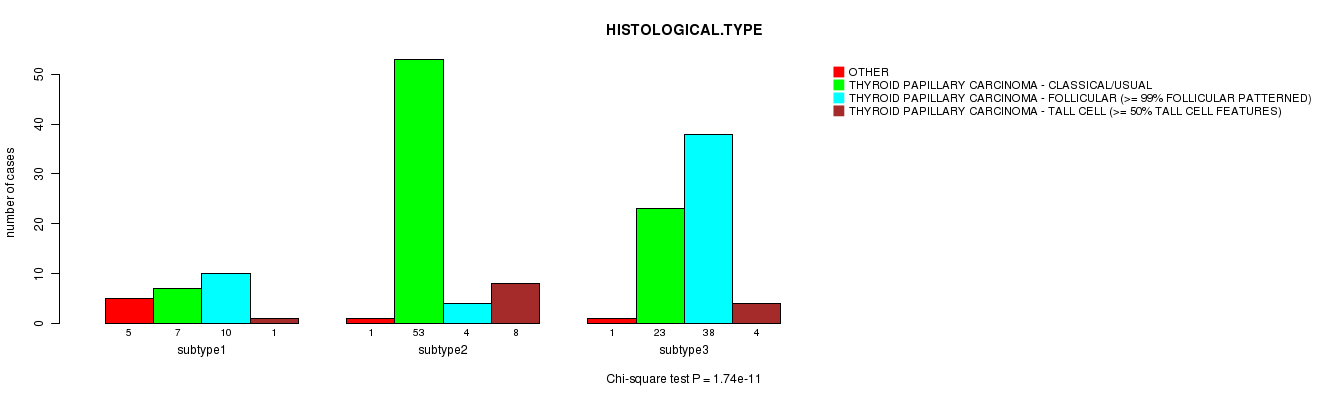
Consensus hierarchical clustering analysis on RPPA data identified 3 subtypes that correlate to 'AGE' and 'HISTOLOGICAL.TYPE'.
-
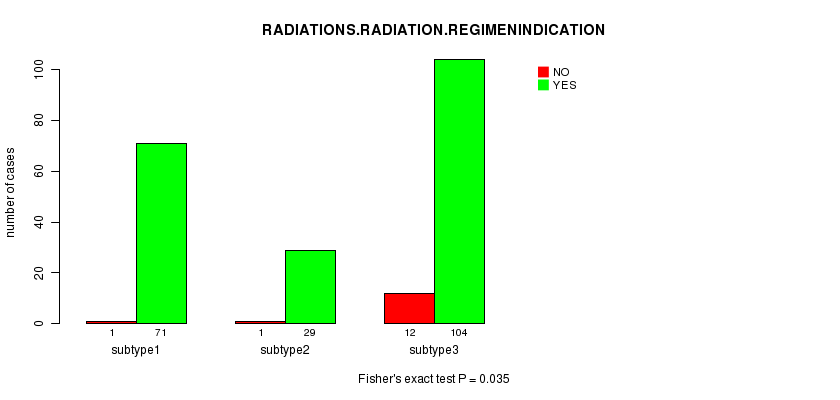
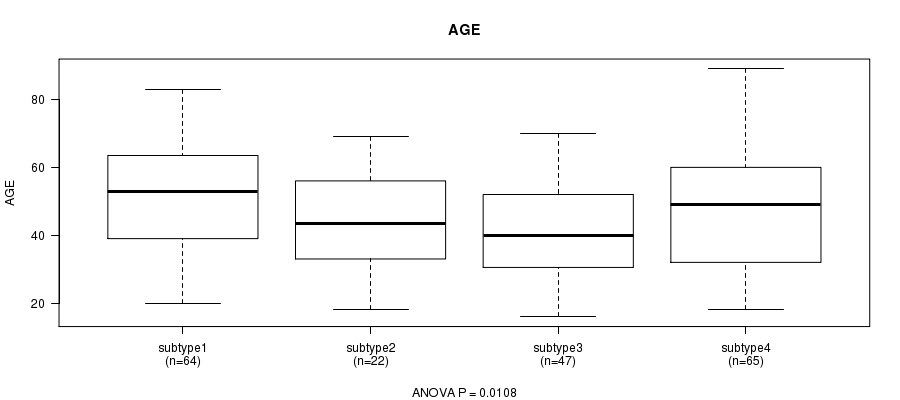
CNMF clustering analysis on sequencing-based mRNA expression data identified 4 subtypes that correlate to 'HISTOLOGICAL.TYPE' and 'RADIATIONS.RADIATION.REGIMENINDICATION'.
-
Consensus hierarchical clustering analysis on sequencing-based mRNA expression data identified 3 subtypes that correlate to 'HISTOLOGICAL.TYPE'.
-
CNMF clustering analysis on sequencing-based miR expression data identified 3 subtypes that correlate to 'HISTOLOGICAL.TYPE'.
-
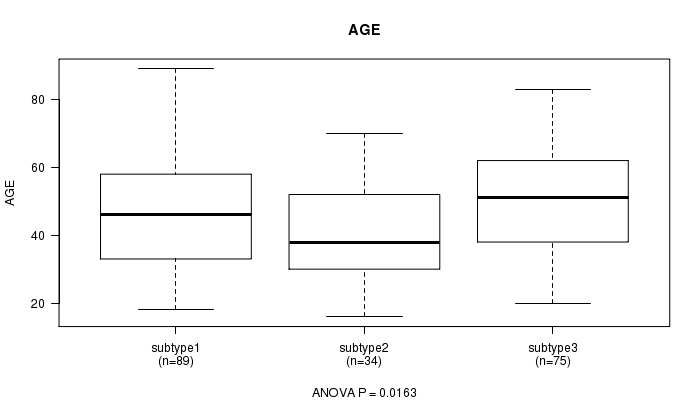
Consensus hierarchical clustering analysis on sequencing-based miR expression data identified 3 subtypes that correlate to 'AGE' and 'HISTOLOGICAL.TYPE'.
Table 1. Get Full Table Overview of the association between subtypes identified by 8 different clustering approaches and 6 clinical features. Shown in the table are P values (Q values). Thresholded by P value < 0.05 and Q value < 0.25, 11 significant findings detected.
|
Clinical Features |
Time to Death |
AGE | GENDER |
HISTOLOGICAL TYPE |
RADIATIONS RADIATION REGIMENINDICATION |
RADIATIONEXPOSURE |
| Statistical Tests | logrank test | ANOVA | Fisher's exact test | Chi-square test | Fisher's exact test | Fisher's exact test |
| CN CNMF |
100 (1.00) |
0.0155 (0.543) |
0.66 (1.00) |
0.0953 (1.00) |
0.493 (1.00) |
0.42 (1.00) |
| METHLYATION CNMF |
100 (1.00) |
0.029 (0.929) |
0.976 (1.00) |
2.07e-15 (9.13e-14) |
0.035 (1.00) |
1 (1.00) |
| RPPA CNMF subtypes |
100 (1.00) |
0.000166 (0.00679) |
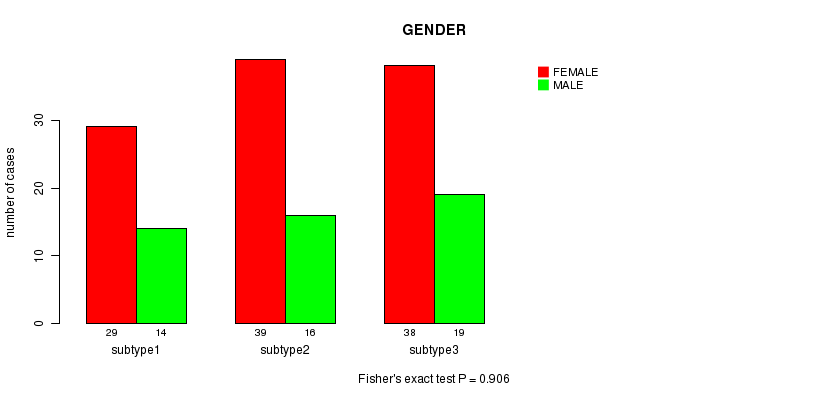
0.906 (1.00) |
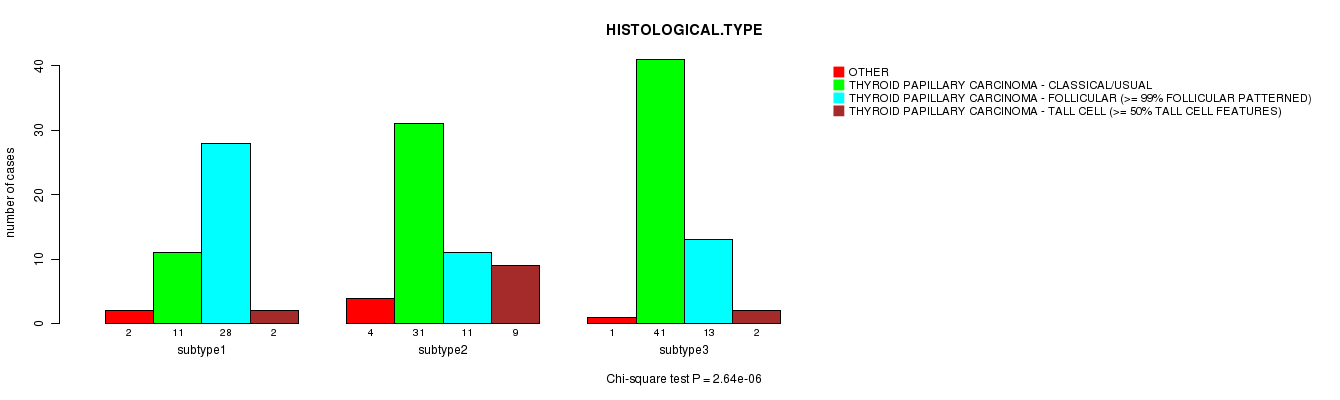
2.64e-06 (0.000111) |
0.00958 (0.354) |
0.791 (1.00) |
| RPPA cHierClus subtypes |
100 (1.00) |
0.001 (0.0402) |
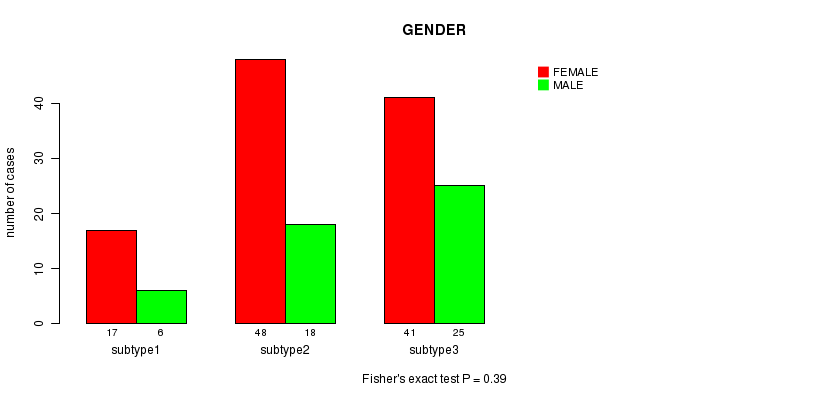
0.39 (1.00) |
1.74e-11 (7.46e-10) |
0.331 (1.00) |
0.0769 (1.00) |
| RNAseq CNMF subtypes |
100 (1.00) |
0.0108 (0.387) |
0.734 (1.00) |
8.86e-17 (4.07e-15) |
0.00383 (0.149) |
0.664 (1.00) |
| RNAseq cHierClus subtypes |
100 (1.00) |
0.0163 (0.554) |
0.453 (1.00) |
6.92e-16 (3.11e-14) |
0.0217 (0.717) |
1 (1.00) |
| MIRseq CNMF subtypes |
100 (1.00) |
0.0556 (1.00) |
0.335 (1.00) |
6.15e-18 (2.89e-16) |
0.468 (1.00) |
1 (1.00) |
| MIRseq cHierClus subtypes |
100 (1.00) |
0.00403 (0.153) |
0.365 (1.00) |
6.25e-20 (3e-18) |
0.0388 (1.00) |
0.834 (1.00) |
Table S1. Get Full Table Description of clustering approach #1: 'CN CNMF'
| Cluster Labels | 1 | 2 | 3 |
|---|---|---|---|
| Number of samples | 18 | 161 | 35 |
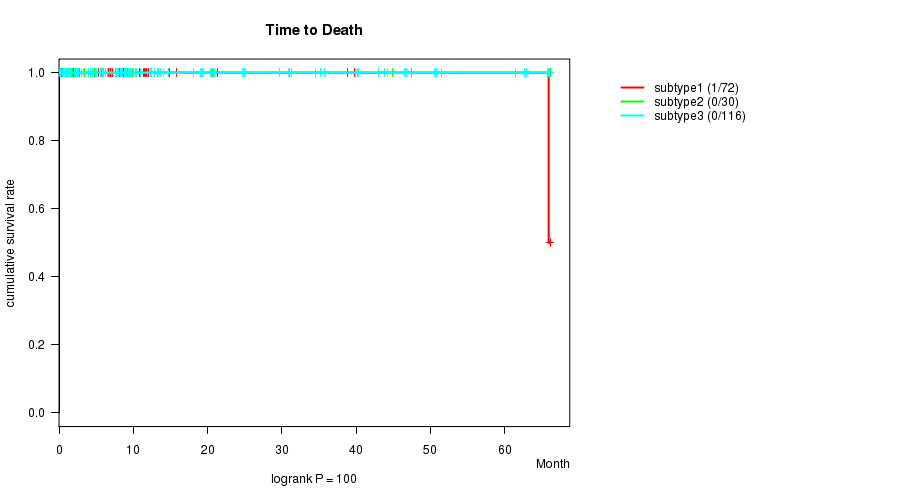
P value = 100 (logrank test), Q value = 1
Table S2. Clustering Approach #1: 'CN CNMF' versus Clinical Feature #1: 'Time to Death'
| nPatients | nDeath | Duration Range (Median), Month | |
|---|---|---|---|
| ALL | 214 | 1 | 0.0 - 66.1 (8.1) |
| subtype1 | 18 | 1 | 0.4 - 65.9 (11.8) |
| subtype2 | 161 | 0 | 0.1 - 66.1 (8.0) |
| subtype3 | 35 | 0 | 0.0 - 65.9 (7.6) |
Figure S1. Get High-res Image Clustering Approach #1: 'CN CNMF' versus Clinical Feature #1: 'Time to Death'

P value = 0.0155 (ANOVA), Q value = 0.54
Table S3. Clustering Approach #1: 'CN CNMF' versus Clinical Feature #2: 'AGE'
| nPatients | Mean (Std.Dev) | |
|---|---|---|
| ALL | 214 | 46.5 (15.9) |
| subtype1 | 18 | 56.7 (13.8) |
| subtype2 | 161 | 45.4 (16.4) |
| subtype3 | 35 | 46.0 (12.6) |
Figure S2. Get High-res Image Clustering Approach #1: 'CN CNMF' versus Clinical Feature #2: 'AGE'
P value = 0.66 (Fisher's exact test), Q value = 1
Table S4. Clustering Approach #1: 'CN CNMF' versus Clinical Feature #3: 'GENDER'
| nPatients | FEMALE | MALE |
|---|---|---|
| ALL | 160 | 54 |
| subtype1 | 12 | 6 |
| subtype2 | 121 | 40 |
| subtype3 | 27 | 8 |
Figure S3. Get High-res Image Clustering Approach #1: 'CN CNMF' versus Clinical Feature #3: 'GENDER'

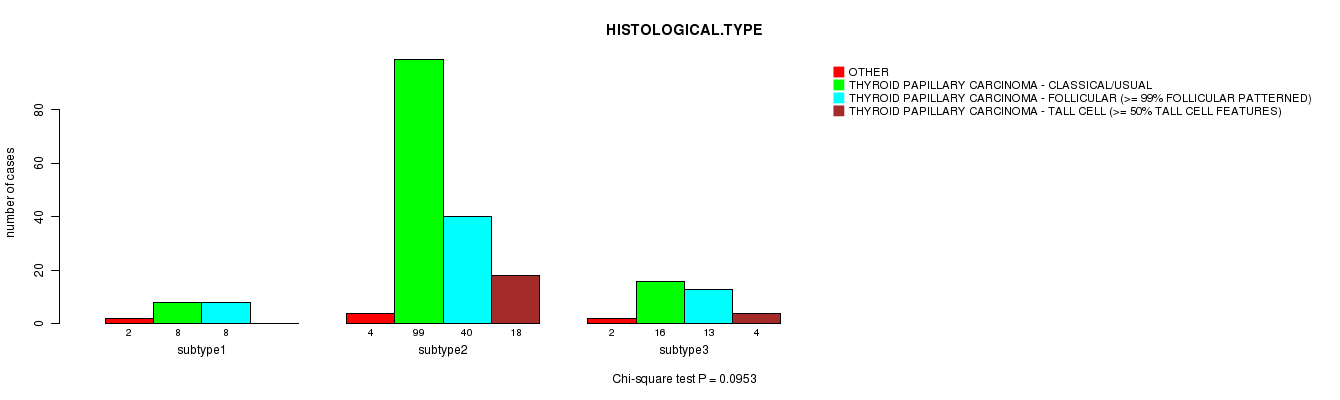
P value = 0.0953 (Chi-square test), Q value = 1
Table S5. Clustering Approach #1: 'CN CNMF' versus Clinical Feature #4: 'HISTOLOGICAL.TYPE'
| nPatients | OTHER | THYROID PAPILLARY CARCINOMA - CLASSICAL/USUAL | THYROID PAPILLARY CARCINOMA - FOLLICULAR (>= 99% FOLLICULAR PATTERNED) | THYROID PAPILLARY CARCINOMA - TALL CELL (>= 50% TALL CELL FEATURES) |
|---|---|---|---|---|
| ALL | 8 | 123 | 61 | 22 |
| subtype1 | 2 | 8 | 8 | 0 |
| subtype2 | 4 | 99 | 40 | 18 |
| subtype3 | 2 | 16 | 13 | 4 |
Figure S4. Get High-res Image Clustering Approach #1: 'CN CNMF' versus Clinical Feature #4: 'HISTOLOGICAL.TYPE'
P value = 0.493 (Fisher's exact test), Q value = 1
Table S6. Clustering Approach #1: 'CN CNMF' versus Clinical Feature #5: 'RADIATIONS.RADIATION.REGIMENINDICATION'
| nPatients | NO | YES |
|---|---|---|
| ALL | 14 | 200 |
| subtype1 | 2 | 16 |
| subtype2 | 11 | 150 |
| subtype3 | 1 | 34 |
Figure S5. Get High-res Image Clustering Approach #1: 'CN CNMF' versus Clinical Feature #5: 'RADIATIONS.RADIATION.REGIMENINDICATION'

P value = 0.42 (Fisher's exact test), Q value = 1
Table S7. Clustering Approach #1: 'CN CNMF' versus Clinical Feature #6: 'RADIATIONEXPOSURE'
| nPatients | NO | YES |
|---|---|---|
| ALL | 177 | 9 |
| subtype1 | 16 | 1 |
| subtype2 | 128 | 8 |
| subtype3 | 33 | 0 |
Figure S6. Get High-res Image Clustering Approach #1: 'CN CNMF' versus Clinical Feature #6: 'RADIATIONEXPOSURE'
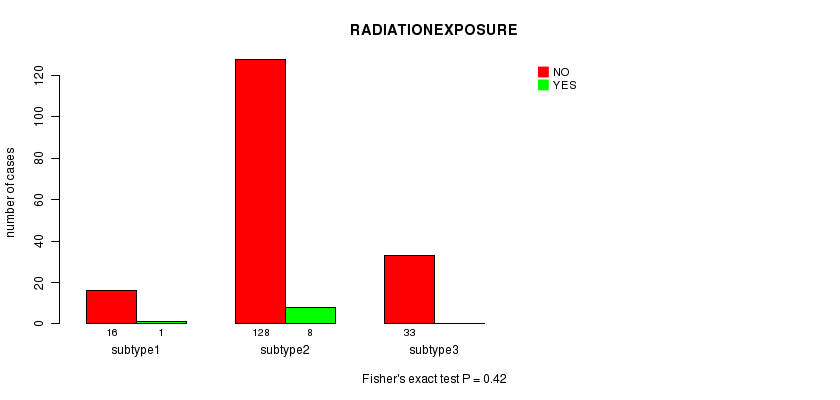
Table S8. Get Full Table Description of clustering approach #2: 'METHLYATION CNMF'
| Cluster Labels | 1 | 2 | 3 |
|---|---|---|---|
| Number of samples | 72 | 30 | 116 |
P value = 100 (logrank test), Q value = 1
Table S9. Clustering Approach #2: 'METHLYATION CNMF' versus Clinical Feature #1: 'Time to Death'
| nPatients | nDeath | Duration Range (Median), Month | |
|---|---|---|---|
| ALL | 218 | 1 | 0.0 - 66.1 (8.0) |
| subtype1 | 72 | 1 | 0.0 - 66.1 (7.0) |
| subtype2 | 30 | 0 | 0.1 - 66.1 (5.8) |
| subtype3 | 116 | 0 | 0.2 - 66.1 (10.0) |
Figure S7. Get High-res Image Clustering Approach #2: 'METHLYATION CNMF' versus Clinical Feature #1: 'Time to Death'
P value = 0.029 (ANOVA), Q value = 0.93
Table S10. Clustering Approach #2: 'METHLYATION CNMF' versus Clinical Feature #2: 'AGE'
| nPatients | Mean (Std.Dev) | |
|---|---|---|
| ALL | 218 | 46.5 (15.9) |
| subtype1 | 72 | 50.5 (15.9) |
| subtype2 | 30 | 44.1 (14.8) |
| subtype3 | 116 | 44.6 (15.9) |
Figure S8. Get High-res Image Clustering Approach #2: 'METHLYATION CNMF' versus Clinical Feature #2: 'AGE'
P value = 0.976 (Fisher's exact test), Q value = 1
Table S11. Clustering Approach #2: 'METHLYATION CNMF' versus Clinical Feature #3: 'GENDER'
| nPatients | FEMALE | MALE |
|---|---|---|
| ALL | 162 | 56 |
| subtype1 | 53 | 19 |
| subtype2 | 23 | 7 |
| subtype3 | 86 | 30 |
Figure S9. Get High-res Image Clustering Approach #2: 'METHLYATION CNMF' versus Clinical Feature #3: 'GENDER'
P value = 2.07e-15 (Chi-square test), Q value = 9.1e-14
Table S12. Clustering Approach #2: 'METHLYATION CNMF' versus Clinical Feature #4: 'HISTOLOGICAL.TYPE'
| nPatients | OTHER | THYROID PAPILLARY CARCINOMA - CLASSICAL/USUAL | THYROID PAPILLARY CARCINOMA - FOLLICULAR (>= 99% FOLLICULAR PATTERNED) | THYROID PAPILLARY CARCINOMA - TALL CELL (>= 50% TALL CELL FEATURES) |
|---|---|---|---|---|
| ALL | 8 | 124 | 64 | 22 |
| subtype1 | 6 | 16 | 47 | 3 |
| subtype2 | 1 | 20 | 5 | 4 |
| subtype3 | 1 | 88 | 12 | 15 |
Figure S10. Get High-res Image Clustering Approach #2: 'METHLYATION CNMF' versus Clinical Feature #4: 'HISTOLOGICAL.TYPE'

P value = 0.035 (Fisher's exact test), Q value = 1
Table S13. Clustering Approach #2: 'METHLYATION CNMF' versus Clinical Feature #5: 'RADIATIONS.RADIATION.REGIMENINDICATION'
| nPatients | NO | YES |
|---|---|---|
| ALL | 14 | 204 |
| subtype1 | 1 | 71 |
| subtype2 | 1 | 29 |
| subtype3 | 12 | 104 |
Figure S11. Get High-res Image Clustering Approach #2: 'METHLYATION CNMF' versus Clinical Feature #5: 'RADIATIONS.RADIATION.REGIMENINDICATION'
P value = 1 (Fisher's exact test), Q value = 1
Table S14. Clustering Approach #2: 'METHLYATION CNMF' versus Clinical Feature #6: 'RADIATIONEXPOSURE'
| nPatients | NO | YES |
|---|---|---|
| ALL | 180 | 9 |
| subtype1 | 57 | 3 |
| subtype2 | 25 | 1 |
| subtype3 | 98 | 5 |
Figure S12. Get High-res Image Clustering Approach #2: 'METHLYATION CNMF' versus Clinical Feature #6: 'RADIATIONEXPOSURE'
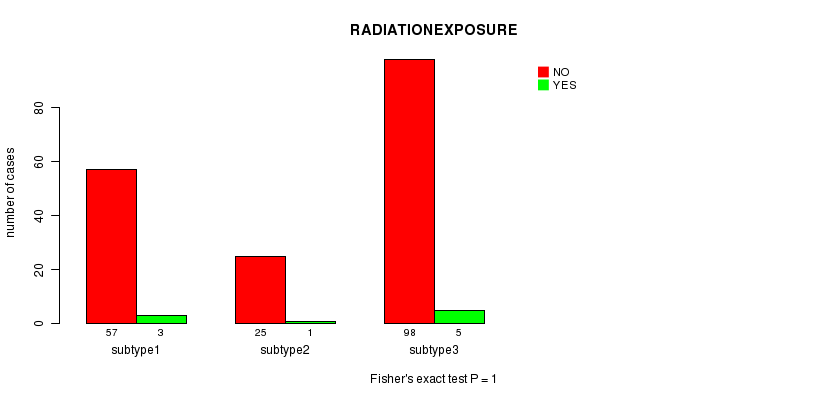
Table S15. Get Full Table Description of clustering approach #3: 'RPPA CNMF subtypes'
| Cluster Labels | 1 | 2 | 3 |
|---|---|---|---|
| Number of samples | 43 | 55 | 57 |
P value = 100 (logrank test), Q value = 1
Table S16. Clustering Approach #3: 'RPPA CNMF subtypes' versus Clinical Feature #1: 'Time to Death'
| nPatients | nDeath | Duration Range (Median), Month | |
|---|---|---|---|
| ALL | 155 | 1 | 0.1 - 66.1 (8.2) |
| subtype1 | 43 | 0 | 0.3 - 50.5 (8.1) |
| subtype2 | 55 | 0 | 0.2 - 65.9 (9.3) |
| subtype3 | 57 | 1 | 0.1 - 66.1 (7.7) |
Figure S13. Get High-res Image Clustering Approach #3: 'RPPA CNMF subtypes' versus Clinical Feature #1: 'Time to Death'

P value = 0.000166 (ANOVA), Q value = 0.0068
Table S17. Clustering Approach #3: 'RPPA CNMF subtypes' versus Clinical Feature #2: 'AGE'
| nPatients | Mean (Std.Dev) | |
|---|---|---|
| ALL | 155 | 46.6 (16.2) |
| subtype1 | 43 | 50.8 (13.7) |
| subtype2 | 55 | 50.5 (16.2) |
| subtype3 | 57 | 39.6 (15.7) |
Figure S14. Get High-res Image Clustering Approach #3: 'RPPA CNMF subtypes' versus Clinical Feature #2: 'AGE'

P value = 0.906 (Fisher's exact test), Q value = 1
Table S18. Clustering Approach #3: 'RPPA CNMF subtypes' versus Clinical Feature #3: 'GENDER'
| nPatients | FEMALE | MALE |
|---|---|---|
| ALL | 106 | 49 |
| subtype1 | 29 | 14 |
| subtype2 | 39 | 16 |
| subtype3 | 38 | 19 |
Figure S15. Get High-res Image Clustering Approach #3: 'RPPA CNMF subtypes' versus Clinical Feature #3: 'GENDER'
P value = 2.64e-06 (Chi-square test), Q value = 0.00011
Table S19. Clustering Approach #3: 'RPPA CNMF subtypes' versus Clinical Feature #4: 'HISTOLOGICAL.TYPE'
| nPatients | OTHER | THYROID PAPILLARY CARCINOMA - CLASSICAL/USUAL | THYROID PAPILLARY CARCINOMA - FOLLICULAR (>= 99% FOLLICULAR PATTERNED) | THYROID PAPILLARY CARCINOMA - TALL CELL (>= 50% TALL CELL FEATURES) |
|---|---|---|---|---|
| ALL | 7 | 83 | 52 | 13 |
| subtype1 | 2 | 11 | 28 | 2 |
| subtype2 | 4 | 31 | 11 | 9 |
| subtype3 | 1 | 41 | 13 | 2 |
Figure S16. Get High-res Image Clustering Approach #3: 'RPPA CNMF subtypes' versus Clinical Feature #4: 'HISTOLOGICAL.TYPE'
P value = 0.00958 (Fisher's exact test), Q value = 0.35
Table S20. Clustering Approach #3: 'RPPA CNMF subtypes' versus Clinical Feature #5: 'RADIATIONS.RADIATION.REGIMENINDICATION'
| nPatients | NO | YES |
|---|---|---|
| ALL | 13 | 142 |
| subtype1 | 0 | 43 |
| subtype2 | 9 | 46 |
| subtype3 | 4 | 53 |
Figure S17. Get High-res Image Clustering Approach #3: 'RPPA CNMF subtypes' versus Clinical Feature #5: 'RADIATIONS.RADIATION.REGIMENINDICATION'

P value = 0.791 (Fisher's exact test), Q value = 1
Table S21. Clustering Approach #3: 'RPPA CNMF subtypes' versus Clinical Feature #6: 'RADIATIONEXPOSURE'
| nPatients | NO | YES |
|---|---|---|
| ALL | 130 | 7 |
| subtype1 | 38 | 1 |
| subtype2 | 46 | 3 |
| subtype3 | 46 | 3 |
Figure S18. Get High-res Image Clustering Approach #3: 'RPPA CNMF subtypes' versus Clinical Feature #6: 'RADIATIONEXPOSURE'
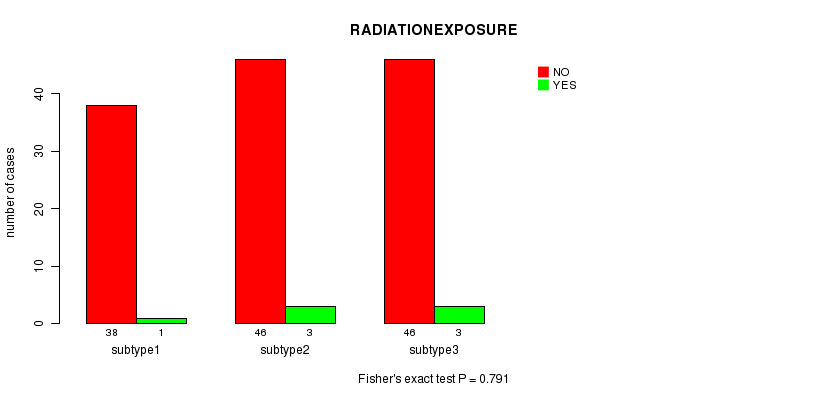
Table S22. Get Full Table Description of clustering approach #4: 'RPPA cHierClus subtypes'
| Cluster Labels | 1 | 2 | 3 |
|---|---|---|---|
| Number of samples | 23 | 66 | 66 |
P value = 100 (logrank test), Q value = 1
Table S23. Clustering Approach #4: 'RPPA cHierClus subtypes' versus Clinical Feature #1: 'Time to Death'
| nPatients | nDeath | Duration Range (Median), Month | |
|---|---|---|---|
| ALL | 155 | 1 | 0.1 - 66.1 (8.2) |
| subtype1 | 23 | 0 | 1.1 - 65.9 (8.1) |
| subtype2 | 66 | 0 | 0.1 - 66.1 (9.2) |
| subtype3 | 66 | 1 | 0.3 - 65.9 (8.0) |
Figure S19. Get High-res Image Clustering Approach #4: 'RPPA cHierClus subtypes' versus Clinical Feature #1: 'Time to Death'

P value = 0.001 (ANOVA), Q value = 0.04
Table S24. Clustering Approach #4: 'RPPA cHierClus subtypes' versus Clinical Feature #2: 'AGE'
| nPatients | Mean (Std.Dev) | |
|---|---|---|
| ALL | 155 | 46.6 (16.2) |
| subtype1 | 23 | 53.6 (16.7) |
| subtype2 | 66 | 41.3 (15.0) |
| subtype3 | 66 | 49.4 (15.7) |
Figure S20. Get High-res Image Clustering Approach #4: 'RPPA cHierClus subtypes' versus Clinical Feature #2: 'AGE'

P value = 0.39 (Fisher's exact test), Q value = 1
Table S25. Clustering Approach #4: 'RPPA cHierClus subtypes' versus Clinical Feature #3: 'GENDER'
| nPatients | FEMALE | MALE |
|---|---|---|
| ALL | 106 | 49 |
| subtype1 | 17 | 6 |
| subtype2 | 48 | 18 |
| subtype3 | 41 | 25 |
Figure S21. Get High-res Image Clustering Approach #4: 'RPPA cHierClus subtypes' versus Clinical Feature #3: 'GENDER'
P value = 1.74e-11 (Chi-square test), Q value = 7.5e-10
Table S26. Clustering Approach #4: 'RPPA cHierClus subtypes' versus Clinical Feature #4: 'HISTOLOGICAL.TYPE'
| nPatients | OTHER | THYROID PAPILLARY CARCINOMA - CLASSICAL/USUAL | THYROID PAPILLARY CARCINOMA - FOLLICULAR (>= 99% FOLLICULAR PATTERNED) | THYROID PAPILLARY CARCINOMA - TALL CELL (>= 50% TALL CELL FEATURES) |
|---|---|---|---|---|
| ALL | 7 | 83 | 52 | 13 |
| subtype1 | 5 | 7 | 10 | 1 |
| subtype2 | 1 | 53 | 4 | 8 |
| subtype3 | 1 | 23 | 38 | 4 |
Figure S22. Get High-res Image Clustering Approach #4: 'RPPA cHierClus subtypes' versus Clinical Feature #4: 'HISTOLOGICAL.TYPE'
P value = 0.331 (Fisher's exact test), Q value = 1
Table S27. Clustering Approach #4: 'RPPA cHierClus subtypes' versus Clinical Feature #5: 'RADIATIONS.RADIATION.REGIMENINDICATION'
| nPatients | NO | YES |
|---|---|---|
| ALL | 13 | 142 |
| subtype1 | 2 | 21 |
| subtype2 | 8 | 58 |
| subtype3 | 3 | 63 |
Figure S23. Get High-res Image Clustering Approach #4: 'RPPA cHierClus subtypes' versus Clinical Feature #5: 'RADIATIONS.RADIATION.REGIMENINDICATION'

P value = 0.0769 (Fisher's exact test), Q value = 1
Table S28. Clustering Approach #4: 'RPPA cHierClus subtypes' versus Clinical Feature #6: 'RADIATIONEXPOSURE'
| nPatients | NO | YES |
|---|---|---|
| ALL | 130 | 7 |
| subtype1 | 19 | 3 |
| subtype2 | 52 | 3 |
| subtype3 | 59 | 1 |
Figure S24. Get High-res Image Clustering Approach #4: 'RPPA cHierClus subtypes' versus Clinical Feature #6: 'RADIATIONEXPOSURE'

Table S29. Get Full Table Description of clustering approach #5: 'RNAseq CNMF subtypes'
| Cluster Labels | 1 | 2 | 3 | 4 |
|---|---|---|---|---|
| Number of samples | 64 | 22 | 47 | 65 |
P value = 100 (logrank test), Q value = 1
Table S30. Clustering Approach #5: 'RNAseq CNMF subtypes' versus Clinical Feature #1: 'Time to Death'
| nPatients | nDeath | Duration Range (Median), Month | |
|---|---|---|---|
| ALL | 198 | 1 | 0.0 - 66.1 (8.1) |
| subtype1 | 64 | 1 | 0.0 - 65.9 (6.9) |
| subtype2 | 22 | 0 | 0.1 - 66.1 (5.9) |
| subtype3 | 47 | 0 | 0.2 - 66.1 (10.3) |
| subtype4 | 65 | 0 | 0.2 - 65.9 (10.0) |
Figure S25. Get High-res Image Clustering Approach #5: 'RNAseq CNMF subtypes' versus Clinical Feature #1: 'Time to Death'

P value = 0.0108 (ANOVA), Q value = 0.39
Table S31. Clustering Approach #5: 'RNAseq CNMF subtypes' versus Clinical Feature #2: 'AGE'
| nPatients | Mean (Std.Dev) | |
|---|---|---|
| ALL | 198 | 46.7 (16.1) |
| subtype1 | 64 | 51.5 (16.3) |
| subtype2 | 22 | 44.2 (14.1) |
| subtype3 | 47 | 41.5 (13.6) |
| subtype4 | 65 | 46.7 (17.0) |
Figure S26. Get High-res Image Clustering Approach #5: 'RNAseq CNMF subtypes' versus Clinical Feature #2: 'AGE'
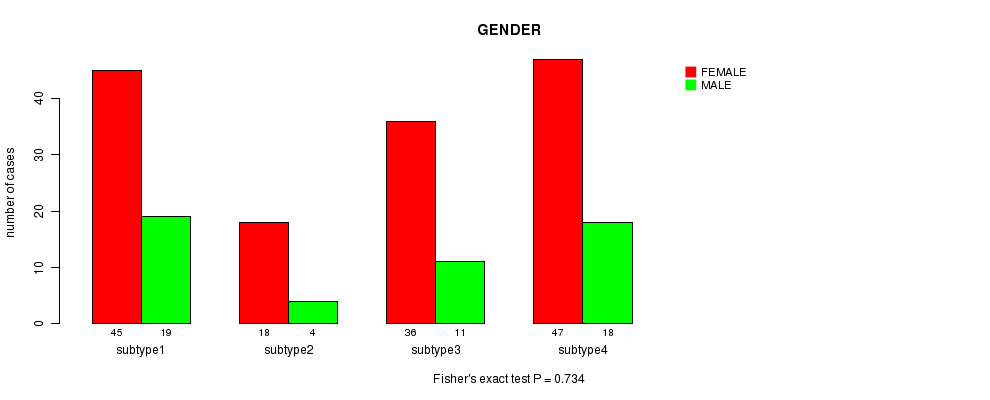
P value = 0.734 (Fisher's exact test), Q value = 1
Table S32. Clustering Approach #5: 'RNAseq CNMF subtypes' versus Clinical Feature #3: 'GENDER'
| nPatients | FEMALE | MALE |
|---|---|---|
| ALL | 146 | 52 |
| subtype1 | 45 | 19 |
| subtype2 | 18 | 4 |
| subtype3 | 36 | 11 |
| subtype4 | 47 | 18 |
Figure S27. Get High-res Image Clustering Approach #5: 'RNAseq CNMF subtypes' versus Clinical Feature #3: 'GENDER'
P value = 8.86e-17 (Chi-square test), Q value = 4.1e-15
Table S33. Clustering Approach #5: 'RNAseq CNMF subtypes' versus Clinical Feature #4: 'HISTOLOGICAL.TYPE'
| nPatients | OTHER | THYROID PAPILLARY CARCINOMA - CLASSICAL/USUAL | THYROID PAPILLARY CARCINOMA - FOLLICULAR (>= 99% FOLLICULAR PATTERNED) | THYROID PAPILLARY CARCINOMA - TALL CELL (>= 50% TALL CELL FEATURES) |
|---|---|---|---|---|
| ALL | 7 | 113 | 58 | 20 |
| subtype1 | 6 | 14 | 43 | 1 |
| subtype2 | 0 | 14 | 4 | 4 |
| subtype3 | 1 | 37 | 8 | 1 |
| subtype4 | 0 | 48 | 3 | 14 |
Figure S28. Get High-res Image Clustering Approach #5: 'RNAseq CNMF subtypes' versus Clinical Feature #4: 'HISTOLOGICAL.TYPE'

P value = 0.00383 (Fisher's exact test), Q value = 0.15
Table S34. Clustering Approach #5: 'RNAseq CNMF subtypes' versus Clinical Feature #5: 'RADIATIONS.RADIATION.REGIMENINDICATION'
| nPatients | NO | YES |
|---|---|---|
| ALL | 12 | 186 |
| subtype1 | 1 | 63 |
| subtype2 | 0 | 22 |
| subtype3 | 1 | 46 |
| subtype4 | 10 | 55 |
Figure S29. Get High-res Image Clustering Approach #5: 'RNAseq CNMF subtypes' versus Clinical Feature #5: 'RADIATIONS.RADIATION.REGIMENINDICATION'

P value = 0.664 (Fisher's exact test), Q value = 1
Table S35. Clustering Approach #5: 'RNAseq CNMF subtypes' versus Clinical Feature #6: 'RADIATIONEXPOSURE'
| nPatients | NO | YES |
|---|---|---|
| ALL | 162 | 8 |
| subtype1 | 52 | 3 |
| subtype2 | 18 | 0 |
| subtype3 | 37 | 3 |
| subtype4 | 55 | 2 |
Figure S30. Get High-res Image Clustering Approach #5: 'RNAseq CNMF subtypes' versus Clinical Feature #6: 'RADIATIONEXPOSURE'

Table S36. Get Full Table Description of clustering approach #6: 'RNAseq cHierClus subtypes'
| Cluster Labels | 1 | 2 | 3 |
|---|---|---|---|
| Number of samples | 89 | 34 | 75 |
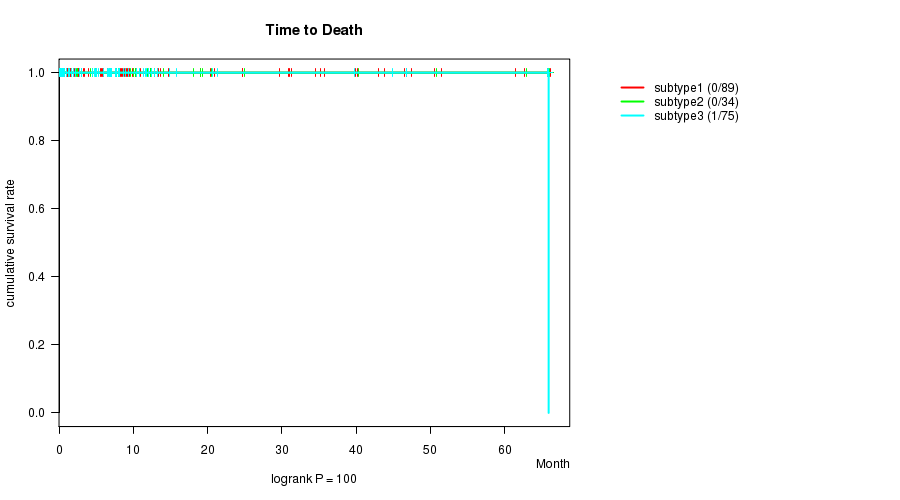
P value = 100 (logrank test), Q value = 1
Table S37. Clustering Approach #6: 'RNAseq cHierClus subtypes' versus Clinical Feature #1: 'Time to Death'
| nPatients | nDeath | Duration Range (Median), Month | |
|---|---|---|---|
| ALL | 198 | 1 | 0.0 - 66.1 (8.1) |
| subtype1 | 89 | 0 | 0.2 - 66.1 (9.3) |
| subtype2 | 34 | 0 | 0.2 - 66.1 (10.1) |
| subtype3 | 75 | 1 | 0.0 - 65.9 (6.8) |
Figure S31. Get High-res Image Clustering Approach #6: 'RNAseq cHierClus subtypes' versus Clinical Feature #1: 'Time to Death'
P value = 0.0163 (ANOVA), Q value = 0.55
Table S38. Clustering Approach #6: 'RNAseq cHierClus subtypes' versus Clinical Feature #2: 'AGE'
| nPatients | Mean (Std.Dev) | |
|---|---|---|
| ALL | 198 | 46.7 (16.1) |
| subtype1 | 89 | 46.1 (16.1) |
| subtype2 | 34 | 40.8 (15.1) |
| subtype3 | 75 | 50.2 (15.7) |
Figure S32. Get High-res Image Clustering Approach #6: 'RNAseq cHierClus subtypes' versus Clinical Feature #2: 'AGE'
P value = 0.453 (Fisher's exact test), Q value = 1
Table S39. Clustering Approach #6: 'RNAseq cHierClus subtypes' versus Clinical Feature #3: 'GENDER'
| nPatients | FEMALE | MALE |
|---|---|---|
| ALL | 146 | 52 |
| subtype1 | 65 | 24 |
| subtype2 | 28 | 6 |
| subtype3 | 53 | 22 |
Figure S33. Get High-res Image Clustering Approach #6: 'RNAseq cHierClus subtypes' versus Clinical Feature #3: 'GENDER'

P value = 6.92e-16 (Chi-square test), Q value = 3.1e-14
Table S40. Clustering Approach #6: 'RNAseq cHierClus subtypes' versus Clinical Feature #4: 'HISTOLOGICAL.TYPE'
| nPatients | OTHER | THYROID PAPILLARY CARCINOMA - CLASSICAL/USUAL | THYROID PAPILLARY CARCINOMA - FOLLICULAR (>= 99% FOLLICULAR PATTERNED) | THYROID PAPILLARY CARCINOMA - TALL CELL (>= 50% TALL CELL FEATURES) |
|---|---|---|---|---|
| ALL | 7 | 113 | 58 | 20 |
| subtype1 | 0 | 64 | 8 | 17 |
| subtype2 | 1 | 29 | 4 | 0 |
| subtype3 | 6 | 20 | 46 | 3 |
Figure S34. Get High-res Image Clustering Approach #6: 'RNAseq cHierClus subtypes' versus Clinical Feature #4: 'HISTOLOGICAL.TYPE'

P value = 0.0217 (Fisher's exact test), Q value = 0.72
Table S41. Clustering Approach #6: 'RNAseq cHierClus subtypes' versus Clinical Feature #5: 'RADIATIONS.RADIATION.REGIMENINDICATION'
| nPatients | NO | YES |
|---|---|---|
| ALL | 12 | 186 |
| subtype1 | 10 | 79 |
| subtype2 | 1 | 33 |
| subtype3 | 1 | 74 |
Figure S35. Get High-res Image Clustering Approach #6: 'RNAseq cHierClus subtypes' versus Clinical Feature #5: 'RADIATIONS.RADIATION.REGIMENINDICATION'

P value = 1 (Fisher's exact test), Q value = 1
Table S42. Clustering Approach #6: 'RNAseq cHierClus subtypes' versus Clinical Feature #6: 'RADIATIONEXPOSURE'
| nPatients | NO | YES |
|---|---|---|
| ALL | 162 | 8 |
| subtype1 | 73 | 4 |
| subtype2 | 29 | 1 |
| subtype3 | 60 | 3 |
Figure S36. Get High-res Image Clustering Approach #6: 'RNAseq cHierClus subtypes' versus Clinical Feature #6: 'RADIATIONEXPOSURE'

Table S43. Get Full Table Description of clustering approach #7: 'MIRseq CNMF subtypes'
| Cluster Labels | 1 | 2 | 3 |
|---|---|---|---|
| Number of samples | 70 | 84 | 56 |
P value = 100 (logrank test), Q value = 1
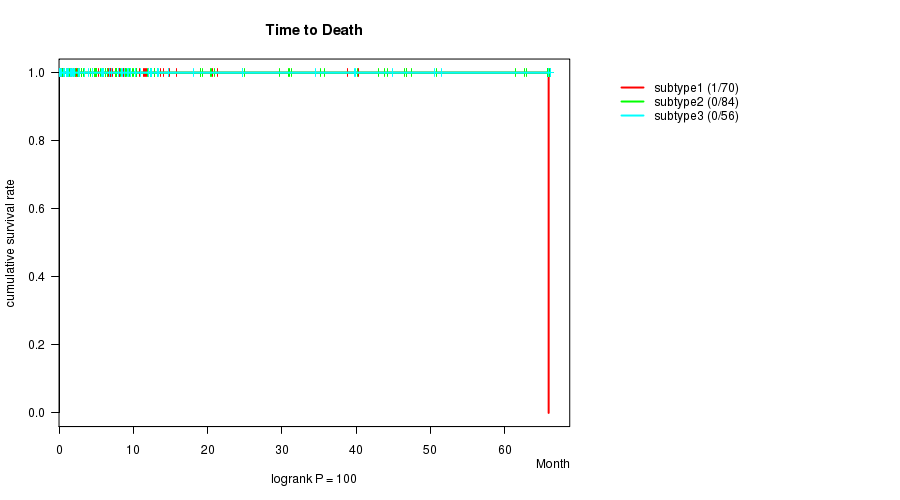
Table S44. Clustering Approach #7: 'MIRseq CNMF subtypes' versus Clinical Feature #1: 'Time to Death'
| nPatients | nDeath | Duration Range (Median), Month | |
|---|---|---|---|
| ALL | 210 | 1 | 0.0 - 66.1 (8.2) |
| subtype1 | 70 | 1 | 0.3 - 65.9 (7.2) |
| subtype2 | 84 | 0 | 0.2 - 66.1 (10.1) |
| subtype3 | 56 | 0 | 0.0 - 66.1 (8.0) |
Figure S37. Get High-res Image Clustering Approach #7: 'MIRseq CNMF subtypes' versus Clinical Feature #1: 'Time to Death'
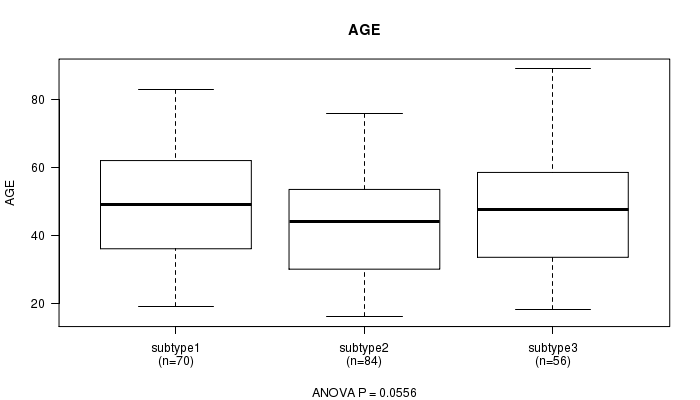
P value = 0.0556 (ANOVA), Q value = 1
Table S45. Clustering Approach #7: 'MIRseq CNMF subtypes' versus Clinical Feature #2: 'AGE'
| nPatients | Mean (Std.Dev) | |
|---|---|---|
| ALL | 210 | 46.6 (16.0) |
| subtype1 | 70 | 49.6 (16.9) |
| subtype2 | 84 | 43.5 (15.1) |
| subtype3 | 56 | 47.6 (15.4) |
Figure S38. Get High-res Image Clustering Approach #7: 'MIRseq CNMF subtypes' versus Clinical Feature #2: 'AGE'
P value = 0.335 (Fisher's exact test), Q value = 1
Table S46. Clustering Approach #7: 'MIRseq CNMF subtypes' versus Clinical Feature #3: 'GENDER'
| nPatients | FEMALE | MALE |
|---|---|---|
| ALL | 155 | 55 |
| subtype1 | 48 | 22 |
| subtype2 | 62 | 22 |
| subtype3 | 45 | 11 |
Figure S39. Get High-res Image Clustering Approach #7: 'MIRseq CNMF subtypes' versus Clinical Feature #3: 'GENDER'

P value = 6.15e-18 (Chi-square test), Q value = 2.9e-16
Table S47. Clustering Approach #7: 'MIRseq CNMF subtypes' versus Clinical Feature #4: 'HISTOLOGICAL.TYPE'
| nPatients | OTHER | THYROID PAPILLARY CARCINOMA - CLASSICAL/USUAL | THYROID PAPILLARY CARCINOMA - FOLLICULAR (>= 99% FOLLICULAR PATTERNED) | THYROID PAPILLARY CARCINOMA - TALL CELL (>= 50% TALL CELL FEATURES) |
|---|---|---|---|---|
| ALL | 8 | 116 | 64 | 22 |
| subtype1 | 6 | 15 | 48 | 1 |
| subtype2 | 2 | 64 | 10 | 8 |
| subtype3 | 0 | 37 | 6 | 13 |
Figure S40. Get High-res Image Clustering Approach #7: 'MIRseq CNMF subtypes' versus Clinical Feature #4: 'HISTOLOGICAL.TYPE'

P value = 0.468 (Fisher's exact test), Q value = 1
Table S48. Clustering Approach #7: 'MIRseq CNMF subtypes' versus Clinical Feature #5: 'RADIATIONS.RADIATION.REGIMENINDICATION'
| nPatients | NO | YES |
|---|---|---|
| ALL | 14 | 196 |
| subtype1 | 3 | 67 |
| subtype2 | 8 | 76 |
| subtype3 | 3 | 53 |
Figure S41. Get High-res Image Clustering Approach #7: 'MIRseq CNMF subtypes' versus Clinical Feature #5: 'RADIATIONS.RADIATION.REGIMENINDICATION'

P value = 1 (Fisher's exact test), Q value = 1
Table S49. Clustering Approach #7: 'MIRseq CNMF subtypes' versus Clinical Feature #6: 'RADIATIONEXPOSURE'
| nPatients | NO | YES |
|---|---|---|
| ALL | 175 | 9 |
| subtype1 | 59 | 3 |
| subtype2 | 67 | 4 |
| subtype3 | 49 | 2 |
Figure S42. Get High-res Image Clustering Approach #7: 'MIRseq CNMF subtypes' versus Clinical Feature #6: 'RADIATIONEXPOSURE'
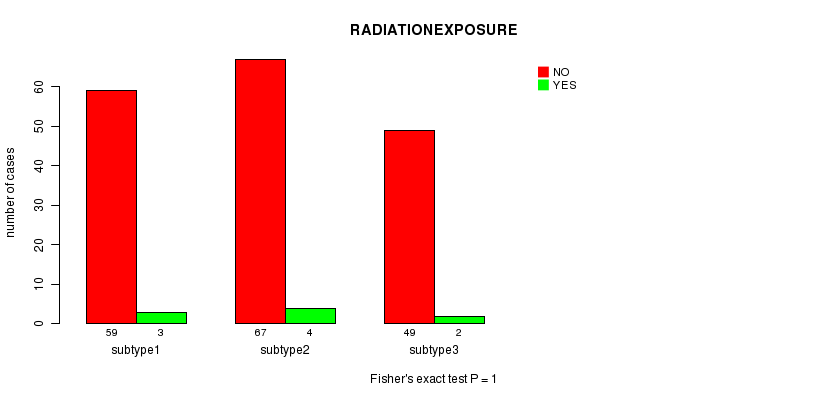
Table S50. Get Full Table Description of clustering approach #8: 'MIRseq cHierClus subtypes'
| Cluster Labels | 1 | 2 | 3 |
|---|---|---|---|
| Number of samples | 62 | 63 | 85 |
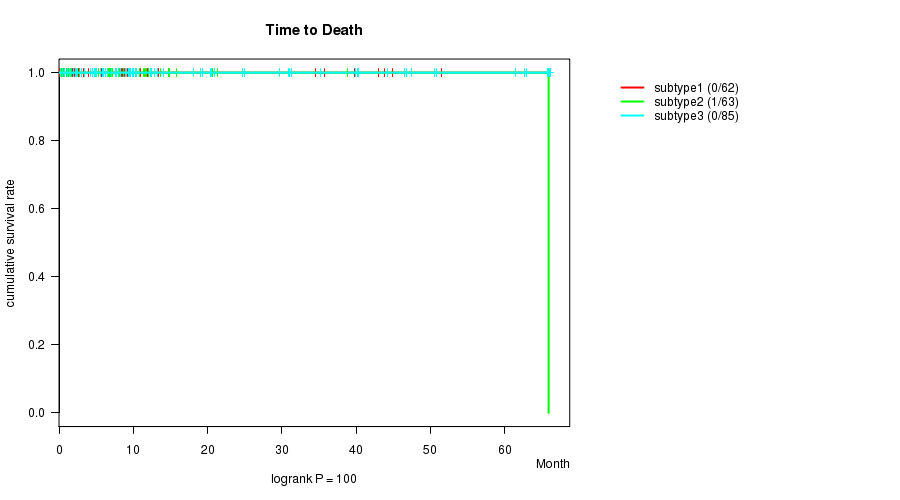
P value = 100 (logrank test), Q value = 1
Table S51. Clustering Approach #8: 'MIRseq cHierClus subtypes' versus Clinical Feature #1: 'Time to Death'
| nPatients | nDeath | Duration Range (Median), Month | |
|---|---|---|---|
| ALL | 210 | 1 | 0.0 - 66.1 (8.2) |
| subtype1 | 62 | 0 | 0.0 - 66.1 (8.0) |
| subtype2 | 63 | 1 | 0.3 - 65.9 (7.1) |
| subtype3 | 85 | 0 | 0.2 - 66.1 (10.0) |
Figure S43. Get High-res Image Clustering Approach #8: 'MIRseq cHierClus subtypes' versus Clinical Feature #1: 'Time to Death'
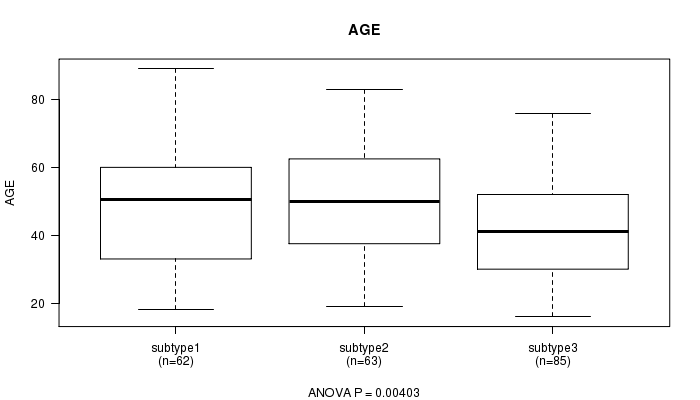
P value = 0.00403 (ANOVA), Q value = 0.15
Table S52. Clustering Approach #8: 'MIRseq cHierClus subtypes' versus Clinical Feature #2: 'AGE'
| nPatients | Mean (Std.Dev) | |
|---|---|---|
| ALL | 210 | 46.6 (16.0) |
| subtype1 | 62 | 48.4 (16.2) |
| subtype2 | 63 | 50.6 (16.2) |
| subtype3 | 85 | 42.3 (14.6) |
Figure S44. Get High-res Image Clustering Approach #8: 'MIRseq cHierClus subtypes' versus Clinical Feature #2: 'AGE'
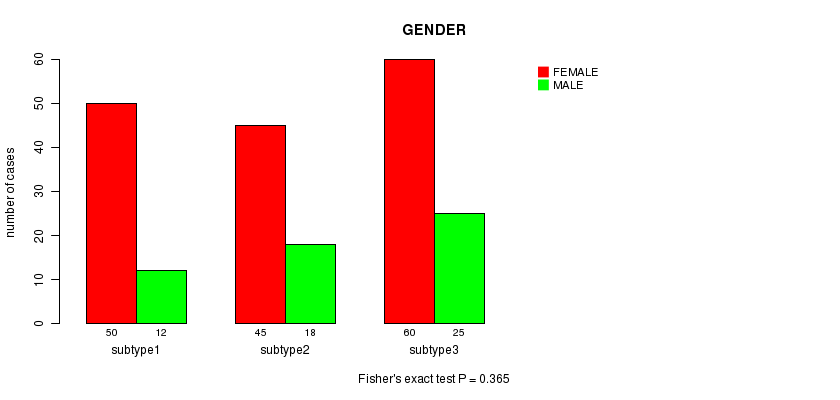
P value = 0.365 (Fisher's exact test), Q value = 1
Table S53. Clustering Approach #8: 'MIRseq cHierClus subtypes' versus Clinical Feature #3: 'GENDER'
| nPatients | FEMALE | MALE |
|---|---|---|
| ALL | 155 | 55 |
| subtype1 | 50 | 12 |
| subtype2 | 45 | 18 |
| subtype3 | 60 | 25 |
Figure S45. Get High-res Image Clustering Approach #8: 'MIRseq cHierClus subtypes' versus Clinical Feature #3: 'GENDER'
P value = 6.25e-20 (Chi-square test), Q value = 3e-18
Table S54. Clustering Approach #8: 'MIRseq cHierClus subtypes' versus Clinical Feature #4: 'HISTOLOGICAL.TYPE'
| nPatients | OTHER | THYROID PAPILLARY CARCINOMA - CLASSICAL/USUAL | THYROID PAPILLARY CARCINOMA - FOLLICULAR (>= 99% FOLLICULAR PATTERNED) | THYROID PAPILLARY CARCINOMA - TALL CELL (>= 50% TALL CELL FEATURES) |
|---|---|---|---|---|
| ALL | 8 | 116 | 64 | 22 |
| subtype1 | 0 | 39 | 7 | 16 |
| subtype2 | 6 | 11 | 45 | 1 |
| subtype3 | 2 | 66 | 12 | 5 |
Figure S46. Get High-res Image Clustering Approach #8: 'MIRseq cHierClus subtypes' versus Clinical Feature #4: 'HISTOLOGICAL.TYPE'

P value = 0.0388 (Fisher's exact test), Q value = 1
Table S55. Clustering Approach #8: 'MIRseq cHierClus subtypes' versus Clinical Feature #5: 'RADIATIONS.RADIATION.REGIMENINDICATION'
| nPatients | NO | YES |
|---|---|---|
| ALL | 14 | 196 |
| subtype1 | 3 | 59 |
| subtype2 | 1 | 62 |
| subtype3 | 10 | 75 |
Figure S47. Get High-res Image Clustering Approach #8: 'MIRseq cHierClus subtypes' versus Clinical Feature #5: 'RADIATIONS.RADIATION.REGIMENINDICATION'

P value = 0.834 (Fisher's exact test), Q value = 1
Table S56. Clustering Approach #8: 'MIRseq cHierClus subtypes' versus Clinical Feature #6: 'RADIATIONEXPOSURE'
| nPatients | NO | YES |
|---|---|---|
| ALL | 175 | 9 |
| subtype1 | 56 | 2 |
| subtype2 | 52 | 3 |
| subtype3 | 67 | 4 |
Figure S48. Get High-res Image Clustering Approach #8: 'MIRseq cHierClus subtypes' versus Clinical Feature #6: 'RADIATIONEXPOSURE'

-
Cluster data file = THCA-TP.mergedcluster.txt
-
Clinical data file = THCA-TP.clin.merged.picked.txt
-
Number of patients = 218
-
Number of clustering approaches = 8
-
Number of selected clinical features = 6
-
Exclude small clusters that include fewer than K patients, K = 3
consensus non-negative matrix factorization clustering approach (Brunet et al. 2004)
Resampling-based clustering method (Monti et al. 2003)
For survival clinical features, the Kaplan-Meier survival curves of tumors with and without gene mutations were plotted and the statistical significance P values were estimated by logrank test (Bland and Altman 2004) using the 'survdiff' function in R
For continuous numerical clinical features, one-way analysis of variance (Howell 2002) was applied to compare the clinical values between tumor subtypes using 'anova' function in R
For binary clinical features, two-tailed Fisher's exact tests (Fisher 1922) were used to estimate the P values using the 'fisher.test' function in R
For multi-class clinical features (nominal or ordinal), Chi-square tests (Greenwood and Nikulin 1996) were used to estimate the P values using the 'chisq.test' function in R
For multiple hypothesis correction, Q value is the False Discovery Rate (FDR) analogue of the P value (Benjamini and Hochberg 1995), defined as the minimum FDR at which the test may be called significant. We used the 'Benjamini and Hochberg' method of 'p.adjust' function in R to convert P values into Q values.
This is an experimental feature. The full results of the analysis summarized in this report can be downloaded from the TCGA Data Coordination Center.