(primary solid tumor cohort)
This report serves to describe the mutational landscape and properties of a given individual set, as well as rank genes and genesets according to mutational significance. MutSig v2.0 was used to generate the results found in this report.
-
Working with individual set: UCEC-TP
-
Number of patients in set: 248
The input for this pipeline is a set of individuals with the following files associated for each:
-
An annotated .maf file describing the mutations called for the respective individual, and their properties.
-
A .wig file that contains information about the coverage of the sample.
-
MAF used for this analysis:UCEC-TP.final_analysis_set.maf
-
Significantly mutated genes (q ≤ 0.1): 36
-
Mutations seen in COSMIC: 1007
-
Significantly mutated genes in COSMIC territory: 47
-
Genes with clustered mutations (≤ 3 aa apart): 4496
-
Significantly mutated genesets: 68
-
Significantly mutated genesets: (excluding sig. mutated genes):0
-
Read 248 MAFs of type "WashU"
-
Total number of mutations in input MAFs: 184824
-
After removing 118 mutations outside chr1-24: 184706
-
After removing 211 blacklisted mutations: 184495
-
After removing 1932 noncoding mutations: 182563
-
After collapsing adjacent/redundant mutations: 182433
-
Number of mutations before filtering: 182433
-
After removing 8662 mutations outside gene set: 173771
-
After removing 1038 mutations outside category set: 172733
Table 1. Get Full Table Table representing breakdown of mutations by type.
| type | count |
|---|---|
| Frame_Shift_Del | 1059 |
| Frame_Shift_Ins | 461 |
| In_Frame_Del | 710 |
| In_Frame_Ins | 136 |
| Missense_Mutation | 115564 |
| Nonsense_Mutation | 11935 |
| Nonstop_Mutation | 138 |
| Silent | 40083 |
| Splice_Site | 2647 |
| Total | 172733 |
Table 2. Get Full Table A breakdown of mutation rates per category discovered for this individual set.
| category | n | N | rate | rate_per_mb | relative_rate | exp_ns_s_ratio |
|---|---|---|---|---|---|---|
| *CpG->T | 38697 | 409266464 | 0.000095 | 95 | 5.4 | 2.1 |
| *Cp(A/C/T)->mut | 51438 | 3453658664 | 0.000015 | 15 | 0.85 | 3.3 |
| A->mut | 24335 | 3744388816 | 6.5e-06 | 6.5 | 0.37 | 3.9 |
| *CpG->(G/A) | 1084 | 409266464 | 2.6e-06 | 2.6 | 0.15 | 2.7 |
| indel+null | 16212 | 7607313944 | 2.1e-06 | 2.1 | 0.12 | NaN |
| double_null | 884 | 7607313944 | 1.2e-07 | 0.12 | 0.0067 | NaN |
| Total | 132650 | 7607313944 | 0.000017 | 17 | 1 | 3.5 |
The x axis represents the samples. The y axis represents the exons, one row per exon, and they are sorted by average coverage across samples. For exons with exactly the same average coverage, they are sorted next by the %GC of the exon. (The secondary sort is especially useful for the zero-coverage exons at the bottom).
Figure 1.
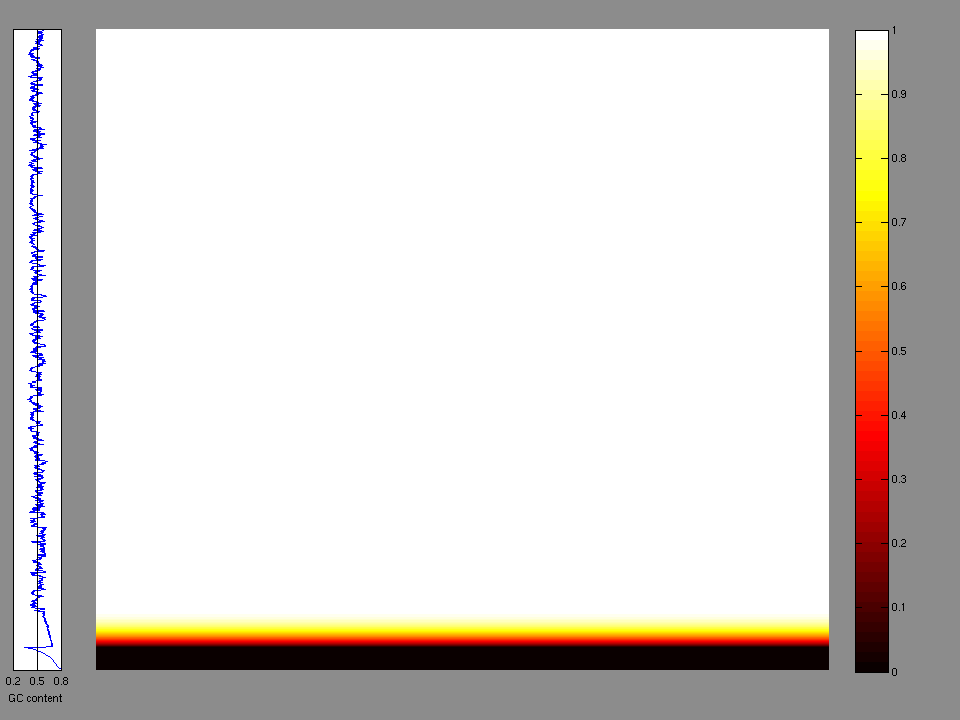
Figure 2. Patients counts and rates file used to generate this plot: UCEC-TP.patients.counts_and_rates.txt
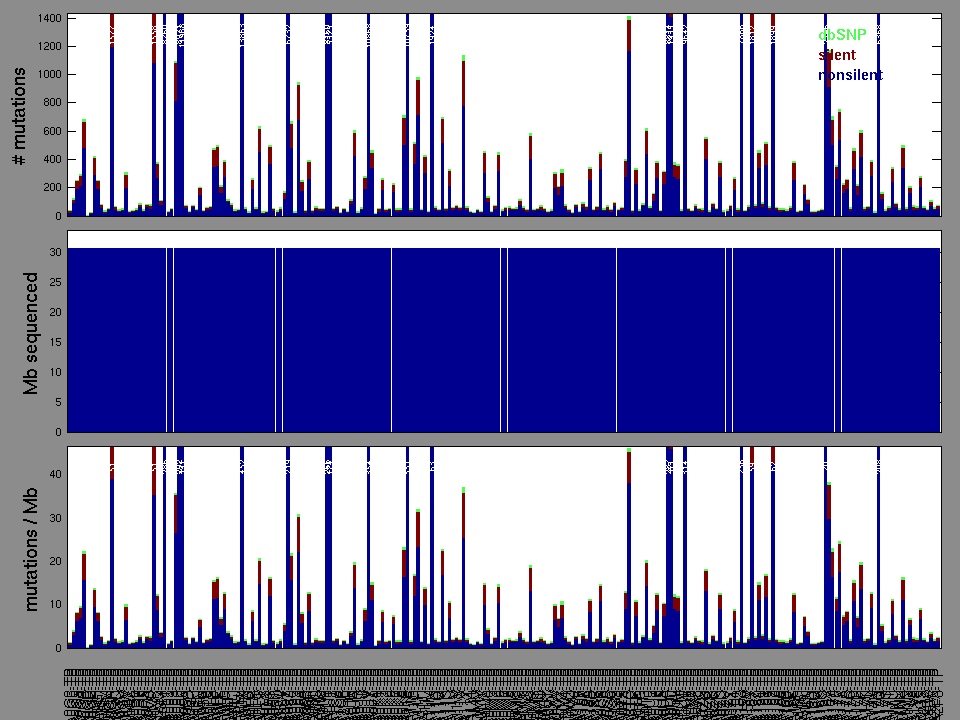
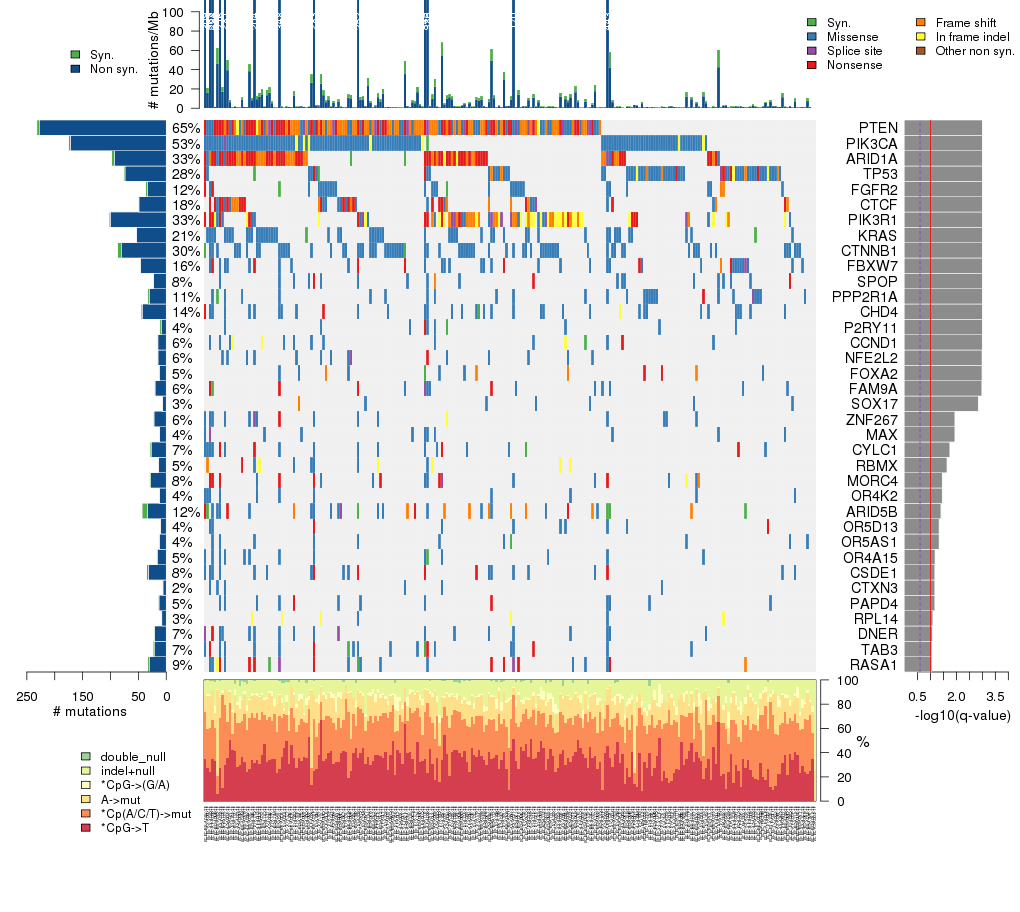
Figure 3. Get High-res Image The matrix in the center of the figure represents individual mutations in patient samples, color-coded by type of mutation, for the significantly mutated genes. The rate of synonymous and non-synonymous mutations is displayed at the top of the matrix. The barplot on the left of the matrix shows the number of mutations in each gene. The percentages represent the fraction of tumors with at least one mutation in the specified gene. The barplot to the right of the matrix displays the q-values for the most significantly mutated genes. The purple boxplots below the matrix (only displayed if required columns are present in the provided MAF) represent the distributions of allelic fractions observed in each sample. The plot at the bottom represents the base substitution distribution of individual samples, using the same categories that were used to calculate significance.
Column Descriptions:
-
N = number of sequenced bases in this gene across the individual set
-
n = number of (nonsilent) mutations in this gene across the individual set
-
npat = number of patients (individuals) with at least one nonsilent mutation
-
nsite = number of unique sites having a non-silent mutation
-
nsil = number of silent mutations in this gene across the individual set
-
n1 = number of nonsilent mutations of type: *CpG->T
-
n2 = number of nonsilent mutations of type: *Cp(A/C/T)->mut
-
n3 = number of nonsilent mutations of type: A->mut
-
n4 = number of nonsilent mutations of type: *CpG->(G/A)
-
n5 = number of nonsilent mutations of type: indel+null
-
n6 = number of nonsilent mutations of type: double_null
-
p_classic = p-value for the observed amount of nonsilent mutations being elevated in this gene
-
p_ns_s = p-value for the observed nonsilent/silent ratio being elevated in this gene
-
p_cons = p-value for enrichment of mutations at evolutionarily most-conserved sites in gene
-
p_joint = p-value for clustering + conservation
-
p = p-value (overall)
-
q = q-value, False Discovery Rate (Benjamini-Hochberg procedure)
Table 3. Get Full Table A Ranked List of Significantly Mutated Genes. Number of significant genes found: 36. Number of genes displayed: 35. Click on a gene name to display its stick figure depicting the distribution of mutations and mutation types across the chosen gene (this feature may not be available for all significant genes).
| rank | gene | description | N | n | npat | nsite | nsil | n1 | n2 | n3 | n4 | n5 | n6 | p_classic | p_ns_s | p_cons | p_joint | p | q |
|---|---|---|---|---|---|---|---|---|---|---|---|---|---|---|---|---|---|---|---|
| 1 | PTEN | phosphatase and tensin homolog (mutated in multiple advanced cancers 1) | 309504 | 227 | 161 | 134 | 5 | 19 | 29 | 21 | 33 | 98 | 27 | <1.00e-15 | 4.9e-12 | NaN | NaN | <1.00e-15 | <3.66e-12 |
| 2 | PIK3CA | phosphoinositide-3-kinase, catalytic, alpha polypeptide | 815176 | 172 | 132 | 76 | 3 | 31 | 61 | 68 | 3 | 9 | 0 | <1.00e-15 | 2.1e-11 | NaN | NaN | <1.00e-15 | <3.66e-12 |
| 3 | ARID1A | AT rich interactive domain 1A (SWI-like) | 1428976 | 93 | 83 | 78 | 5 | 2 | 7 | 5 | 1 | 64 | 14 | <1.00e-15 | 0.00014 | NaN | NaN | <1.00e-15 | <3.66e-12 |
| 4 | TP53 | tumor protein p53 | 317688 | 74 | 69 | 50 | 2 | 23 | 18 | 15 | 1 | 17 | 0 | <1.00e-15 | 2.8e-06 | NaN | NaN | <1.00e-15 | <3.66e-12 |
| 5 | FGFR2 | fibroblast growth factor receptor 2 (bacteria-expressed kinase, keratinocyte growth factor receptor, craniofacial dysostosis 1, Crouzon syndrome, Pfeiffer syndrome, Jackson-Weiss syndrome) | 691920 | 34 | 31 | 19 | 3 | 3 | 5 | 13 | 9 | 3 | 1 | <1.00e-15 | 0.0097 | NaN | NaN | <1.00e-15 | <3.66e-12 |
| 6 | CTCF | CCCTC-binding factor (zinc finger protein) | 551552 | 49 | 45 | 39 | 1 | 8 | 4 | 7 | 0 | 28 | 2 | 1.55e-15 | 0.00095 | NaN | NaN | 1.55e-15 | 4.74e-12 |
| 7 | PIK3R1 | phosphoinositide-3-kinase, regulatory subunit 1 (alpha) | 585280 | 100 | 83 | 77 | 2 | 4 | 4 | 13 | 1 | 63 | 15 | 1.89e-15 | 0.0021 | NaN | NaN | 1.89e-15 | 4.82e-12 |
| 8 | KRAS | v-Ki-ras2 Kirsten rat sarcoma viral oncogene homolog | 175336 | 53 | 53 | 12 | 1 | 2 | 46 | 4 | 1 | 0 | 0 | 2.11e-15 | 0.0012 | NaN | NaN | 2.11e-15 | 4.82e-12 |
| 9 | CTNNB1 | catenin (cadherin-associated protein), beta 1, 88kDa | 595696 | 80 | 74 | 25 | 7 | 5 | 61 | 14 | 0 | 0 | 0 | 4.11e-15 | 0.0034 | NaN | NaN | 4.11e-15 | 8.35e-12 |
| 10 | FBXW7 | F-box and WD repeat domain containing 7 | 640832 | 46 | 39 | 30 | 1 | 22 | 12 | 2 | 1 | 8 | 1 | 4.88e-15 | 0.00048 | NaN | NaN | 4.88e-15 | 8.93e-12 |
| 11 | SPOP | speckle-type POZ protein | 287928 | 23 | 21 | 18 | 0 | 5 | 8 | 6 | 0 | 4 | 0 | 1.28e-14 | 0.0041 | NaN | NaN | 1.28e-14 | 2.12e-11 |
| 12 | PPP2R1A | protein phosphatase 2 (formerly 2A), regulatory subunit A , alpha isoform | 453840 | 30 | 27 | 18 | 3 | 10 | 17 | 1 | 0 | 2 | 0 | 5.75e-14 | 0.0023 | NaN | NaN | 5.75e-14 | 8.76e-11 |
| 13 | CHD4 | chromodomain helicase DNA binding protein 4 | 1460720 | 43 | 35 | 38 | 2 | 16 | 16 | 8 | 0 | 2 | 1 | 1.45e-11 | 0.0046 | NaN | NaN | 1.45e-11 | 2.05e-08 |
| 14 | P2RY11 | purinergic receptor P2Y, G-protein coupled, 11 | 5704 | 9 | 9 | 9 | 3 | 3 | 4 | 0 | 1 | 1 | 0 | 2.14e-11 | 0.3 | NaN | NaN | 2.14e-11 | 2.79e-08 |
| 15 | CCND1 | cyclin D1 | 222952 | 15 | 15 | 13 | 1 | 1 | 7 | 3 | 0 | 4 | 0 | 7.28e-09 | 0.084 | NaN | NaN | 7.28e-09 | 8.87e-06 |
| 16 | NFE2L2 | nuclear factor (erythroid-derived 2)-like 2 | 449872 | 15 | 15 | 12 | 0 | 2 | 3 | 5 | 3 | 2 | 0 | 2.69e-08 | 0.016 | NaN | NaN | 2.69e-08 | 3.07e-05 |
| 17 | FOXA2 | forkhead box A2 | 227912 | 12 | 12 | 12 | 1 | 1 | 3 | 2 | 0 | 6 | 0 | 3.43e-08 | 0.27 | NaN | NaN | 3.43e-08 | 3.69e-05 |
| 18 | FAM9A | family with sequence similarity 9, member A | 255688 | 20 | 14 | 20 | 1 | 2 | 12 | 1 | 0 | 4 | 1 | 7.26e-08 | 0.096 | NaN | NaN | 7.26e-08 | 7.38e-05 |
| 19 | SOX17 | SRY (sex determining region Y)-box 17 | 91512 | 7 | 7 | 3 | 0 | 0 | 6 | 0 | 0 | 1 | 0 | 4.29e-07 | 0.15 | NaN | NaN | 4.29e-07 | 0.000412 |
| 20 | ZNF267 | zinc finger protein 267 | 557504 | 22 | 16 | 19 | 1 | 10 | 5 | 3 | 1 | 3 | 0 | 1.16e-05 | 0.13 | NaN | NaN | 1.16e-05 | 0.0105 |
| 21 | MAX | MYC associated factor X | 209064 | 12 | 11 | 8 | 0 | 3 | 3 | 5 | 0 | 1 | 0 | 1.20e-05 | 0.048 | NaN | NaN | 1.20e-05 | 0.0105 |
| 22 | CYLC1 | cylicin, basic protein of sperm head cytoskeleton 1 | 490048 | 27 | 18 | 27 | 2 | 0 | 16 | 7 | 0 | 4 | 0 | 2.06e-05 | 0.13 | NaN | NaN | 2.06e-05 | 0.0171 |
| 23 | RBMX | RNA binding motif protein, X-linked | 313224 | 14 | 13 | 8 | 0 | 1 | 4 | 2 | 0 | 7 | 0 | 2.77e-05 | 0.3 | NaN | NaN | 2.77e-05 | 0.0220 |
| 24 | MORC4 | MORC family CW-type zinc finger 4 | 685472 | 28 | 20 | 26 | 2 | 6 | 10 | 1 | 0 | 11 | 0 | 4.53e-05 | 0.083 | NaN | NaN | 4.53e-05 | 0.0340 |
| 25 | OR4K2 | olfactory receptor, family 4, subfamily K, member 2 | 235352 | 12 | 11 | 12 | 0 | 1 | 8 | 3 | 0 | 0 | 0 | 4.65e-05 | 0.028 | NaN | NaN | 4.65e-05 | 0.0340 |
| 26 | ARID5B | AT rich interactive domain 5B (MRF1-like) | 894536 | 34 | 29 | 34 | 9 | 5 | 5 | 8 | 2 | 13 | 1 | 5.47e-05 | 0.57 | NaN | NaN | 5.47e-05 | 0.0385 |
| 27 | OR5D13 | olfactory receptor, family 5, subfamily D, member 13 | 235104 | 10 | 10 | 9 | 0 | 2 | 4 | 2 | 0 | 2 | 0 | 6.69e-05 | 0.06 | NaN | NaN | 6.69e-05 | 0.0453 |
| 28 | OR5AS1 | olfactory receptor, family 5, subfamily AS, member 1 | 242296 | 12 | 10 | 12 | 1 | 1 | 7 | 4 | 0 | 0 | 0 | 6.96e-05 | 0.15 | NaN | NaN | 6.96e-05 | 0.0454 |
| 29 | OR4A15 | olfactory receptor, family 4, subfamily A, member 15 | 257424 | 16 | 13 | 16 | 1 | 1 | 10 | 5 | 0 | 0 | 0 | 0.000103 | 0.065 | NaN | NaN | 0.000103 | 0.0652 |
| 30 | CSDE1 | cold shock domain containing E1, RNA-binding | 647528 | 32 | 21 | 28 | 3 | 12 | 9 | 5 | 1 | 5 | 0 | 0.000112 | 0.066 | NaN | NaN | 0.000112 | 0.0679 |
| 31 | CTXN3 | cortexin 3 | 62000 | 6 | 6 | 6 | 0 | 1 | 4 | 0 | 1 | 0 | 0 | 0.000117 | 0.21 | NaN | NaN | 0.000117 | 0.0679 |
| 32 | PAPD4 | PAP associated domain containing 4 | 374728 | 13 | 13 | 13 | 1 | 3 | 5 | 3 | 0 | 2 | 0 | 0.000119 | 0.26 | NaN | NaN | 0.000119 | 0.0679 |
| 33 | RPL14 | ribosomal protein L14 | 168392 | 8 | 7 | 4 | 0 | 0 | 1 | 0 | 2 | 5 | 0 | 0.000144 | 0.36 | NaN | NaN | 0.000144 | 0.0799 |
| 34 | DNER | delta/notch-like EGF repeat containing | 492528 | 21 | 18 | 20 | 1 | 4 | 9 | 5 | 0 | 3 | 0 | 0.000155 | 0.01 | NaN | NaN | 0.000155 | 0.0835 |
| 35 | TAB3 | TGF-beta activated kinase 1/MAP3K7 binding protein 3 | 537416 | 21 | 18 | 21 | 2 | 2 | 11 | 4 | 0 | 3 | 1 | 0.000171 | 0.18 | NaN | NaN | 0.000171 | 0.0877 |
In this analysis, COSMIC is used as a filter to increase power by restricting the territory of each gene. Cosmic version: v48.
Table 4. Get Full Table Significantly mutated genes (COSMIC territory only). To access the database please go to: COSMIC. Number of significant genes found: 47. Number of genes displayed: 10
| rank | gene | description | n | cos | n_cos | N_cos | cos_ev | p | q |
|---|---|---|---|---|---|---|---|---|---|
| 1 | PIK3R1 | phosphoinositide-3-kinase, regulatory subunit 1 (alpha) | 100 | 33 | 39 | 8184 | 111 | 0 | 0 |
| 2 | KRAS | v-Ki-ras2 Kirsten rat sarcoma viral oncogene homolog | 53 | 52 | 49 | 12896 | 556649 | 0 | 0 |
| 3 | PIK3CA | phosphoinositide-3-kinase, catalytic, alpha polypeptide | 172 | 220 | 150 | 54560 | 35669 | 0 | 0 |
| 4 | CTNNB1 | catenin (cadherin-associated protein), beta 1, 88kDa | 80 | 138 | 67 | 34224 | 23813 | 0 | 0 |
| 5 | FGFR2 | fibroblast growth factor receptor 2 (bacteria-expressed kinase, keratinocyte growth factor receptor, craniofacial dysostosis 1, Crouzon syndrome, Pfeiffer syndrome, Jackson-Weiss syndrome) | 34 | 51 | 24 | 12648 | 113 | 0 | 0 |
| 6 | FBXW7 | F-box and WD repeat domain containing 7 | 46 | 91 | 29 | 22568 | 852 | 0 | 0 |
| 7 | PTEN | phosphatase and tensin homolog (mutated in multiple advanced cancers 1) | 227 | 767 | 218 | 190216 | 14940 | 0 | 0 |
| 8 | TP53 | tumor protein p53 | 74 | 356 | 72 | 88288 | 24186 | 0 | 0 |
| 9 | NRAS | neuroblastoma RAS viral (v-ras) oncogene homolog | 9 | 33 | 6 | 8184 | 6490 | 1e-08 | 5.2e-06 |
| 10 | RB1 | retinoblastoma 1 (including osteosarcoma) | 26 | 267 | 11 | 66216 | 30 | 4.2e-08 | 0.000019 |
Note:
n - number of (nonsilent) mutations in this gene across the individual set.
cos = number of unique mutated sites in this gene in COSMIC
n_cos = overlap between n and cos.
N_cos = number of individuals times cos.
cos_ev = total evidence: number of reports in COSMIC for mutations seen in this gene.
p = p-value for seeing the observed amount of overlap in this gene)
q = q-value, False Discovery Rate (Benjamini-Hochberg procedure)
Table 5. Get Full Table Genes with Clustered Mutations
| num | gene | desc | n | mindist | nmuts0 | nmuts3 | nmuts12 | npairs0 | npairs3 | npairs12 |
|---|---|---|---|---|---|---|---|---|---|---|
| 11544 | PTEN | phosphatase and tensin homolog (mutated in multiple advanced cancers 1) | 226 | 0 | 1515 | 1989 | 2858 | 1515 | 1989 | 2858 |
| 7586 | KRAS | v-Ki-ras2 Kirsten rat sarcoma viral oncogene homolog | 52 | 0 | 661 | 949 | 994 | 661 | 949 | 994 |
| 10787 | PIK3CA | phosphoinositide-3-kinase, catalytic, alpha polypeptide | 172 | 0 | 573 | 1075 | 1553 | 573 | 1075 | 1553 |
| 3512 | CTNNB1 | catenin (cadherin-associated protein), beta 1, 88kDa | 80 | 0 | 434 | 1165 | 2176 | 434 | 1165 | 2176 |
| 14922 | TP53 | tumor protein p53 | 74 | 0 | 89 | 167 | 417 | 89 | 167 | 417 |
| 5239 | FGFR2 | fibroblast growth factor receptor 2 (bacteria-expressed kinase, keratinocyte growth factor receptor, craniofacial dysostosis 1, Crouzon syndrome, Pfeiffer syndrome, Jackson-Weiss syndrome) | 34 | 0 | 56 | 56 | 78 | 56 | 56 | 78 |
| 5150 | FBXW7 | F-box and WD repeat domain containing 7 | 46 | 0 | 50 | 53 | 68 | 50 | 53 | 68 |
| 11056 | POLE | polymerase (DNA directed), epsilon | 47 | 0 | 39 | 42 | 60 | 39 | 42 | 60 |
| 11226 | PPP2R1A | protein phosphatase 2 (formerly 2A), regulatory subunit A , alpha isoform | 30 | 0 | 37 | 48 | 77 | 37 | 48 | 77 |
| 15258 | TTN | titin | 523 | 0 | 35 | 53 | 102 | 35 | 53 | 102 |
Note:
n - number of mutations in this gene in the individual set.
mindist - distance (in aa) between closest pair of mutations in this gene
npairs3 - how many pairs of mutations are within 3 aa of each other.
npairs12 - how many pairs of mutations are within 12 aa of each other.
Table 6. Get Full Table A Ranked List of Significantly Mutated Genesets. (Source: MSigDB GSEA Cannonical Pathway Set).Number of significant genesets found: 68. Number of genesets displayed: 10
| rank | geneset | description | genes | N_genes | mut_tally | N | n | npat | nsite | nsil | n1 | n2 | n3 | n4 | n5 | n6 | p_ns_s | p | q |
|---|---|---|---|---|---|---|---|---|---|---|---|---|---|---|---|---|---|---|---|
| 1 | ARFPATHWAY | Cyclin-dependent kinase inhibitor 2A is a tumor suppressor that induces G1 arrest and can activate the p53 pathway, leading to G2/M arrest. | ABL1, CDKN2A, E2F1, MDM2, MYC, PIK3CA, PIK3R1, POLR1A, POLR1B, POLR1C, POLR1D, RAC1, RB1, TBX2, TP53, TWIST1 | 16 | ABL1(8), CDKN2A(2), E2F1(9), MDM2(4), MYC(8), PIK3CA(172), PIK3R1(100), POLR1A(16), POLR1B(16), POLR1C(2), POLR1D(3), RAC1(1), RB1(26), TBX2(2), TP53(74), TWIST1(1) | 7247552 | 444 | 223 | 300 | 50 | 87 | 115 | 119 | 6 | 99 | 18 | 3.94e-10 | <1.00e-15 | <4.11e-14 |
| 2 | EIF4PATHWAY | The eIF-4F complex recognizes 5' mRNA caps, recruits RNA helicases, and maintains mRNA-ribosome bridging. | AKT1, EIF4A1, EIF4A2, EIF4E, EIF4EBP1, EIF4G1, EIF4G2, EIF4G3, FRAP1, GHR, IRS1, MAPK1, MAPK14, MAPK3, MKNK1, PABPC1, PDK2, PDPK1, PIK3CA, PIK3R1, PRKCA, PRKCB1, PTEN, RPS6KB1 | 22 | AKT1(4), EIF4A1(5), EIF4A2(9), EIF4E(2), EIF4G1(15), EIF4G2(7), EIF4G3(24), GHR(8), IRS1(13), MAPK1(2), MAPK14(4), MAPK3(3), MKNK1(3), PABPC1(11), PDK2(5), PDPK1(3), PIK3CA(172), PIK3R1(100), PRKCA(10), PTEN(227), RPS6KB1(5) | 10435840 | 632 | 216 | 418 | 49 | 91 | 134 | 133 | 39 | 191 | 44 | <1.00e-15 | <1.00e-15 | <4.11e-14 |
| 3 | GSK3PATHWAY | Bacterial lipopolysaccharide activates AKT to promote the survival and activation of macrophages and inhibits Gsk3-beta to promote beta-catenin accumulation in the nucleus. | AKT1, APC, AXIN1, CCND1, CD14, CTNNB1, DVL1, FZD1, GJA1, GNAI1, GSK3B, IRAK1, LBP, LEF1, LY96, MYD88, NFKB1, PDPK1, PIK3CA, PIK3R1, PPP2CA, PRKR, RELA, TIRAP, TLR4, TOLLIP, WNT1 | 26 | AKT1(4), APC(56), AXIN1(9), CCND1(15), CD14(2), CTNNB1(80), DVL1(3), FZD1(3), GJA1(5), GNAI1(5), GSK3B(13), IRAK1(4), LBP(3), LEF1(9), LY96(4), MYD88(3), NFKB1(10), PDPK1(3), PIK3CA(172), PIK3R1(100), PPP2CA(6), RELA(6), TIRAP(2), TLR4(17), TOLLIP(1), WNT1(1) | 11218032 | 536 | 210 | 356 | 58 | 77 | 201 | 122 | 6 | 110 | 20 | 9.76e-14 | <1.00e-15 | <4.11e-14 |
| 4 | SA_PTEN_PATHWAY | PTEN is a tumor suppressor that dephosphorylates the lipid messenger phosphatidylinositol triphosphate. | AKT1, AKT2, AKT3, BPNT1, GRB2, ILK, MAPK1, MAPK3, PDK1, PIK3CA, PIK3CD, PIP3-E, PTEN, PTK2B, RBL2, SHC1, SOS1 | 16 | AKT1(4), AKT2(6), AKT3(11), BPNT1(3), GRB2(3), ILK(5), MAPK1(2), MAPK3(3), PDK1(2), PIK3CA(172), PIK3CD(12), PTEN(227), PTK2B(16), RBL2(19), SHC1(7), SOS1(13) | 7530768 | 505 | 208 | 307 | 39 | 91 | 126 | 107 | 36 | 117 | 28 | <1.00e-15 | <1.00e-15 | <4.11e-14 |
| 5 | HDACPATHWAY | Myocyte enhancer factor MEF2 activates transcription of genes required for muscle cell differentiation and is inhibited by histone deacetylases. | AKT1, AVP, CABIN1, CALM1, CALM2, CALM3, CAMK1, CAMK1G, HDAC5, IGF1, IGF1R, INS, INSR, MAP2K6, MAPK14, MAPK7, MEF2A, MEF2B, MEF2C, MEF2D, MYOD1, NFATC1, NFATC2, PIK3CA, PIK3R1, PPP3CA, PPP3CB, PPP3CC, SYT1, YWHAH | 28 | AKT1(4), CABIN1(19), CALM1(2), CALM2(4), CAMK1(2), CAMK1G(5), HDAC5(12), IGF1(5), IGF1R(13), INS(3), INSR(18), MAP2K6(10), MAPK14(4), MAPK7(14), MEF2A(3), MEF2B(1), MEF2C(11), MEF2D(7), NFATC1(10), NFATC2(13), PIK3CA(172), PIK3R1(100), PPP3CA(4), PPP3CB(5), PPP3CC(6), SYT1(4), YWHAH(3) | 12782416 | 454 | 202 | 331 | 71 | 109 | 116 | 116 | 8 | 90 | 15 | 1.34e-07 | <1.00e-15 | <4.11e-14 |
| 6 | INSULINPATHWAY | Insulin regulates glucose levels via Ras-mediated transcriptional activation. | CSNK2A1, ELK1, FOS, GRB2, HRAS, INS, INSR, IRS1, JUN, MAP2K1, MAPK3, MAPK8, PIK3CA, PIK3R1, PTPN11, RAF1, RASA1, SHC1, SLC2A4, SOS1, SRF | 21 | CSNK2A1(9), ELK1(3), FOS(3), GRB2(3), HRAS(1), INS(3), INSR(18), IRS1(13), JUN(1), MAP2K1(2), MAPK3(3), MAPK8(10), PIK3CA(172), PIK3R1(100), PTPN11(8), RAF1(8), RASA1(30), SHC1(7), SLC2A4(9), SOS1(13), SRF(3) | 9476328 | 419 | 202 | 292 | 39 | 82 | 118 | 108 | 5 | 90 | 16 | 2.40e-13 | <1.00e-15 | <4.11e-14 |
| 7 | SIG_IL4RECEPTOR_IN_B_LYPHOCYTES | Genes related to IL4 rceptor signaling in B lymphocytes | AKT1, AKT2, AKT3, BAD, BCL2, GRB2, GSK3A, GSK3B, IL4R, IRS1, IRS2, JAK1, JAK3, MAP4K1, MAPK1, MAPK3, PDK1, PIK3CA, PIK3CD, PIK3R1, PPP1R13B, RAF1, SHC1, SOCS1, SOS1, SOS2, STAT6 | 25 | AKT1(4), AKT2(6), AKT3(11), BAD(2), GRB2(3), GSK3A(10), GSK3B(13), IL4R(6), IRS1(13), JAK1(20), JAK3(10), MAP4K1(11), MAPK1(2), MAPK3(3), PDK1(2), PIK3CA(172), PIK3CD(12), PIK3R1(100), PPP1R13B(9), RAF1(8), SHC1(7), SOS1(13), SOS2(17), STAT6(10) | 13137552 | 464 | 202 | 337 | 55 | 106 | 123 | 119 | 5 | 95 | 16 | 8.06e-11 | <1.00e-15 | <4.11e-14 |
| 8 | GLEEVECPATHWAY | The drug Gleevec specifically targets the abnormal bcr-abl protein, an apoptosis inhibitor present in chronic myeloid leukemia. | AKT1, BCL2, BCR, CRKL, FOS, GRB2, HRAS, JAK2, JUN, MAP2K1, MAP2K4, MAP3K1, MAPK3, MAPK8, MYC, PIK3CA, PIK3R1, RAF1, SOS1, STAT1, STAT5A, STAT5B | 22 | AKT1(4), BCR(6), CRKL(6), FOS(3), GRB2(3), HRAS(1), JAK2(17), JUN(1), MAP2K1(2), MAP2K4(9), MAP3K1(30), MAPK3(3), MAPK8(10), MYC(8), PIK3CA(172), PIK3R1(100), RAF1(8), SOS1(13), STAT1(15), STAT5A(5), STAT5B(7) | 10234960 | 423 | 199 | 298 | 39 | 75 | 122 | 113 | 4 | 90 | 19 | 9.63e-13 | <1.00e-15 | <4.11e-14 |
| 9 | IGF1RPATHWAY | Insulin-like growth factor receptor IGF-1R promotes cell growth and inhibits apoptosis on binding of ligands IGF-1 and 2 via Ras activation and the AKT pathway. | AKT1, BAD, GRB2, HRAS, IGF1R, IRS1, MAP2K1, MAPK1, MAPK3, PIK3CA, PIK3R1, RAF1, SHC1, SOS1, YWHAH | 15 | AKT1(4), BAD(2), GRB2(3), HRAS(1), IGF1R(13), IRS1(13), MAP2K1(2), MAPK1(2), MAPK3(3), PIK3CA(172), PIK3R1(100), RAF1(8), SHC1(7), SOS1(13), YWHAH(3) | 6997568 | 346 | 196 | 223 | 34 | 62 | 91 | 97 | 5 | 76 | 15 | 3.14e-09 | <1.00e-15 | <4.11e-14 |
| 10 | NKCELLSPATHWAY | Natural killer (NK) lymphocytes are inhibited by MHC and activated by surface glycoproteins on tumor or virus-infected cells, which undergo perforin-mediated lysis. | B2M, HLA-A, IL18, ITGB1, KLRC1, KLRC2, KLRC3, KLRC4, KLRD1, LAT, MAP2K1, MAPK3, PAK1, PIK3CA, PIK3R1, PTK2B, PTPN6, RAC1, SYK, VAV1 | 20 | B2M(3), HLA-A(1), IL18(2), ITGB1(8), KLRC1(7), KLRC2(3), KLRC3(1), KLRC4(5), KLRD1(3), MAP2K1(2), MAPK3(3), PAK1(3), PIK3CA(172), PIK3R1(100), PTK2B(16), PTPN6(6), RAC1(1), SYK(4), VAV1(12) | 7058328 | 352 | 196 | 232 | 34 | 59 | 99 | 93 | 5 | 81 | 15 | 1.94e-09 | <1.00e-15 | <4.11e-14 |
Table 7. Get Full Table A Ranked List of Significantly Mutated Genesets (Excluding Significantly Mutated Genes). Number of significant genesets found: 0. Number of genesets displayed: 10
| rank | geneset | description | genes | N_genes | mut_tally | N | n | npat | nsite | nsil | n1 | n2 | n3 | n4 | n5 | n6 | p_ns_s | p | q |
|---|---|---|---|---|---|---|---|---|---|---|---|---|---|---|---|---|---|---|---|
| 1 | HSA00627_1,4_DICHLOROBENZENE_DEGRADATION | Genes involved in 1,4-dichlorobenzene degradation | CMBL | 1 | CMBL(3) | 187984 | 3 | 3 | 3 | 1 | 0 | 1 | 0 | 1 | 1 | 0 | 0.81 | 0.18 | 1 |
| 2 | TCAPOPTOSISPATHWAY | HIV infection upregulates Fas ligand in macrophages and CD4 in helper T cells, leading to widespread Fas-induced T cell apoptosis. | CCR5, CD28, CD3D, CD3E, CD3G, CD3Z, CD4, TNFRSF6, TNFSF6, TRA@, TRB@ | 6 | CCR5(6), CD28(3), CD3D(6), CD3E(2), CD3G(3), CD4(6) | 1218920 | 26 | 16 | 26 | 5 | 3 | 16 | 0 | 0 | 7 | 0 | 0.16 | 0.2 | 1 |
| 3 | PEPIPATHWAY | Proepithelin (PEPI) induces epithelial cells to secrete IL-8, which promotes elastase secretion by neutrophils. | ELA1, ELA2, ELA2A, ELA2B, ELA3B, GRN, IL8, SLPI | 3 | GRN(5), IL8(3), SLPI(2) | 635128 | 10 | 10 | 9 | 0 | 2 | 5 | 2 | 0 | 1 | 0 | 0.057 | 0.31 | 1 |
| 4 | HSA00472_D_ARGININE_AND_D_ORNITHINE_METABOLISM | Genes involved in D-arginine and D-ornithine metabolism | DAO | 1 | DAO(8) | 268832 | 8 | 6 | 8 | 1 | 2 | 4 | 2 | 0 | 0 | 0 | 0.3 | 0.32 | 1 |
| 5 | TCRMOLECULE | T Cell Receptor and CD3 Complex | CD3D, CD3E, CD3G, CD3Z, TRA@, TRB@ | 3 | CD3D(6), CD3E(2), CD3G(3) | 437720 | 11 | 7 | 11 | 1 | 1 | 7 | 0 | 0 | 3 | 0 | 0.18 | 0.41 | 1 |
| 6 | LDLPATHWAY | Low density lipoproteins (LDL) are present in blood plasma, contain cholesterol and triglycerides, and contribute to atherogenic plaque formation. | ACAT1, CCL2, CSF1, IL6, LDLR, LPL | 6 | ACAT1(6), CSF1(6), IL6(5), LDLR(6), LPL(16) | 1950272 | 39 | 23 | 39 | 7 | 10 | 15 | 9 | 0 | 5 | 0 | 0.057 | 0.41 | 1 |
| 7 | IL17PATHWAY | Activated T cells secrete IL-17, which stimulates fibroblasts and other cells to secrete inflammatory and hematopoietic cytokines. | CD2, CD34, CD3D, CD3E, CD3G, CD3Z, CD4, CD58, CD8A, CSF3, IL17, IL3, IL6, IL8, KITLG, TRA@, TRB@ | 13 | CD2(4), CD34(1), CD3D(6), CD3E(2), CD3G(3), CD4(6), CD58(2), CD8A(2), CSF3(1), IL3(2), IL6(5), IL8(3), KITLG(3) | 2324752 | 40 | 27 | 40 | 9 | 6 | 20 | 4 | 0 | 10 | 0 | 0.18 | 0.42 | 1 |
| 8 | P27PATHWAY | p27 blocks the G1/S transition by inhibiting the checkpoint kinase cdk2/cyclin E and is inhibited by cdk2-mediated ubiquitination. | CCNE1, CDK2, CDKN1B, CKS1B, CUL1, E2F1, NEDD8, RB1, RBX1, SKP1A, SKP2, TFDP1, UBE2M | 12 | CCNE1(6), CDK2(2), CDKN1B(7), CKS1B(1), CUL1(13), E2F1(9), RB1(26), RBX1(1), SKP2(7), TFDP1(13) | 3255992 | 85 | 39 | 83 | 17 | 27 | 25 | 17 | 0 | 13 | 3 | 0.027 | 0.42 | 1 |
| 9 | HSA00643_STYRENE_DEGRADATION | Genes involved in styrene degradation | FAH, GSTZ1, HGD | 3 | FAH(6), GSTZ1(5), HGD(4) | 842456 | 15 | 12 | 15 | 2 | 5 | 4 | 4 | 0 | 2 | 0 | 0.11 | 0.48 | 1 |
| 10 | HSA00031_INOSITOL_METABOLISM | Genes involved in inositol metabolism | ALDH6A1, TPI1 | 2 | ALDH6A1(6), TPI1(2) | 594208 | 8 | 7 | 8 | 1 | 0 | 3 | 1 | 0 | 4 | 0 | 0.28 | 0.56 | 1 |
In brief, we tabulate the number of mutations and the number of covered bases for each gene. The counts are broken down by mutation context category: four context categories that are discovered by MutSig, and one for indel and 'null' mutations, which include indels, nonsense mutations, splice-site mutations, and non-stop (read-through) mutations. For each gene, we calculate the probability of seeing the observed constellation of mutations, i.e. the product P1 x P2 x ... x Pm, or a more extreme one, given the background mutation rates calculated across the dataset. [1]
This is an experimental feature. The full results of the analysis summarized in this report can be downloaded from the TCGA Data Coordination Center.