This pipeline computes the correlation between significant arm-level copy number variations (cnvs) and subtypes.
Testing the association between copy number variation 76 arm-level results and 8 molecular subtypes across 150 patients, 15 significant findings detected with Q value < 0.25.
-
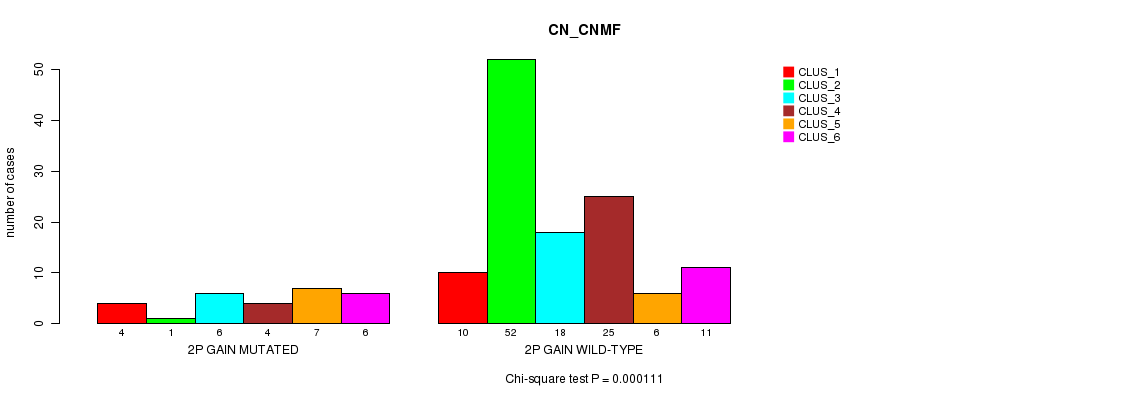
2p gain cnv correlated to 'CN_CNMF'.
-
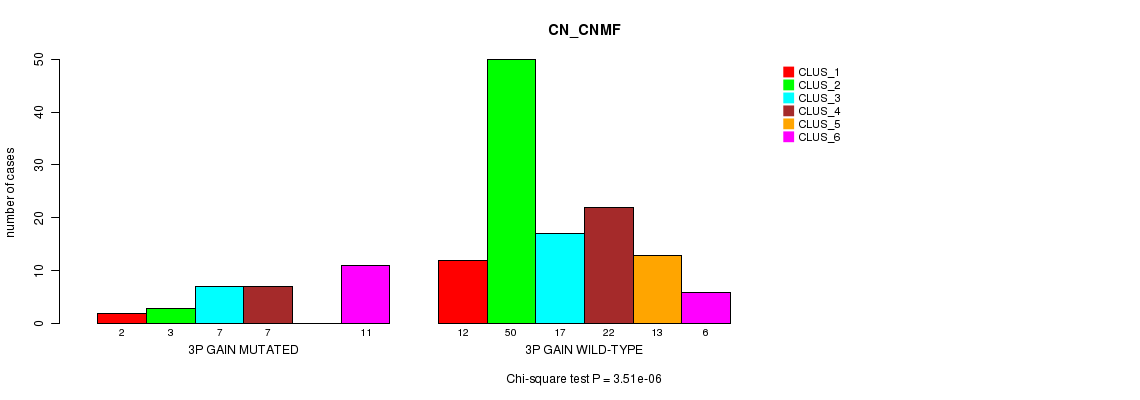
3p gain cnv correlated to 'CN_CNMF'.
-
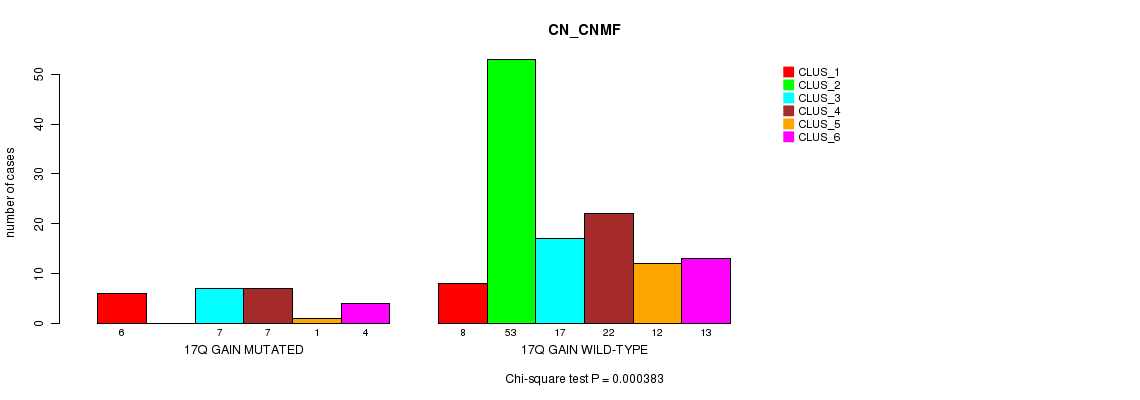
17q gain cnv correlated to 'CN_CNMF'.
-
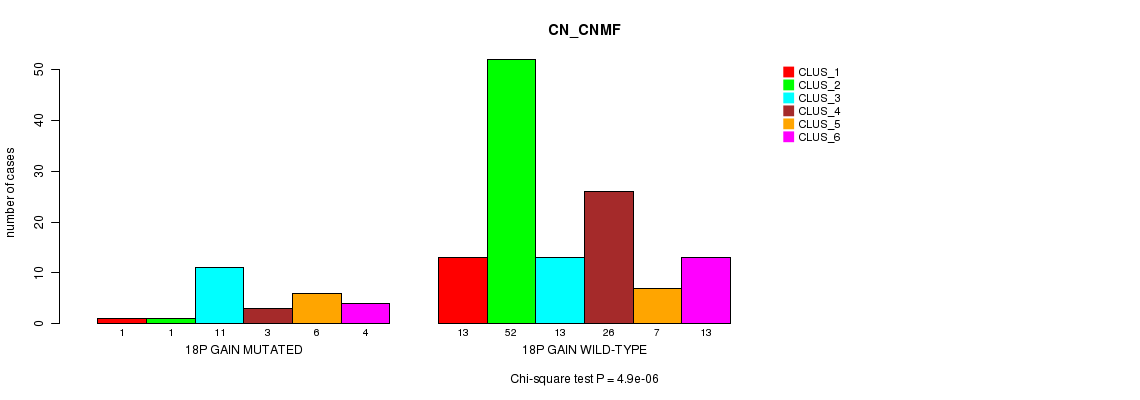
18p gain cnv correlated to 'CN_CNMF'.
-
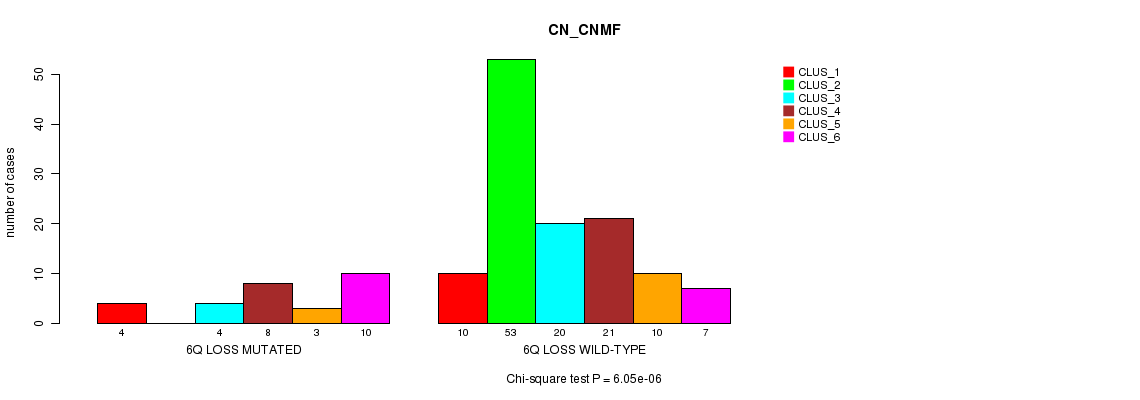
6q loss cnv correlated to 'CN_CNMF'.
-
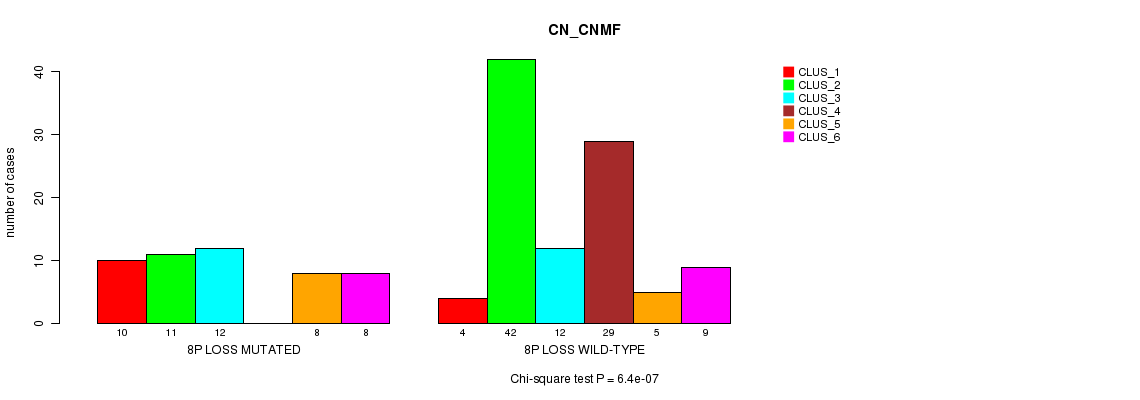
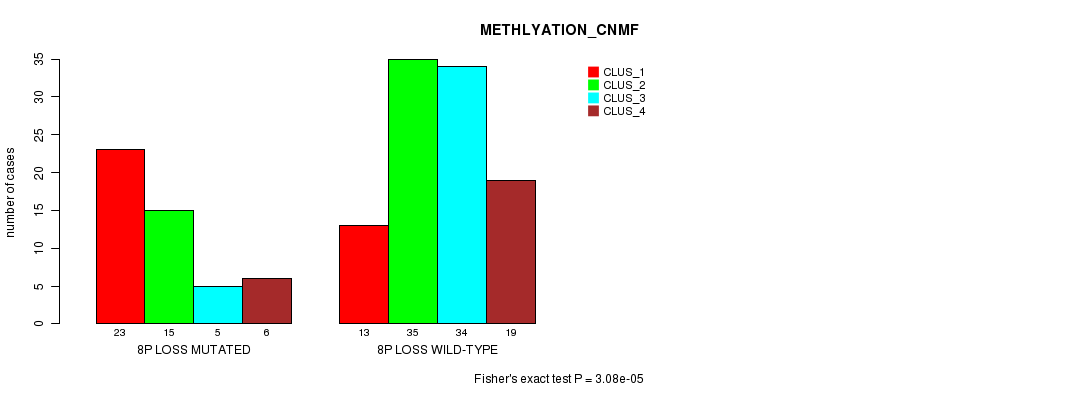
8p loss cnv correlated to 'CN_CNMF' and 'METHLYATION_CNMF'.
-
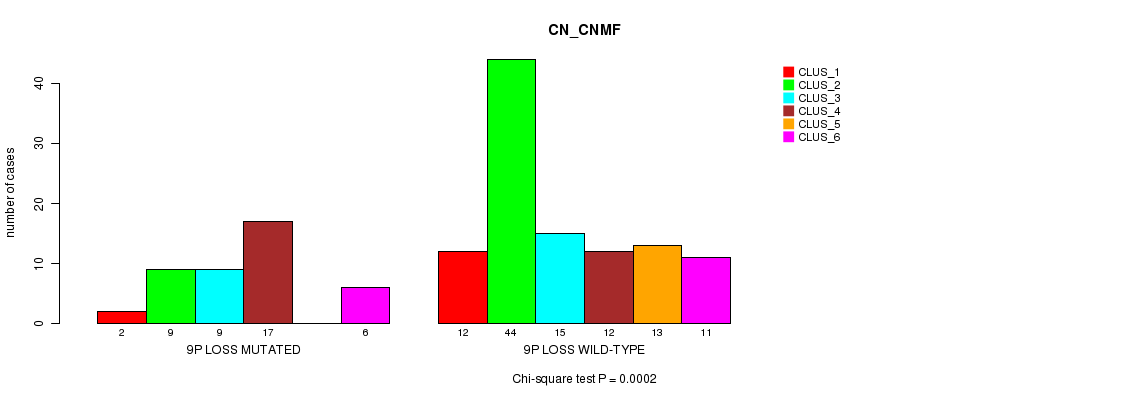
9p loss cnv correlated to 'CN_CNMF'.
-
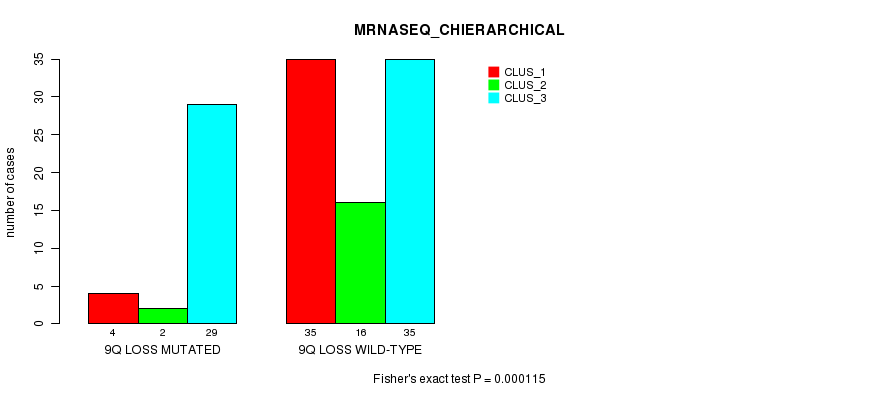
9q loss cnv correlated to 'CN_CNMF' and 'MRNASEQ_CHIERARCHICAL'.
-
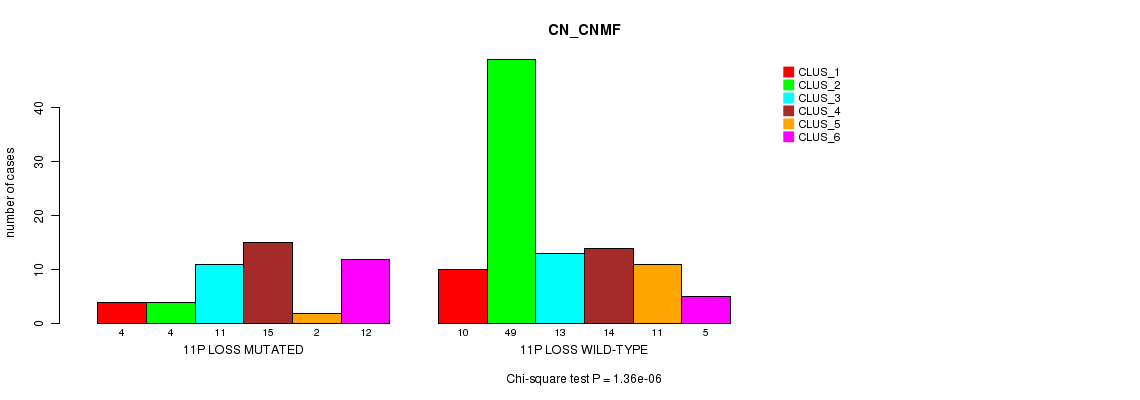
11p loss cnv correlated to 'CN_CNMF'.
-
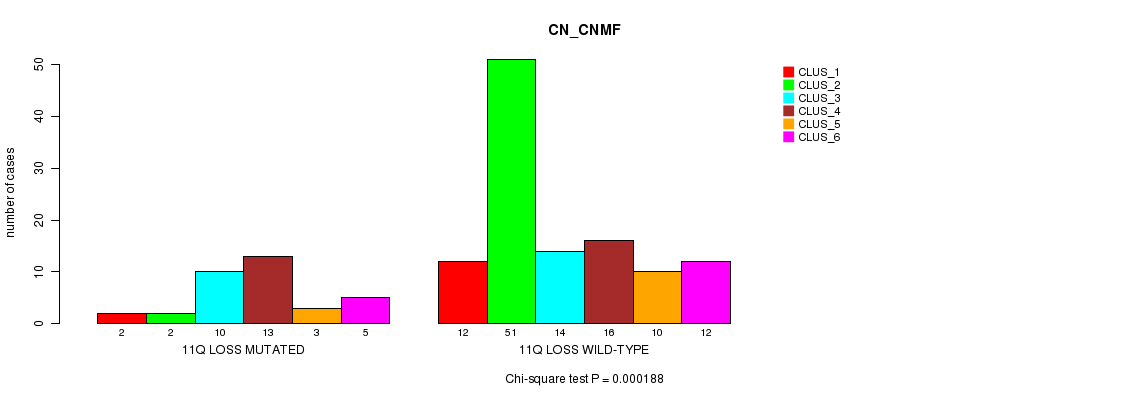
11q loss cnv correlated to 'CN_CNMF'.
-
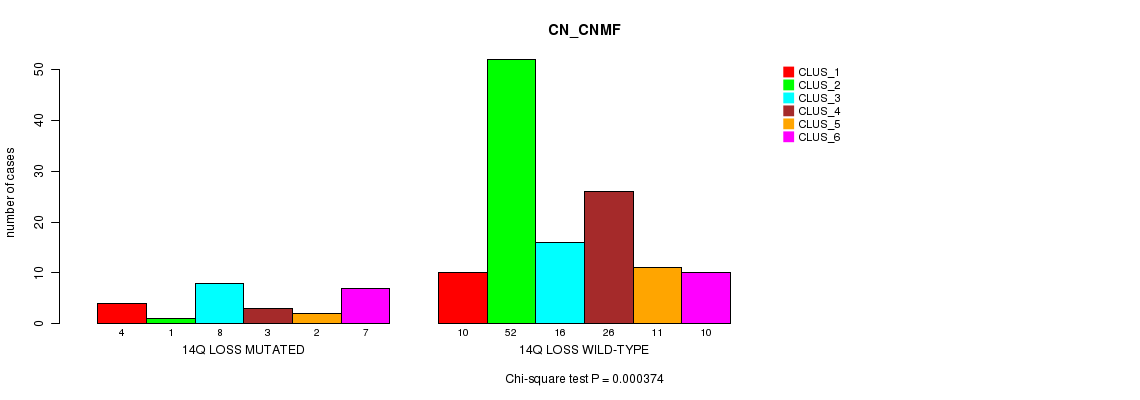
14q loss cnv correlated to 'CN_CNMF'.
-
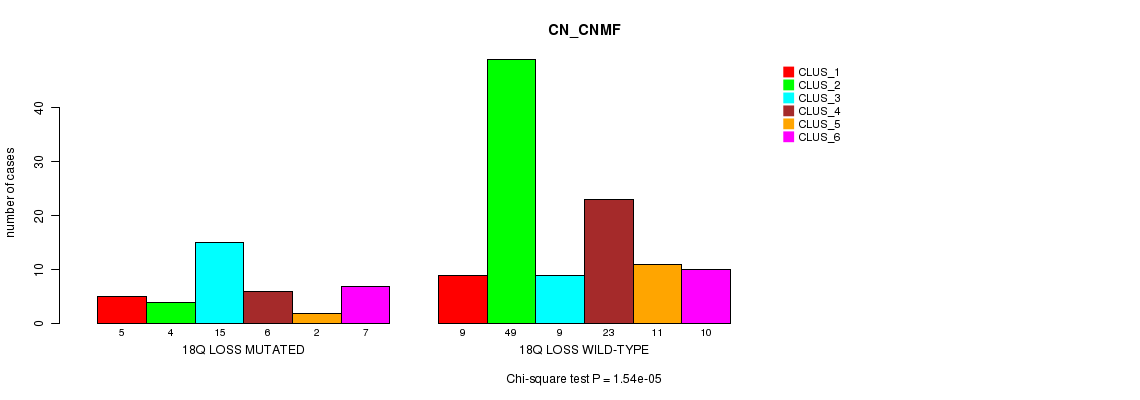
18q loss cnv correlated to 'CN_CNMF'.
-
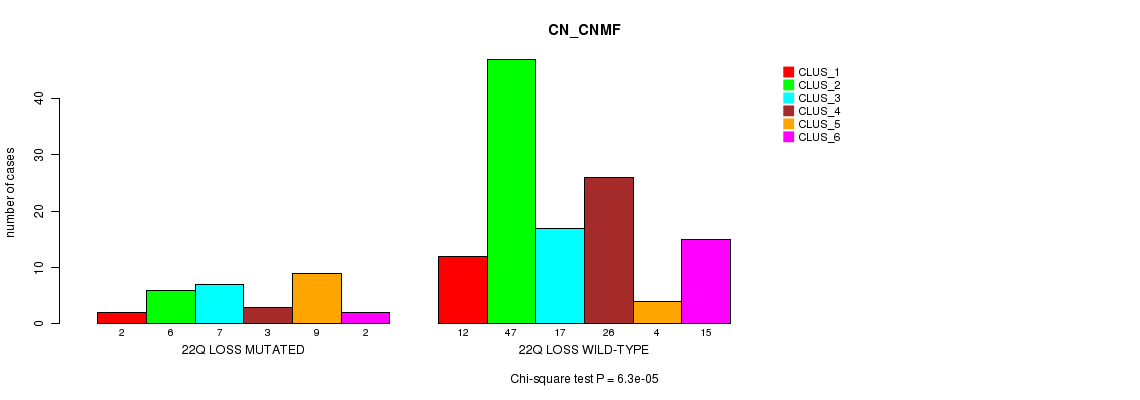
22q loss cnv correlated to 'CN_CNMF'.
Table 1. Get Full Table Overview of the association between significant copy number variation of 76 arm-level results and 8 molecular subtypes. Shown in the table are P values (Q values). Thresholded by Q value < 0.25, 15 significant findings detected.
|
Molecular subtypes |
CN CNMF |
METHLYATION CNMF |
RPPA CNMF |
RPPA CHIERARCHICAL |
MRNASEQ CNMF |
MRNASEQ CHIERARCHICAL |
MIRSEQ CNMF |
MIRSEQ CHIERARCHICAL |
||
| nCNV (%) | nWild-Type | Chi-square test | Fisher's exact test | Fisher's exact test | Fisher's exact test | Fisher's exact test | Fisher's exact test | Fisher's exact test | Fisher's exact test | |
| 8p loss | 49 (33%) | 101 |
6.4e-07 (0.000361) |
3.08e-05 (0.0172) |
0.143 (1.00) |
0.123 (1.00) |
0.643 (1.00) |
0.441 (1.00) |
0.048 (1.00) |
0.0745 (1.00) |
| 9q loss | 41 (27%) | 109 |
7.82e-05 (0.0435) |
0.00545 (1.00) |
0.00121 (0.65) |
0.00113 (0.612) |
0.00274 (1.00) |
0.000115 (0.0637) |
0.798 (1.00) |
0.348 (1.00) |
| 2p gain | 28 (19%) | 122 |
0.000111 (0.0615) |
0.00102 (0.555) |
0.214 (1.00) |
0.528 (1.00) |
0.282 (1.00) |
0.738 (1.00) |
0.0171 (1.00) |
0.0605 (1.00) |
| 3p gain | 30 (20%) | 120 |
3.51e-06 (0.00197) |
0.0447 (1.00) |
0.0287 (1.00) |
0.159 (1.00) |
0.0909 (1.00) |
0.005 (1.00) |
0.0454 (1.00) |
0.261 (1.00) |
| 17q gain | 25 (17%) | 125 |
0.000383 (0.211) |
0.0103 (1.00) |
0.497 (1.00) |
0.333 (1.00) |
0.0233 (1.00) |
0.108 (1.00) |
0.147 (1.00) |
0.0627 (1.00) |
| 18p gain | 26 (17%) | 124 |
4.9e-06 (0.00275) |
0.221 (1.00) |
0.933 (1.00) |
0.303 (1.00) |
0.0652 (1.00) |
0.579 (1.00) |
0.214 (1.00) |
0.665 (1.00) |
| 6q loss | 29 (19%) | 121 |
6.05e-06 (0.00339) |
0.00883 (1.00) |
0.247 (1.00) |
0.521 (1.00) |
0.26 (1.00) |
0.0477 (1.00) |
0.825 (1.00) |
0.752 (1.00) |
| 9p loss | 43 (29%) | 107 |
0.0002 (0.11) |
0.00652 (1.00) |
0.0374 (1.00) |
0.125 (1.00) |
0.0341 (1.00) |
0.000813 (0.442) |
0.883 (1.00) |
0.115 (1.00) |
| 11p loss | 48 (32%) | 102 |
1.36e-06 (0.000767) |
0.0019 (1.00) |
0.232 (1.00) |
0.365 (1.00) |
0.0739 (1.00) |
0.00248 (1.00) |
0.206 (1.00) |
0.647 (1.00) |
| 11q loss | 35 (23%) | 115 |
0.000188 (0.104) |
0.0298 (1.00) |
0.3 (1.00) |
0.697 (1.00) |
0.211 (1.00) |
0.424 (1.00) |
0.201 (1.00) |
0.246 (1.00) |
| 14q loss | 25 (17%) | 125 |
0.000374 (0.206) |
0.0272 (1.00) |
0.818 (1.00) |
0.364 (1.00) |
0.746 (1.00) |
0.47 (1.00) |
0.0573 (1.00) |
0.117 (1.00) |
| 18q loss | 39 (26%) | 111 |
1.54e-05 (0.0086) |
0.709 (1.00) |
0.813 (1.00) |
0.489 (1.00) |
0.182 (1.00) |
0.559 (1.00) |
0.553 (1.00) |
0.218 (1.00) |
| 22q loss | 29 (19%) | 121 |
6.3e-05 (0.0351) |
0.669 (1.00) |
0.0706 (1.00) |
0.00444 (1.00) |
0.0686 (1.00) |
0.12 (1.00) |
0.885 (1.00) |
0.415 (1.00) |
| 1p gain | 16 (11%) | 134 |
0.00303 (1.00) |
0.172 (1.00) |
0.466 (1.00) |
0.869 (1.00) |
0.518 (1.00) |
0.386 (1.00) |
0.279 (1.00) |
0.816 (1.00) |
| 1q gain | 32 (21%) | 118 |
0.127 (1.00) |
0.478 (1.00) |
0.941 (1.00) |
0.59 (1.00) |
0.822 (1.00) |
0.655 (1.00) |
0.34 (1.00) |
0.467 (1.00) |
| 2q gain | 11 (7%) | 139 |
0.059 (1.00) |
0.241 (1.00) |
0.69 (1.00) |
0.777 (1.00) |
0.342 (1.00) |
0.359 (1.00) |
0.201 (1.00) |
0.274 (1.00) |
| 3q gain | 42 (28%) | 108 |
0.000559 (0.307) |
0.264 (1.00) |
1 (1.00) |
0.576 (1.00) |
0.586 (1.00) |
0.0857 (1.00) |
0.228 (1.00) |
0.0628 (1.00) |
| 4p gain | 8 (5%) | 142 |
0.443 (1.00) |
0.625 (1.00) |
1 (1.00) |
0.643 (1.00) |
1 (1.00) |
0.613 (1.00) |
0.15 (1.00) |
1 (1.00) |
| 4q gain | 3 (2%) | 147 |
0.296 (1.00) |
0.405 (1.00) |
0.782 (1.00) |
0.727 (1.00) |
0.435 (1.00) |
1 (1.00) |
||
| 5p gain | 40 (27%) | 110 |
0.0862 (1.00) |
0.402 (1.00) |
0.0287 (1.00) |
0.264 (1.00) |
0.354 (1.00) |
0.601 (1.00) |
0.459 (1.00) |
0.158 (1.00) |
| 5q gain | 18 (12%) | 132 |
0.0903 (1.00) |
0.0769 (1.00) |
0.228 (1.00) |
0.666 (1.00) |
0.703 (1.00) |
1 (1.00) |
0.191 (1.00) |
0.252 (1.00) |
| 6p gain | 8 (5%) | 142 |
0.545 (1.00) |
0.182 (1.00) |
1 (1.00) |
0.227 (1.00) |
0.753 (1.00) |
0.83 (1.00) |
||
| 6q gain | 5 (3%) | 145 |
0.402 (1.00) |
0.382 (1.00) |
0.206 (1.00) |
0.194 (1.00) |
||||
| 7p gain | 46 (31%) | 104 |
0.00188 (1.00) |
0.00172 (0.926) |
0.835 (1.00) |
0.38 (1.00) |
0.968 (1.00) |
0.963 (1.00) |
0.0753 (1.00) |
0.554 (1.00) |
| 7q gain | 43 (29%) | 107 |
0.00249 (1.00) |
0.0504 (1.00) |
1 (1.00) |
0.523 (1.00) |
0.968 (1.00) |
0.891 (1.00) |
0.51 (1.00) |
1 (1.00) |
| 8p gain | 15 (10%) | 135 |
0.104 (1.00) |
0.0034 (1.00) |
0.192 (1.00) |
0.625 (1.00) |
0.0776 (1.00) |
1 (1.00) |
0.0911 (1.00) |
0.279 (1.00) |
| 8q gain | 39 (26%) | 111 |
0.0523 (1.00) |
0.0887 (1.00) |
0.623 (1.00) |
0.928 (1.00) |
0.278 (1.00) |
0.889 (1.00) |
0.199 (1.00) |
0.297 (1.00) |
| 9p gain | 15 (10%) | 135 |
0.00336 (1.00) |
0.437 (1.00) |
0.189 (1.00) |
0.643 (1.00) |
0.518 (1.00) |
0.0987 (1.00) |
0.134 (1.00) |
0.321 (1.00) |
| 9q gain | 11 (7%) | 139 |
0.494 (1.00) |
0.323 (1.00) |
0.0979 (1.00) |
0.394 (1.00) |
0.0556 (1.00) |
0.038 (1.00) |
0.777 (1.00) |
0.886 (1.00) |
| 10p gain | 28 (19%) | 122 |
0.00114 (0.614) |
0.00192 (1.00) |
0.382 (1.00) |
0.0203 (1.00) |
0.523 (1.00) |
0.651 (1.00) |
0.664 (1.00) |
0.261 (1.00) |
| 10q gain | 7 (5%) | 143 |
0.341 (1.00) |
0.188 (1.00) |
0.512 (1.00) |
0.347 (1.00) |
0.553 (1.00) |
0.164 (1.00) |
0.887 (1.00) |
0.149 (1.00) |
| 11p gain | 8 (5%) | 142 |
0.0507 (1.00) |
0.956 (1.00) |
0.724 (1.00) |
1 (1.00) |
0.445 (1.00) |
0.725 (1.00) |
||
| 11q gain | 8 (5%) | 142 |
0.247 (1.00) |
0.518 (1.00) |
0.483 (1.00) |
0.36 (1.00) |
0.642 (1.00) |
0.522 (1.00) |
||
| 12p gain | 24 (16%) | 126 |
0.00378 (1.00) |
0.624 (1.00) |
0.13 (1.00) |
0.264 (1.00) |
0.914 (1.00) |
0.493 (1.00) |
0.045 (1.00) |
0.369 (1.00) |
| 12q gain | 17 (11%) | 133 |
0.0139 (1.00) |
0.308 (1.00) |
0.419 (1.00) |
0.435 (1.00) |
0.409 (1.00) |
0.759 (1.00) |
0.0363 (1.00) |
0.498 (1.00) |
| 13q gain | 25 (17%) | 125 |
0.218 (1.00) |
0.885 (1.00) |
0.0318 (1.00) |
0.0351 (1.00) |
0.0442 (1.00) |
0.0452 (1.00) |
0.399 (1.00) |
0.819 (1.00) |
| 14q gain | 11 (7%) | 139 |
0.0903 (1.00) |
0.898 (1.00) |
0.206 (1.00) |
0.287 (1.00) |
0.278 (1.00) |
0.176 (1.00) |
0.357 (1.00) |
0.379 (1.00) |
| 15q gain | 5 (3%) | 145 |
0.0382 (1.00) |
0.0314 (1.00) |
0.296 (1.00) |
0.777 (1.00) |
0.683 (1.00) |
1 (1.00) |
0.455 (1.00) |
0.519 (1.00) |
| 16p gain | 10 (7%) | 140 |
0.0499 (1.00) |
0.609 (1.00) |
0.638 (1.00) |
0.814 (1.00) |
0.751 (1.00) |
0.717 (1.00) |
1 (1.00) |
0.115 (1.00) |
| 16q gain | 13 (9%) | 137 |
0.0043 (1.00) |
0.266 (1.00) |
1 (1.00) |
1 (1.00) |
1 (1.00) |
0.256 (1.00) |
0.925 (1.00) |
0.197 (1.00) |
| 17p gain | 9 (6%) | 141 |
0.193 (1.00) |
0.551 (1.00) |
0.724 (1.00) |
0.545 (1.00) |
0.15 (1.00) |
0.432 (1.00) |
||
| 18q gain | 9 (6%) | 141 |
0.0331 (1.00) |
0.599 (1.00) |
0.465 (1.00) |
0.337 (1.00) |
0.431 (1.00) |
0.289 (1.00) |
1 (1.00) |
1 (1.00) |
| 19p gain | 15 (10%) | 135 |
0.0331 (1.00) |
0.0585 (1.00) |
0.109 (1.00) |
0.489 (1.00) |
0.513 (1.00) |
0.64 (1.00) |
||
| 19q gain | 29 (19%) | 121 |
0.0007 (0.383) |
0.117 (1.00) |
0.633 (1.00) |
0.822 (1.00) |
0.0467 (1.00) |
0.105 (1.00) |
0.588 (1.00) |
1 (1.00) |
| 20p gain | 54 (36%) | 96 |
0.0335 (1.00) |
0.0771 (1.00) |
0.415 (1.00) |
0.37 (1.00) |
0.475 (1.00) |
0.151 (1.00) |
0.265 (1.00) |
0.309 (1.00) |
| 20q gain | 59 (39%) | 91 |
0.0206 (1.00) |
0.0511 (1.00) |
0.439 (1.00) |
0.662 (1.00) |
0.0775 (1.00) |
0.088 (1.00) |
0.0564 (1.00) |
0.229 (1.00) |
| 21q gain | 27 (18%) | 123 |
0.00187 (1) |
0.0011 (0.599) |
0.598 (1.00) |
1 (1.00) |
0.191 (1.00) |
0.102 (1.00) |
0.273 (1.00) |
0.103 (1.00) |
| 22q gain | 12 (8%) | 138 |
0.000744 (0.405) |
0.165 (1.00) |
0.536 (1.00) |
0.44 (1.00) |
0.451 (1.00) |
0.903 (1.00) |
0.0424 (1.00) |
0.232 (1.00) |
| Xq gain | 6 (4%) | 144 |
0.113 (1.00) |
0.801 (1.00) |
0.763 (1.00) |
1 (1.00) |
1 (1.00) |
0.293 (1.00) |
||
| 1p loss | 4 (3%) | 146 |
0.456 (1.00) |
0.0509 (1.00) |
0.605 (1.00) |
1 (1.00) |
||||
| 2p loss | 8 (5%) | 142 |
0.828 (1.00) |
0.0229 (1.00) |
0.368 (1.00) |
0.164 (1.00) |
1 (1.00) |
0.432 (1.00) |
||
| 2q loss | 17 (11%) | 133 |
0.0112 (1.00) |
0.472 (1.00) |
1 (1.00) |
0.424 (1.00) |
0.463 (1.00) |
0.0323 (1.00) |
0.779 (1.00) |
0.911 (1.00) |
| 3p loss | 9 (6%) | 141 |
0.0633 (1.00) |
0.773 (1.00) |
0.345 (1.00) |
0.666 (1.00) |
0.0858 (1.00) |
0.0719 (1.00) |
0.148 (1.00) |
0.273 (1.00) |
| 4p loss | 29 (19%) | 121 |
0.000739 (0.403) |
0.292 (1.00) |
0.853 (1.00) |
0.68 (1.00) |
0.425 (1.00) |
0.342 (1.00) |
0.425 (1.00) |
0.517 (1.00) |
| 4q loss | 26 (17%) | 124 |
0.0777 (1.00) |
0.78 (1.00) |
0.68 (1.00) |
0.333 (1.00) |
0.593 (1.00) |
0.601 (1.00) |
0.326 (1.00) |
0.675 (1.00) |
| 5p loss | 14 (9%) | 136 |
0.000607 (0.333) |
0.609 (1.00) |
0.517 (1.00) |
1 (1.00) |
0.532 (1.00) |
0.721 (1.00) |
0.279 (1.00) |
0.262 (1.00) |
| 5q loss | 36 (24%) | 114 |
0.00112 (0.608) |
0.0923 (1.00) |
0.767 (1.00) |
0.822 (1.00) |
0.895 (1.00) |
0.772 (1.00) |
0.151 (1.00) |
0.415 (1.00) |
| 6p loss | 18 (12%) | 132 |
0.0517 (1.00) |
0.238 (1.00) |
0.233 (1.00) |
0.353 (1.00) |
0.384 (1.00) |
0.812 (1.00) |
0.759 (1.00) |
0.519 (1.00) |
| 7q loss | 3 (2%) | 147 |
0.375 (1.00) |
0.292 (1.00) |
||||||
| 8q loss | 5 (3%) | 145 |
0.285 (1.00) |
0.192 (1.00) |
0.782 (1.00) |
1 (1.00) |
0.349 (1.00) |
0.0688 (1.00) |
||
| 10p loss | 19 (13%) | 131 |
0.763 (1.00) |
0.878 (1.00) |
0.189 (1.00) |
0.409 (1.00) |
0.252 (1.00) |
0.275 (1.00) |
0.183 (1.00) |
0.42 (1.00) |
| 10q loss | 30 (20%) | 120 |
0.118 (1.00) |
0.0538 (1.00) |
0.921 (1.00) |
0.717 (1.00) |
0.209 (1.00) |
0.0406 (1.00) |
0.0308 (1.00) |
0.359 (1.00) |
| 12p loss | 6 (4%) | 144 |
0.159 (1.00) |
0.161 (1.00) |
0.325 (1.00) |
0.284 (1.00) |
1 (1.00) |
0.439 (1.00) |
||
| 12q loss | 9 (6%) | 141 |
0.159 (1.00) |
1 (1.00) |
0.15 (1.00) |
0.36 (1.00) |
0.15 (1.00) |
1 (1.00) |
||
| 13q loss | 20 (13%) | 130 |
0.0157 (1.00) |
0.311 (1.00) |
0.104 (1.00) |
0.173 (1.00) |
0.111 (1.00) |
0.418 (1.00) |
0.049 (1.00) |
0.662 (1.00) |
| 15q loss | 19 (13%) | 131 |
0.168 (1.00) |
0.095 (1.00) |
0.121 (1.00) |
0.561 (1.00) |
0.0776 (1.00) |
0.0576 (1.00) |
0.0515 (1.00) |
0.246 (1.00) |
| 16p loss | 17 (11%) | 133 |
0.0179 (1.00) |
0.276 (1.00) |
0.603 (1.00) |
0.471 (1.00) |
0.343 (1.00) |
0.864 (1.00) |
0.326 (1.00) |
0.686 (1.00) |
| 16q loss | 17 (11%) | 133 |
0.00477 (1.00) |
0.399 (1.00) |
0.75 (1.00) |
0.503 (1.00) |
0.735 (1.00) |
0.806 (1.00) |
0.823 (1.00) |
0.828 (1.00) |
| 17p loss | 42 (28%) | 108 |
0.00208 (1.00) |
0.108 (1.00) |
0.541 (1.00) |
0.869 (1.00) |
0.00626 (1.00) |
0.161 (1.00) |
0.217 (1.00) |
0.323 (1.00) |
| 17q loss | 6 (4%) | 144 |
0.72 (1.00) |
0.0394 (1.00) |
0.857 (1.00) |
0.845 (1.00) |
0.266 (1.00) |
0.51 (1.00) |
||
| 18p loss | 22 (15%) | 128 |
0.005 (1.00) |
0.0335 (1.00) |
0.507 (1.00) |
0.195 (1.00) |
1 (1.00) |
0.172 (1.00) |
0.581 (1.00) |
0.0113 (1.00) |
| 19p loss | 9 (6%) | 141 |
0.3 (1.00) |
0.933 (1.00) |
0.252 (1.00) |
0.11 (1.00) |
0.415 (1.00) |
0.356 (1.00) |
0.15 (1.00) |
1 (1.00) |
| 19q loss | 4 (3%) | 146 |
0.545 (1.00) |
0.702 (1.00) |
0.48 (1.00) |
0.727 (1.00) |
0.183 (1.00) |
1 (1.00) |
||
| 20p loss | 7 (5%) | 143 |
0.313 (1.00) |
0.251 (1.00) |
1 (1.00) |
1 (1.00) |
0.868 (1.00) |
0.663 (1.00) |
||
| 21q loss | 17 (11%) | 133 |
0.556 (1.00) |
0.533 (1.00) |
0.466 (1.00) |
0.471 (1.00) |
0.674 (1.00) |
0.584 (1.00) |
0.467 (1.00) |
0.904 (1.00) |
| Xq loss | 4 (3%) | 146 |
0.252 (1.00) |
0.285 (1.00) |
0.48 (1.00) |
0.562 (1.00) |
0.808 (1.00) |
1 (1.00) |
P value = 0.000111 (Chi-square test), Q value = 0.062
Table S1. Gene #3: '2p gain mutation analysis' versus Clinical Feature #1: 'CN_CNMF'
| nPatients | CLUS_1 | CLUS_2 | CLUS_3 | CLUS_4 | CLUS_5 | CLUS_6 |
|---|---|---|---|---|---|---|
| ALL | 14 | 53 | 24 | 29 | 13 | 17 |
| 2P GAIN MUTATED | 4 | 1 | 6 | 4 | 7 | 6 |
| 2P GAIN WILD-TYPE | 10 | 52 | 18 | 25 | 6 | 11 |
Figure S1. Get High-res Image Gene #3: '2p gain mutation analysis' versus Clinical Feature #1: 'CN_CNMF'
P value = 3.51e-06 (Chi-square test), Q value = 0.002
Table S2. Gene #5: '3p gain mutation analysis' versus Clinical Feature #1: 'CN_CNMF'
| nPatients | CLUS_1 | CLUS_2 | CLUS_3 | CLUS_4 | CLUS_5 | CLUS_6 |
|---|---|---|---|---|---|---|
| ALL | 14 | 53 | 24 | 29 | 13 | 17 |
| 3P GAIN MUTATED | 2 | 3 | 7 | 7 | 0 | 11 |
| 3P GAIN WILD-TYPE | 12 | 50 | 17 | 22 | 13 | 6 |
Figure S2. Get High-res Image Gene #5: '3p gain mutation analysis' versus Clinical Feature #1: 'CN_CNMF'
P value = 0.000383 (Chi-square test), Q value = 0.21
Table S3. Gene #31: '17q gain mutation analysis' versus Clinical Feature #1: 'CN_CNMF'
| nPatients | CLUS_1 | CLUS_2 | CLUS_3 | CLUS_4 | CLUS_5 | CLUS_6 |
|---|---|---|---|---|---|---|
| ALL | 14 | 53 | 24 | 29 | 13 | 17 |
| 17Q GAIN MUTATED | 6 | 0 | 7 | 7 | 1 | 4 |
| 17Q GAIN WILD-TYPE | 8 | 53 | 17 | 22 | 12 | 13 |
Figure S3. Get High-res Image Gene #31: '17q gain mutation analysis' versus Clinical Feature #1: 'CN_CNMF'
P value = 4.9e-06 (Chi-square test), Q value = 0.0027
Table S4. Gene #32: '18p gain mutation analysis' versus Clinical Feature #1: 'CN_CNMF'
| nPatients | CLUS_1 | CLUS_2 | CLUS_3 | CLUS_4 | CLUS_5 | CLUS_6 |
|---|---|---|---|---|---|---|
| ALL | 14 | 53 | 24 | 29 | 13 | 17 |
| 18P GAIN MUTATED | 1 | 1 | 11 | 3 | 6 | 4 |
| 18P GAIN WILD-TYPE | 13 | 52 | 13 | 26 | 7 | 13 |
Figure S4. Get High-res Image Gene #32: '18p gain mutation analysis' versus Clinical Feature #1: 'CN_CNMF'
P value = 6.05e-06 (Chi-square test), Q value = 0.0034
Table S5. Gene #50: '6q loss mutation analysis' versus Clinical Feature #1: 'CN_CNMF'
| nPatients | CLUS_1 | CLUS_2 | CLUS_3 | CLUS_4 | CLUS_5 | CLUS_6 |
|---|---|---|---|---|---|---|
| ALL | 14 | 53 | 24 | 29 | 13 | 17 |
| 6Q LOSS MUTATED | 4 | 0 | 4 | 8 | 3 | 10 |
| 6Q LOSS WILD-TYPE | 10 | 53 | 20 | 21 | 10 | 7 |
Figure S5. Get High-res Image Gene #50: '6q loss mutation analysis' versus Clinical Feature #1: 'CN_CNMF'
P value = 6.4e-07 (Chi-square test), Q value = 0.00036
Table S6. Gene #52: '8p loss mutation analysis' versus Clinical Feature #1: 'CN_CNMF'
| nPatients | CLUS_1 | CLUS_2 | CLUS_3 | CLUS_4 | CLUS_5 | CLUS_6 |
|---|---|---|---|---|---|---|
| ALL | 14 | 53 | 24 | 29 | 13 | 17 |
| 8P LOSS MUTATED | 10 | 11 | 12 | 0 | 8 | 8 |
| 8P LOSS WILD-TYPE | 4 | 42 | 12 | 29 | 5 | 9 |
Figure S6. Get High-res Image Gene #52: '8p loss mutation analysis' versus Clinical Feature #1: 'CN_CNMF'
P value = 3.08e-05 (Fisher's exact test), Q value = 0.017
Table S7. Gene #52: '8p loss mutation analysis' versus Clinical Feature #2: 'METHLYATION_CNMF'
| nPatients | CLUS_1 | CLUS_2 | CLUS_3 | CLUS_4 |
|---|---|---|---|---|
| ALL | 36 | 50 | 39 | 25 |
| 8P LOSS MUTATED | 23 | 15 | 5 | 6 |
| 8P LOSS WILD-TYPE | 13 | 35 | 34 | 19 |
Figure S7. Get High-res Image Gene #52: '8p loss mutation analysis' versus Clinical Feature #2: 'METHLYATION_CNMF'
P value = 2e-04 (Chi-square test), Q value = 0.11
Table S8. Gene #54: '9p loss mutation analysis' versus Clinical Feature #1: 'CN_CNMF'
| nPatients | CLUS_1 | CLUS_2 | CLUS_3 | CLUS_4 | CLUS_5 | CLUS_6 |
|---|---|---|---|---|---|---|
| ALL | 14 | 53 | 24 | 29 | 13 | 17 |
| 9P LOSS MUTATED | 2 | 9 | 9 | 17 | 0 | 6 |
| 9P LOSS WILD-TYPE | 12 | 44 | 15 | 12 | 13 | 11 |
Figure S8. Get High-res Image Gene #54: '9p loss mutation analysis' versus Clinical Feature #1: 'CN_CNMF'
P value = 7.82e-05 (Chi-square test), Q value = 0.044
Table S9. Gene #55: '9q loss mutation analysis' versus Clinical Feature #1: 'CN_CNMF'
| nPatients | CLUS_1 | CLUS_2 | CLUS_3 | CLUS_4 | CLUS_5 | CLUS_6 |
|---|---|---|---|---|---|---|
| ALL | 14 | 53 | 24 | 29 | 13 | 17 |
| 9Q LOSS MUTATED | 1 | 8 | 10 | 17 | 1 | 4 |
| 9Q LOSS WILD-TYPE | 13 | 45 | 14 | 12 | 12 | 13 |
Figure S9. Get High-res Image Gene #55: '9q loss mutation analysis' versus Clinical Feature #1: 'CN_CNMF'
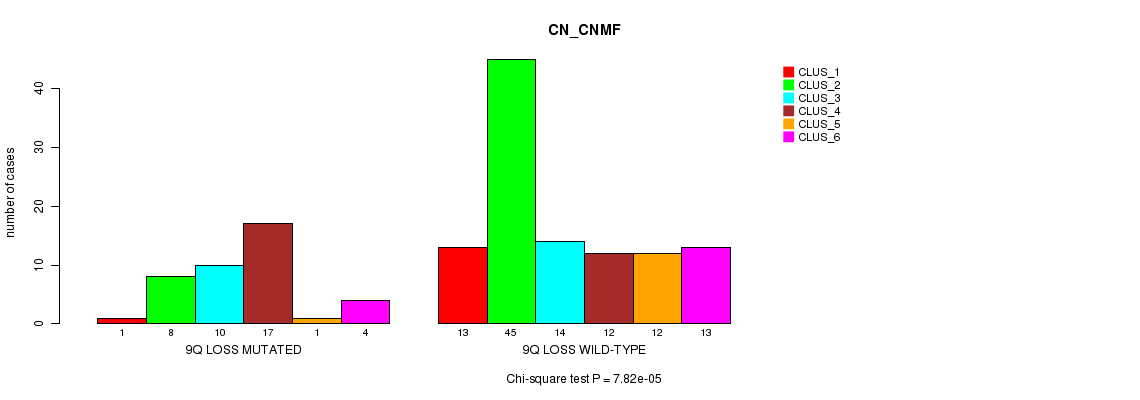
P value = 0.000115 (Fisher's exact test), Q value = 0.064
Table S10. Gene #55: '9q loss mutation analysis' versus Clinical Feature #6: 'MRNASEQ_CHIERARCHICAL'
| nPatients | CLUS_1 | CLUS_2 | CLUS_3 |
|---|---|---|---|
| ALL | 39 | 18 | 64 |
| 9Q LOSS MUTATED | 4 | 2 | 29 |
| 9Q LOSS WILD-TYPE | 35 | 16 | 35 |
Figure S10. Get High-res Image Gene #55: '9q loss mutation analysis' versus Clinical Feature #6: 'MRNASEQ_CHIERARCHICAL'
P value = 1.36e-06 (Chi-square test), Q value = 0.00077
Table S11. Gene #58: '11p loss mutation analysis' versus Clinical Feature #1: 'CN_CNMF'
| nPatients | CLUS_1 | CLUS_2 | CLUS_3 | CLUS_4 | CLUS_5 | CLUS_6 |
|---|---|---|---|---|---|---|
| ALL | 14 | 53 | 24 | 29 | 13 | 17 |
| 11P LOSS MUTATED | 4 | 4 | 11 | 15 | 2 | 12 |
| 11P LOSS WILD-TYPE | 10 | 49 | 13 | 14 | 11 | 5 |
Figure S11. Get High-res Image Gene #58: '11p loss mutation analysis' versus Clinical Feature #1: 'CN_CNMF'
P value = 0.000188 (Chi-square test), Q value = 0.1
Table S12. Gene #59: '11q loss mutation analysis' versus Clinical Feature #1: 'CN_CNMF'
| nPatients | CLUS_1 | CLUS_2 | CLUS_3 | CLUS_4 | CLUS_5 | CLUS_6 |
|---|---|---|---|---|---|---|
| ALL | 14 | 53 | 24 | 29 | 13 | 17 |
| 11Q LOSS MUTATED | 2 | 2 | 10 | 13 | 3 | 5 |
| 11Q LOSS WILD-TYPE | 12 | 51 | 14 | 16 | 10 | 12 |
Figure S12. Get High-res Image Gene #59: '11q loss mutation analysis' versus Clinical Feature #1: 'CN_CNMF'
P value = 0.000374 (Chi-square test), Q value = 0.21
Table S13. Gene #63: '14q loss mutation analysis' versus Clinical Feature #1: 'CN_CNMF'
| nPatients | CLUS_1 | CLUS_2 | CLUS_3 | CLUS_4 | CLUS_5 | CLUS_6 |
|---|---|---|---|---|---|---|
| ALL | 14 | 53 | 24 | 29 | 13 | 17 |
| 14Q LOSS MUTATED | 4 | 1 | 8 | 3 | 2 | 7 |
| 14Q LOSS WILD-TYPE | 10 | 52 | 16 | 26 | 11 | 10 |
Figure S13. Get High-res Image Gene #63: '14q loss mutation analysis' versus Clinical Feature #1: 'CN_CNMF'
P value = 1.54e-05 (Chi-square test), Q value = 0.0086
Table S14. Gene #70: '18q loss mutation analysis' versus Clinical Feature #1: 'CN_CNMF'
| nPatients | CLUS_1 | CLUS_2 | CLUS_3 | CLUS_4 | CLUS_5 | CLUS_6 |
|---|---|---|---|---|---|---|
| ALL | 14 | 53 | 24 | 29 | 13 | 17 |
| 18Q LOSS MUTATED | 5 | 4 | 15 | 6 | 2 | 7 |
| 18Q LOSS WILD-TYPE | 9 | 49 | 9 | 23 | 11 | 10 |
Figure S14. Get High-res Image Gene #70: '18q loss mutation analysis' versus Clinical Feature #1: 'CN_CNMF'
P value = 6.3e-05 (Chi-square test), Q value = 0.035
Table S15. Gene #75: '22q loss mutation analysis' versus Clinical Feature #1: 'CN_CNMF'
| nPatients | CLUS_1 | CLUS_2 | CLUS_3 | CLUS_4 | CLUS_5 | CLUS_6 |
|---|---|---|---|---|---|---|
| ALL | 14 | 53 | 24 | 29 | 13 | 17 |
| 22Q LOSS MUTATED | 2 | 6 | 7 | 3 | 9 | 2 |
| 22Q LOSS WILD-TYPE | 12 | 47 | 17 | 26 | 4 | 15 |
Figure S15. Get High-res Image Gene #75: '22q loss mutation analysis' versus Clinical Feature #1: 'CN_CNMF'
-
Mutation data file = broad_values_by_arm.mutsig.cluster.txt
-
Molecular subtypes file = BLCA-TP.transferedmergedcluster.txt
-
Number of patients = 150
-
Number of significantly arm-level cnvs = 76
-
Number of molecular subtypes = 8
-
Exclude genes that fewer than K tumors have mutations, K = 3
For multi-class clinical features (nominal or ordinal), Chi-square tests (Greenwood and Nikulin 1996) were used to estimate the P values using the 'chisq.test' function in R
For binary or multi-class clinical features (nominal or ordinal), two-tailed Fisher's exact tests (Fisher 1922) were used to estimate the P values using the 'fisher.test' function in R
For multiple hypothesis correction, Q value is the False Discovery Rate (FDR) analogue of the P value (Benjamini and Hochberg 1995), defined as the minimum FDR at which the test may be called significant. We used the 'Benjamini and Hochberg' method of 'p.adjust' function in R to convert P values into Q values.
This is an experimental feature. The full results of the analysis summarized in this report can be downloaded from the TCGA Data Coordination Center.