This pipeline uses various statistical tests to identify genes whose promoter methylation levels correlated to selected clinical features.
Testing the association between 17318 genes and 8 clinical features across 529 samples, statistically thresholded by Q value < 0.05, 7 clinical features related to at least one genes.
-
1 gene correlated to 'Time to Death'.
-
CDC73
-
131 genes correlated to 'AGE'.
-
KIF15 , MEX3C , EGR2 , C10ORF35 , LGALS8 , ...
-
189 genes correlated to 'GENDER'.
-
ALDOC , ZNF486 , CRIP1 , DNAJC15 , NMNAT3 , ...
-
162 genes correlated to 'RADIATIONS.RADIATION.REGIMENINDICATION'.
-
CCDC86 , NDUFB4 , TUBA4B , MAP1LC3B2 , CCDC85B , ...
-
12 genes correlated to 'DISTANT.METASTASIS'.
-
NHEDC1 , RHBDL3 , MMAB , SAG , PACRGL , ...
-
68 genes correlated to 'LYMPH.NODE.METASTASIS'.
-
SS18L1 , ZNF235 , MANBAL , HCRTR2 , TMEM33 , ...
-
22 genes correlated to 'NEOPLASM.DISEASESTAGE'.
-
IDH3B , DYNLT1 , WDR74 , DRG2 , RHBDL3 , ...
-
No genes correlated to 'NUMBER.OF.LYMPH.NODES'
Complete statistical result table is provided in Supplement Table 1
Table 1. Get Full Table This table shows the clinical features, statistical methods used, and the number of genes that are significantly associated with each clinical feature at Q value < 0.05.
| Clinical feature | Statistical test | Significant genes | Associated with | Associated with | ||
|---|---|---|---|---|---|---|
| Time to Death | Cox regression test | N=1 | shorter survival | N=0 | longer survival | N=1 |
| AGE | Spearman correlation test | N=131 | older | N=119 | younger | N=12 |
| GENDER | t test | N=189 | male | N=42 | female | N=147 |
| RADIATIONS RADIATION REGIMENINDICATION | t test | N=162 | yes | N=137 | no | N=25 |
| DISTANT METASTASIS | ANOVA test | N=12 | ||||
| LYMPH NODE METASTASIS | ANOVA test | N=68 | ||||
| NUMBER OF LYMPH NODES | Spearman correlation test | N=0 | ||||
| NEOPLASM DISEASESTAGE | ANOVA test | N=22 |
Table S1. Basic characteristics of clinical feature: 'Time to Death'
| Time to Death | Duration (Months) | 0-223.4 (median=17.9) |
| censored | N = 443 | |
| death | N = 58 | |
| Significant markers | N = 1 | |
| associated with shorter survival | 0 | |
| associated with longer survival | 1 |
Table S2. Get Full Table List of one gene significantly associated with 'Time to Death' by Cox regression test
| HazardRatio | Wald_P | Q | C_index | |
|---|---|---|---|---|
| CDC73 | 0 | 1.407e-06 | 0.024 | 0.355 |
Figure S1. Get High-res Image As an example, this figure shows the association of CDC73 to 'Time to Death'. four curves present the cumulative survival rates of 4 quartile subsets of patients. P value = 1.41e-06 with univariate Cox regression analysis using continuous log-2 expression values.
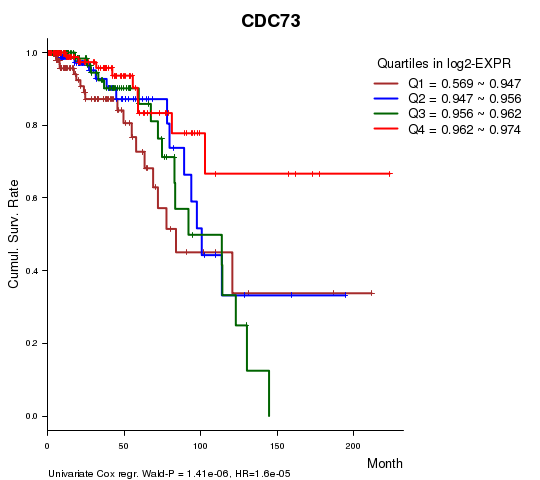
Table S3. Basic characteristics of clinical feature: 'AGE'
| AGE | Mean (SD) | 57.58 (13) |
| Significant markers | N = 131 | |
| pos. correlated | 119 | |
| neg. correlated | 12 |
Table S4. Get Full Table List of top 10 genes significantly correlated to 'AGE' by Spearman correlation test
| SpearmanCorr | corrP | Q | |
|---|---|---|---|
| KIF15 | 0.3171 | 8.453e-14 | 1.46e-09 |
| MEX3C | 0.2847 | 2.668e-11 | 4.62e-07 |
| EGR2 | 0.284 | 2.983e-11 | 5.17e-07 |
| C10ORF35 | 0.2822 | 3.997e-11 | 6.92e-07 |
| LGALS8 | -0.2817 | 4.347e-11 | 7.53e-07 |
| RPL13A | 0.2792 | 6.589e-11 | 1.14e-06 |
| FASN | 0.2735 | 1.631e-10 | 2.82e-06 |
| RPL27A | 0.2654 | 5.773e-10 | 9.99e-06 |
| RPL7A | 0.2643 | 6.913e-10 | 1.2e-05 |
| CACNA2D1 | 0.2625 | 9.072e-10 | 1.57e-05 |
Figure S2. Get High-res Image As an example, this figure shows the association of KIF15 to 'AGE'. P value = 8.45e-14 with Spearman correlation analysis. The straight line presents the best linear regression.
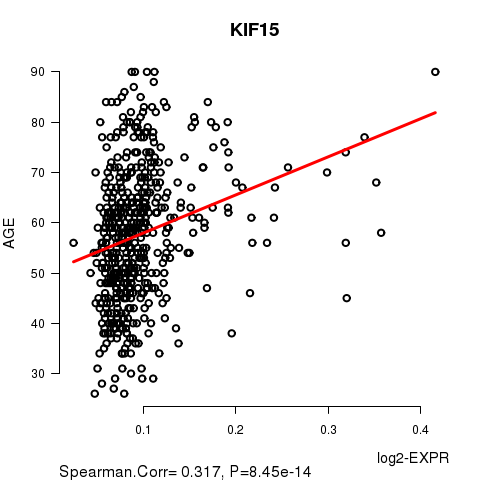
Table S5. Basic characteristics of clinical feature: 'GENDER'
| GENDER | Labels | N |
| FEMALE | 523 | |
| MALE | 6 | |
| Significant markers | N = 189 | |
| Higher in MALE | 42 | |
| Higher in FEMALE | 147 |
Table S6. Get Full Table List of top 10 genes differentially expressed by 'GENDER'
| T(pos if higher in 'MALE') | ttestP | Q | AUC | |
|---|---|---|---|---|
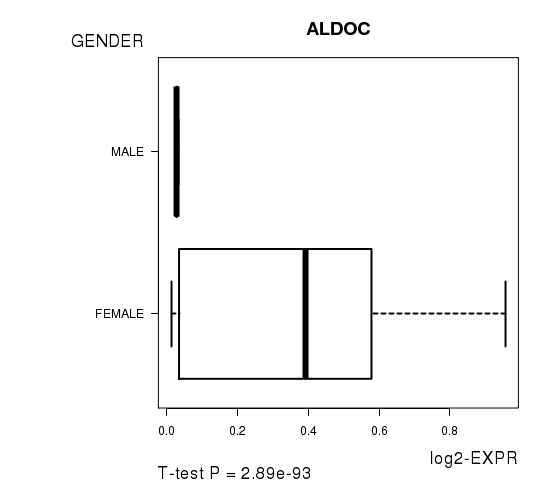
| ALDOC | -25.64 | 2.894e-93 | 5.01e-89 | 0.8674 |
| ZNF486 | -18.28 | 5.134e-58 | 8.89e-54 | 0.8174 |
| CRIP1 | -16.89 | 1.803e-51 | 3.12e-47 | 0.8725 |
| DNAJC15 | -13.78 | 1.012e-35 | 1.75e-31 | 0.7333 |
| NMNAT3 | -13.23 | 4.002e-34 | 6.93e-30 | 0.6918 |
| LOC400043 | -13.14 | 3.487e-31 | 6.04e-27 | 0.6025 |
| RND2 | -13.17 | 1.867e-28 | 3.23e-24 | 0.7916 |
| EML1 | -11.43 | 5.597e-27 | 9.69e-23 | 0.6083 |
| SPC25 | -12.2 | 2.984e-26 | 5.17e-22 | 0.7511 |
| HSPC157 | -12.96 | 6.478e-25 | 1.12e-20 | 0.6316 |
Figure S3. Get High-res Image As an example, this figure shows the association of ALDOC to 'GENDER'. P value = 2.89e-93 with T-test analysis.
162 genes related to 'RADIATIONS.RADIATION.REGIMENINDICATION'.
Table S7. Basic characteristics of clinical feature: 'RADIATIONS.RADIATION.REGIMENINDICATION'
| RADIATIONS.RADIATION.REGIMENINDICATION | Labels | N |
| NO | 136 | |
| YES | 393 | |
| Significant markers | N = 162 | |
| Higher in YES | 137 | |
| Higher in NO | 25 |
Table S8. Get Full Table List of top 10 genes differentially expressed by 'RADIATIONS.RADIATION.REGIMENINDICATION'
| T(pos if higher in 'YES') | ttestP | Q | AUC | |
|---|---|---|---|---|
| CCDC86 | 6.93 | 2.83e-11 | 4.9e-07 | 0.6861 |
| NDUFB4 | 6.75 | 8.099e-11 | 1.4e-06 | 0.6755 |
| TUBA4B | 6.56 | 1.632e-10 | 2.83e-06 | 0.6468 |
| MAP1LC3B2 | -6.44 | 6.1e-10 | 1.06e-05 | 0.6724 |
| CCDC85B | 6.35 | 8.372e-10 | 1.45e-05 | 0.6659 |
| DDX54 | 6.21 | 1.701e-09 | 2.95e-05 | 0.6555 |
| HS1BP3 | 6.18 | 1.949e-09 | 3.37e-05 | 0.6629 |
| PTRH1 | 6.08 | 2.335e-09 | 4.04e-05 | 0.6173 |
| TICAM1 | 6.17 | 2.396e-09 | 4.15e-05 | 0.6634 |
| MAP3K10 | 6.14 | 2.567e-09 | 4.44e-05 | 0.6489 |
Figure S4. Get High-res Image As an example, this figure shows the association of CCDC86 to 'RADIATIONS.RADIATION.REGIMENINDICATION'. P value = 2.83e-11 with T-test analysis.
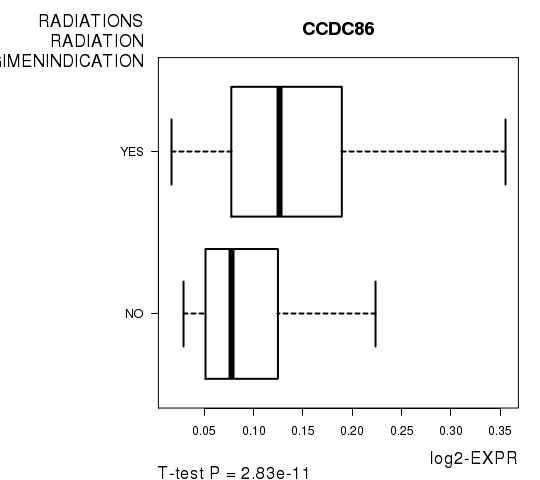
Table S9. Basic characteristics of clinical feature: 'DISTANT.METASTASIS'
| DISTANT.METASTASIS | Labels | N |
| CM0 (I+) | 1 | |
| M0 | 459 | |
| M1 | 6 | |
| MX | 63 | |
| Significant markers | N = 12 |
Table S10. Get Full Table List of top 10 genes differentially expressed by 'DISTANT.METASTASIS'
| ANOVA_P | Q | |
|---|---|---|
| NHEDC1 | 6.226e-25 | 1.08e-20 |
| RHBDL3 | 2.073e-21 | 3.59e-17 |
| MMAB | 6.627e-20 | 1.15e-15 |
| SAG | 4.444e-11 | 7.7e-07 |
| PACRGL | 1.58e-09 | 2.74e-05 |
| C9ORF153 | 9.672e-09 | 0.000167 |
| TRIM21 | 1.656e-07 | 0.00287 |
| ABHD10 | 2.799e-07 | 0.00484 |
| LARS | 2.919e-07 | 0.00505 |
| CRKL | 1.092e-06 | 0.0189 |
Figure S5. Get High-res Image As an example, this figure shows the association of NHEDC1 to 'DISTANT.METASTASIS'. P value = 6.23e-25 with ANOVA analysis.
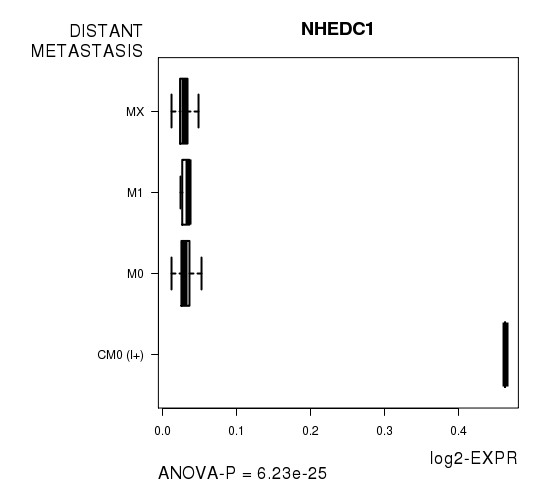
Table S11. Basic characteristics of clinical feature: 'LYMPH.NODE.METASTASIS'
| LYMPH.NODE.METASTASIS | Labels | N |
| N0 | 141 | |
| N0 (I+) | 14 | |
| N0 (I-) | 74 | |
| N0 (MOL+) | 1 | |
| N1 | 70 | |
| N1A | 81 | |
| N1B | 23 | |
| N1C | 2 | |
| N1MI | 13 | |
| N2 | 37 | |
| N2A | 38 | |
| N3 | 11 | |
| N3A | 16 | |
| N3B | 1 | |
| NX | 7 | |
| Significant markers | N = 68 |
Table S12. Get Full Table List of top 10 genes differentially expressed by 'LYMPH.NODE.METASTASIS'
| ANOVA_P | Q | |
|---|---|---|
| SS18L1 | 6.738e-72 | 1.17e-67 |
| ZNF235 | 2.768e-51 | 4.79e-47 |
| MANBAL | 1.293e-34 | 2.24e-30 |
| HCRTR2 | 5.343e-25 | 9.25e-21 |
| TMEM33 | 3.921e-20 | 6.79e-16 |
| ZNF33A | 5.597e-19 | 9.69e-15 |
| SCRN2 | 5.621e-16 | 9.73e-12 |
| ING5 | 1.378e-12 | 2.38e-08 |
| KCNQ5 | 4.066e-11 | 7.04e-07 |
| TMEM208 | 2.539e-10 | 4.39e-06 |
Figure S6. Get High-res Image As an example, this figure shows the association of SS18L1 to 'LYMPH.NODE.METASTASIS'. P value = 6.74e-72 with ANOVA analysis.
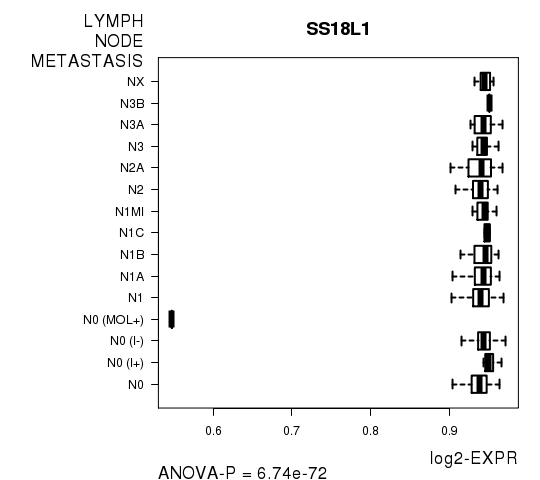
Table S13. Basic characteristics of clinical feature: 'NUMBER.OF.LYMPH.NODES'
| NUMBER.OF.LYMPH.NODES | Mean (SD) | 2.42 (4.5) |
| Significant markers | N = 0 |
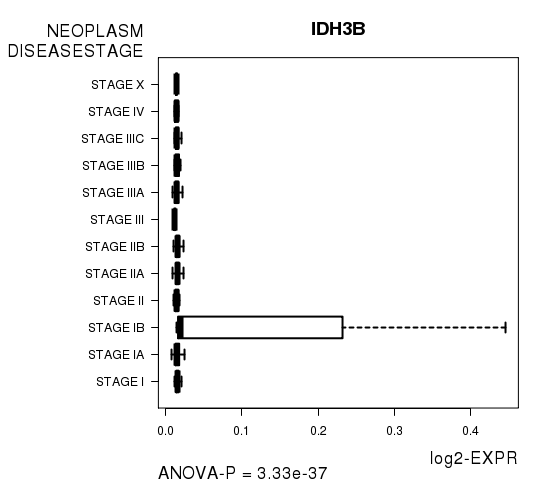
Table S14. Basic characteristics of clinical feature: 'NEOPLASM.DISEASESTAGE'
| NEOPLASM.DISEASESTAGE | Labels | N |
| STAGE I | 43 | |
| STAGE IA | 37 | |
| STAGE IB | 3 | |
| STAGE II | 8 | |
| STAGE IIA | 177 | |
| STAGE IIB | 119 | |
| STAGE III | 2 | |
| STAGE IIIA | 89 | |
| STAGE IIIB | 14 | |
| STAGE IIIC | 25 | |
| STAGE IV | 6 | |
| STAGE X | 5 | |
| Significant markers | N = 22 |
Table S15. Get Full Table List of top 10 genes differentially expressed by 'NEOPLASM.DISEASESTAGE'
| ANOVA_P | Q | |
|---|---|---|
| IDH3B | 3.333e-37 | 5.77e-33 |
| DYNLT1 | 7.721e-31 | 1.34e-26 |
| WDR74 | 3.546e-17 | 6.14e-13 |
| DRG2 | 1.076e-16 | 1.86e-12 |
| RHBDL3 | 1.787e-16 | 3.09e-12 |
| MMAB | 8.216e-15 | 1.42e-10 |
| ATP5J | 2.335e-14 | 4.04e-10 |
| SAG | 4.577e-12 | 7.92e-08 |
| HIST1H4C | 5.896e-12 | 1.02e-07 |
| TTC32 | 2.025e-11 | 3.5e-07 |
Figure S7. Get High-res Image As an example, this figure shows the association of IDH3B to 'NEOPLASM.DISEASESTAGE'. P value = 3.33e-37 with ANOVA analysis.
-
Expresson data file = BRCA-TP.meth.for_correlation.filtered_data.txt
-
Clinical data file = BRCA-TP.clin.merged.picked.txt
-
Number of patients = 529
-
Number of genes = 17318
-
Number of clinical features = 8
For survival clinical features, Wald's test in univariate Cox regression analysis with proportional hazards model (Andersen and Gill 1982) was used to estimate the P values using the 'coxph' function in R. Kaplan-Meier survival curves were plot using the four quartile subgroups of patients based on expression levels
For continuous numerical clinical features, Spearman's rank correlation coefficients (Spearman 1904) and two-tailed P values were estimated using 'cor.test' function in R
For two-class clinical features, two-tailed Student's t test with unequal variance (Lehmann and Romano 2005) was applied to compare the log2-expression levels between the two clinical classes using 't.test' function in R
For multi-class clinical features (ordinal or nominal), one-way analysis of variance (Howell 2002) was applied to compare the log2-expression levels between different clinical classes using 'anova' function in R
For multiple hypothesis correction, Q value is the False Discovery Rate (FDR) analogue of the P value (Benjamini and Hochberg 1995), defined as the minimum FDR at which the test may be called significant. We used the 'Benjamini and Hochberg' method of 'p.adjust' function in R to convert P values into Q values.
This is an experimental feature. The full results of the analysis summarized in this report can be downloaded from the TCGA Data Coordination Center.