This pipeline uses various statistical tests to identify mRNAs whose expression levels correlated to selected clinical features.
Testing the association between 17814 genes and 8 clinical features across 527 samples, statistically thresholded by Q value < 0.05, 7 clinical features related to at least one genes.
-
2 genes correlated to 'Time to Death'.
-
RPS26 , PPP1R14D
-
427 genes correlated to 'AGE'.
-
ESR1 , CNTNAP3 , KRT17 , MAGED4B , KLK6 , ...
-
6 genes correlated to 'GENDER'.
-
PI3 , TMEM16C , CACNG1 , RP13-36C9.6 , MAPK4 , ...
-
1 gene correlated to 'RADIATIONS.RADIATION.REGIMENINDICATION'.
-
OR13C4
-
10 genes correlated to 'LYMPH.NODE.METASTASIS'.
-
PIK3CA , KCNMB2 , GUCA2A , ARID1B , AMTN , ...
-
1 gene correlated to 'NUMBER.OF.LYMPH.NODES'.
-
CSDE1
-
19 genes correlated to 'NEOPLASM.DISEASESTAGE'.
-
NGFB , OR1M1 , C20ORF71 , PRKACG , OR6K3 , ...
-
No genes correlated to 'DISTANT.METASTASIS'
Complete statistical result table is provided in Supplement Table 1
Table 1. Get Full Table This table shows the clinical features, statistical methods used, and the number of genes that are significantly associated with each clinical feature at Q value < 0.05.
| Clinical feature | Statistical test | Significant genes | Associated with | Associated with | ||
|---|---|---|---|---|---|---|
| Time to Death | Cox regression test | N=2 | shorter survival | N=2 | longer survival | N=0 |
| AGE | Spearman correlation test | N=427 | older | N=205 | younger | N=222 |
| GENDER | t test | N=6 | male | N=1 | female | N=5 |
| RADIATIONS RADIATION REGIMENINDICATION | t test | N=1 | yes | N=1 | no | N=0 |
| DISTANT METASTASIS | ANOVA test | N=0 | ||||
| LYMPH NODE METASTASIS | ANOVA test | N=10 | ||||
| NUMBER OF LYMPH NODES | Spearman correlation test | N=1 | higher number.of.lymph.nodes | N=0 | lower number.of.lymph.nodes | N=1 |
| NEOPLASM DISEASESTAGE | ANOVA test | N=19 |
Table S1. Basic characteristics of clinical feature: 'Time to Death'
| Time to Death | Duration (Months) | 0.1-223.4 (median=24.2) |
| censored | N = 430 | |
| death | N = 65 | |
| Significant markers | N = 2 | |
| associated with shorter survival | 2 | |
| associated with longer survival | 0 |
Table S2. Get Full Table List of 2 genes significantly associated with 'Time to Death' by Cox regression test
| HazardRatio | Wald_P | Q | C_index | |
|---|---|---|---|---|
| RPS26 | 2.7 | 9.679e-08 | 0.0017 | 0.682 |
| PPP1R14D | 2.3 | 2.923e-07 | 0.0052 | 0.592 |
Figure S1. Get High-res Image As an example, this figure shows the association of RPS26 to 'Time to Death'. four curves present the cumulative survival rates of 4 quartile subsets of patients. P value = 9.68e-08 with univariate Cox regression analysis using continuous log-2 expression values.
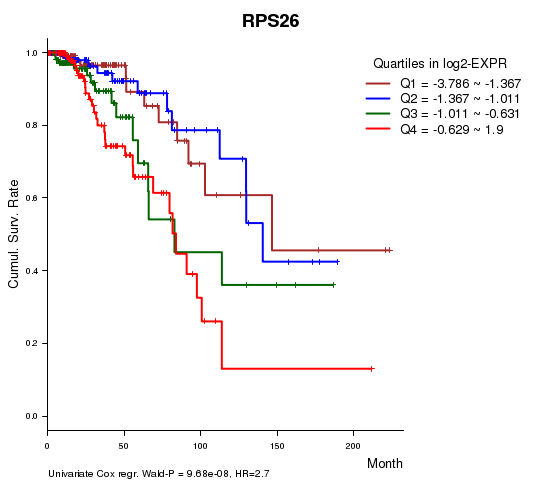
Table S3. Basic characteristics of clinical feature: 'AGE'
| AGE | Mean (SD) | 57.88 (13) |
| Significant markers | N = 427 | |
| pos. correlated | 205 | |
| neg. correlated | 222 |
Table S4. Get Full Table List of top 10 genes significantly correlated to 'AGE' by Spearman correlation test
| SpearmanCorr | corrP | Q | |
|---|---|---|---|
| ESR1 | 0.4215 | 4.056e-24 | 7.22e-20 |
| CNTNAP3 | -0.3002 | 1.939e-12 | 3.45e-08 |
| KRT17 | -0.2978 | 2.98e-12 | 5.31e-08 |
| MAGED4B | -0.2961 | 4.005e-12 | 7.13e-08 |
| KLK6 | -0.293 | 6.874e-12 | 1.22e-07 |
| FOXD2 | 0.2923 | 7.731e-12 | 1.38e-07 |
| NUDT16 | 0.2903 | 1.079e-11 | 1.92e-07 |
| PPP1R14C | -0.2899 | 1.158e-11 | 2.06e-07 |
| MGC102966 | -0.2878 | 1.652e-11 | 2.94e-07 |
| SYT8 | -0.2875 | 1.736e-11 | 3.09e-07 |
Figure S2. Get High-res Image As an example, this figure shows the association of ESR1 to 'AGE'. P value = 4.06e-24 with Spearman correlation analysis. The straight line presents the best linear regression.
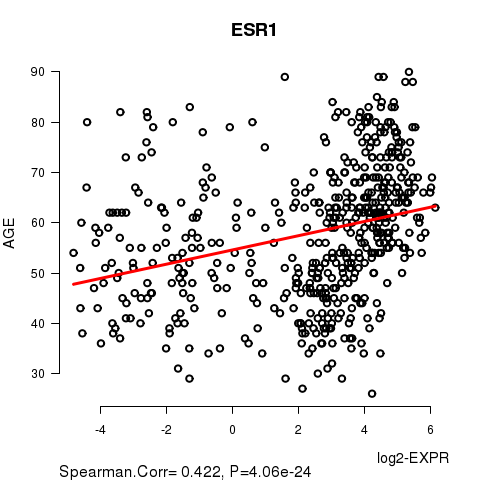
Table S5. Basic characteristics of clinical feature: 'GENDER'
| GENDER | Labels | N |
| FEMALE | 521 | |
| MALE | 6 | |
| Significant markers | N = 6 | |
| Higher in MALE | 1 | |
| Higher in FEMALE | 5 |
Table S6. Get Full Table List of 6 genes differentially expressed by 'GENDER'
| T(pos if higher in 'MALE') | ttestP | Q | AUC | |
|---|---|---|---|---|
| PI3 | -9.27 | 5.072e-11 | 9.03e-07 | 0.7086 |
| TMEM16C | -14.25 | 1.281e-10 | 2.28e-06 | 0.9258 |
| CACNG1 | 18.37 | 1.822e-08 | 0.000325 | 0.961 |
| RP13-36C9.6 | -6.21 | 9.464e-07 | 0.0169 | 0.6638 |
| MAPK4 | -9.12 | 1.385e-06 | 0.0247 | 0.802 |
| PLA2G3 | -10.63 | 1.726e-06 | 0.0307 | 0.8305 |
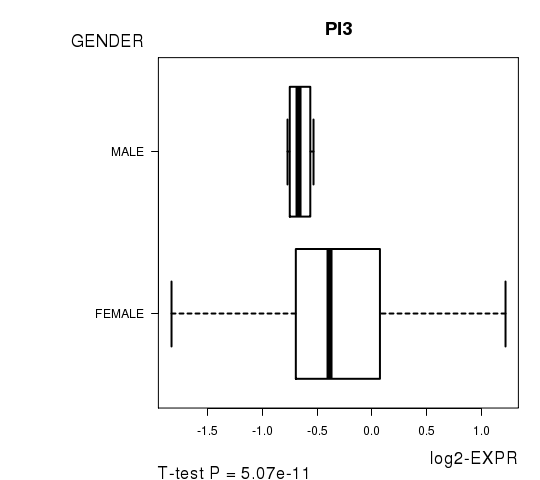
Figure S3. Get High-res Image As an example, this figure shows the association of PI3 to 'GENDER'. P value = 5.07e-11 with T-test analysis.
One gene related to 'RADIATIONS.RADIATION.REGIMENINDICATION'.
Table S7. Basic characteristics of clinical feature: 'RADIATIONS.RADIATION.REGIMENINDICATION'
| RADIATIONS.RADIATION.REGIMENINDICATION | Labels | N |
| NO | 148 | |
| YES | 379 | |
| Significant markers | N = 1 | |
| Higher in YES | 1 | |
| Higher in NO | 0 |
Table S8. Get Full Table List of one gene differentially expressed by 'RADIATIONS.RADIATION.REGIMENINDICATION'
| T(pos if higher in 'YES') | ttestP | Q | AUC | |
|---|---|---|---|---|
| OR13C4 | 4.98 | 1.158e-06 | 0.0206 | 0.6251 |
Figure S4. Get High-res Image As an example, this figure shows the association of OR13C4 to 'RADIATIONS.RADIATION.REGIMENINDICATION'. P value = 1.16e-06 with T-test analysis.
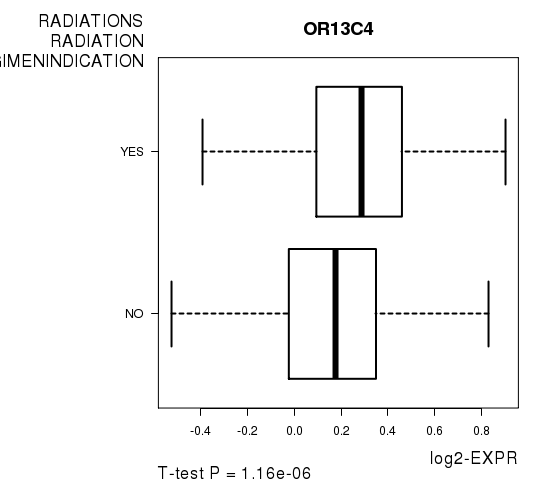
Table S9. Basic characteristics of clinical feature: 'DISTANT.METASTASIS'
| DISTANT.METASTASIS | Labels | N |
| CM0 (I+) | 2 | |
| M0 | 497 | |
| M1 | 14 | |
| MX | 14 | |
| Significant markers | N = 0 |
Table S10. Basic characteristics of clinical feature: 'LYMPH.NODE.METASTASIS'
| LYMPH.NODE.METASTASIS | Labels | N |
| N0 | 138 | |
| N0 (I+) | 16 | |
| N0 (I-) | 101 | |
| N1 | 59 | |
| N1A | 77 | |
| N1B | 20 | |
| N1C | 2 | |
| N1MI | 13 | |
| N2 | 32 | |
| N2A | 29 | |
| N3 | 10 | |
| N3A | 18 | |
| N3C | 1 | |
| NX | 11 | |
| Significant markers | N = 10 |
Table S11. Get Full Table List of 10 genes differentially expressed by 'LYMPH.NODE.METASTASIS'
| ANOVA_P | Q | |
|---|---|---|
| PIK3CA | 8.972e-25 | 1.6e-20 |
| KCNMB2 | 3.214e-18 | 5.73e-14 |
| GUCA2A | 2.841e-12 | 5.06e-08 |
| ARID1B | 5.362e-08 | 0.000955 |
| AMTN | 6.805e-08 | 0.00121 |
| REG1B | 7.563e-08 | 0.00135 |
| SULT1B1 | 2.291e-07 | 0.00408 |
| C16ORF44 | 4.572e-07 | 0.00814 |
| PDS5A | 4.665e-07 | 0.00831 |
| ZMAT3 | 1.279e-06 | 0.0228 |
Figure S5. Get High-res Image As an example, this figure shows the association of PIK3CA to 'LYMPH.NODE.METASTASIS'. P value = 8.97e-25 with ANOVA analysis.
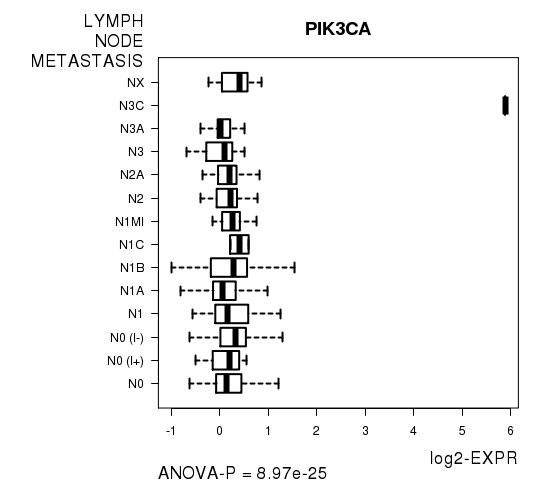
Table S12. Basic characteristics of clinical feature: 'NUMBER.OF.LYMPH.NODES'
| NUMBER.OF.LYMPH.NODES | Mean (SD) | 1.82 (3.5) |
| Significant markers | N = 1 | |
| pos. correlated | 0 | |
| neg. correlated | 1 |
Table S13. Get Full Table List of one gene significantly correlated to 'NUMBER.OF.LYMPH.NODES' by Spearman correlation test
| SpearmanCorr | corrP | Q | |
|---|---|---|---|
| CSDE1 | -0.2441 | 6.22e-07 | 0.0111 |
Figure S6. Get High-res Image As an example, this figure shows the association of CSDE1 to 'NUMBER.OF.LYMPH.NODES'. P value = 6.22e-07 with Spearman correlation analysis. The straight line presents the best linear regression.
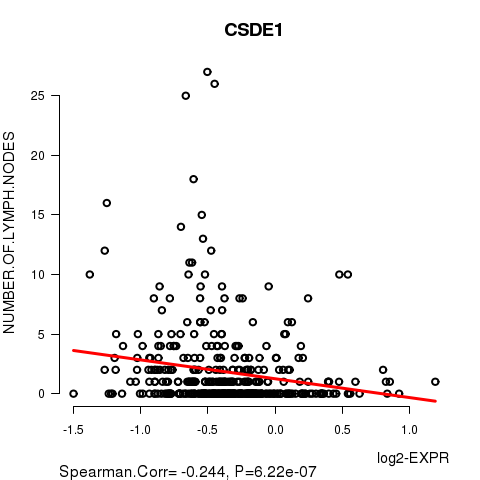
Table S14. Basic characteristics of clinical feature: 'NEOPLASM.DISEASESTAGE'
| NEOPLASM.DISEASESTAGE | Labels | N |
| STAGE I | 42 | |
| STAGE IA | 41 | |
| STAGE IB | 6 | |
| STAGE IIA | 185 | |
| STAGE IIB | 111 | |
| STAGE IIIA | 77 | |
| STAGE IIIB | 15 | |
| STAGE IIIC | 19 | |
| STAGE IV | 14 | |
| STAGE TIS | 1 | |
| STAGE X | 16 | |
| Significant markers | N = 19 |
Table S15. Get Full Table List of top 10 genes differentially expressed by 'NEOPLASM.DISEASESTAGE'
| ANOVA_P | Q | |
|---|---|---|
| NGFB | 5.856e-23 | 1.04e-18 |
| OR1M1 | 4.173e-20 | 7.43e-16 |
| C20ORF71 | 4.378e-13 | 7.8e-09 |
| PRKACG | 9.103e-13 | 1.62e-08 |
| OR6K3 | 9.582e-12 | 1.71e-07 |
| IFNA7 | 1.876e-11 | 3.34e-07 |
| OR1J4 | 6.796e-10 | 1.21e-05 |
| GPR52 | 1.641e-09 | 2.92e-05 |
| SEBOX | 1.812e-09 | 3.23e-05 |
| TAS2R40 | 2.263e-09 | 4.03e-05 |
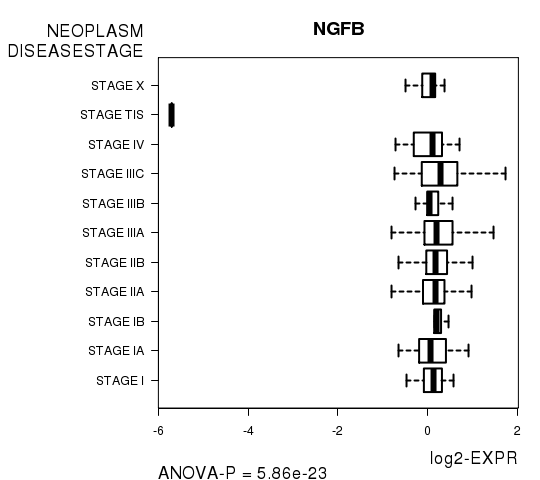
Figure S7. Get High-res Image As an example, this figure shows the association of NGFB to 'NEOPLASM.DISEASESTAGE'. P value = 5.86e-23 with ANOVA analysis.
-
Expresson data file = BRCA-TP.medianexp.txt
-
Clinical data file = BRCA-TP.clin.merged.picked.txt
-
Number of patients = 527
-
Number of genes = 17814
-
Number of clinical features = 8
For survival clinical features, Wald's test in univariate Cox regression analysis with proportional hazards model (Andersen and Gill 1982) was used to estimate the P values using the 'coxph' function in R. Kaplan-Meier survival curves were plot using the four quartile subgroups of patients based on expression levels
For continuous numerical clinical features, Spearman's rank correlation coefficients (Spearman 1904) and two-tailed P values were estimated using 'cor.test' function in R
For two-class clinical features, two-tailed Student's t test with unequal variance (Lehmann and Romano 2005) was applied to compare the log2-expression levels between the two clinical classes using 't.test' function in R
For multi-class clinical features (ordinal or nominal), one-way analysis of variance (Howell 2002) was applied to compare the log2-expression levels between different clinical classes using 'anova' function in R
For multiple hypothesis correction, Q value is the False Discovery Rate (FDR) analogue of the P value (Benjamini and Hochberg 1995), defined as the minimum FDR at which the test may be called significant. We used the 'Benjamini and Hochberg' method of 'p.adjust' function in R to convert P values into Q values.
This is an experimental feature. The full results of the analysis summarized in this report can be downloaded from the TCGA Data Coordination Center.