This pipeline uses various statistical tests to identify mRNAs whose expression levels correlated to selected clinical features.
Testing the association between 18254 genes and 8 clinical features across 836 samples, statistically thresholded by Q value < 0.05, 6 clinical features related to at least one genes.
-
4 genes correlated to 'Time to Death'.
-
DIP2B|57609 , PGK1|5230 , CAND1|55832 , IRF2|3660
-
691 genes correlated to 'AGE'.
-
ESR1|2099 , TFPI2|7980 , LRFN5|145581 , TMEFF1|8577 , SOBP|55084 , ...
-
18 genes correlated to 'GENDER'.
-
NLGN4Y|22829 , ZFY|7544 , PRKY|5616 , C7ORF10|79783 , SYT9|143425 , ...
-
73 genes correlated to 'LYMPH.NODE.METASTASIS'.
-
PIK3CA|5290 , BTBD10|84280 , RPL35|11224 , HSPA8|3312 , C19ORF21|126353 , ...
-
1 gene correlated to 'NUMBER.OF.LYMPH.NODES'.
-
HMSD|284293
-
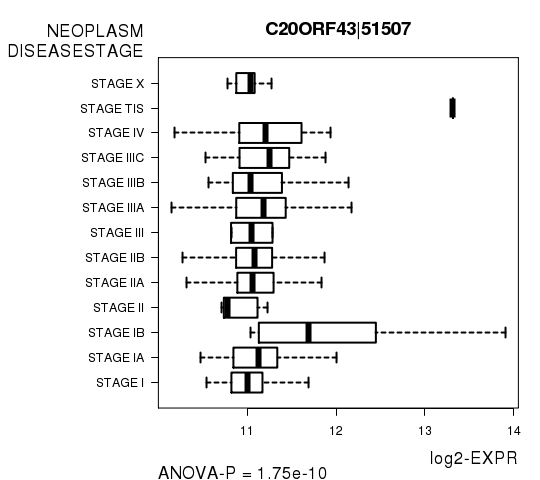
3 genes correlated to 'NEOPLASM.DISEASESTAGE'.
-
C20ORF43|51507 , CSTF1|1477 , PGGT1B|5229
-
No genes correlated to 'RADIATIONS.RADIATION.REGIMENINDICATION', and 'DISTANT.METASTASIS'.
Complete statistical result table is provided in Supplement Table 1
Table 1. Get Full Table This table shows the clinical features, statistical methods used, and the number of genes that are significantly associated with each clinical feature at Q value < 0.05.
| Clinical feature | Statistical test | Significant genes | Associated with | Associated with | ||
|---|---|---|---|---|---|---|
| Time to Death | Cox regression test | N=4 | shorter survival | N=3 | longer survival | N=1 |
| AGE | Spearman correlation test | N=691 | older | N=165 | younger | N=526 |
| GENDER | t test | N=18 | male | N=8 | female | N=10 |
| RADIATIONS RADIATION REGIMENINDICATION | t test | N=0 | ||||
| DISTANT METASTASIS | ANOVA test | N=0 | ||||
| LYMPH NODE METASTASIS | ANOVA test | N=73 | ||||
| NUMBER OF LYMPH NODES | Spearman correlation test | N=1 | higher number.of.lymph.nodes | N=0 | lower number.of.lymph.nodes | N=1 |
| NEOPLASM DISEASESTAGE | ANOVA test | N=3 |
Table S1. Basic characteristics of clinical feature: 'Time to Death'
| Time to Death | Duration (Months) | 0-223.4 (median=18.8) |
| censored | N = 685 | |
| death | N = 94 | |
| Significant markers | N = 4 | |
| associated with shorter survival | 3 | |
| associated with longer survival | 1 |
Table S2. Get Full Table List of 4 genes significantly associated with 'Time to Death' by Cox regression test
| HazardRatio | Wald_P | Q | C_index | |
|---|---|---|---|---|
| DIP2B|57609 | 2.9 | 1.599e-07 | 0.0029 | 0.635 |
| PGK1|5230 | 2 | 1.668e-06 | 0.03 | 0.685 |
| CAND1|55832 | 2.1 | 1.676e-06 | 0.031 | 0.629 |
| IRF2|3660 | 0.28 | 1.977e-06 | 0.036 | 0.329 |
Figure S1. Get High-res Image As an example, this figure shows the association of DIP2B|57609 to 'Time to Death'. four curves present the cumulative survival rates of 4 quartile subsets of patients. P value = 1.6e-07 with univariate Cox regression analysis using continuous log-2 expression values.
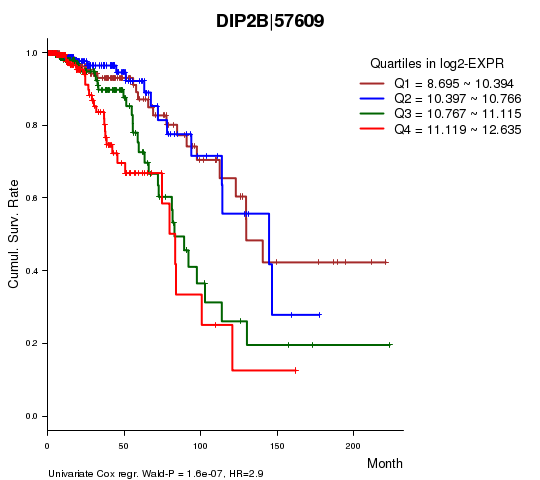
Table S3. Basic characteristics of clinical feature: 'AGE'
| AGE | Mean (SD) | 58.17 (13) |
| Significant markers | N = 691 | |
| pos. correlated | 165 | |
| neg. correlated | 526 |
Table S4. Get Full Table List of top 10 genes significantly correlated to 'AGE' by Spearman correlation test
| SpearmanCorr | corrP | Q | |
|---|---|---|---|
| ESR1|2099 | 0.3525 | 7.768e-26 | 1.42e-21 |
| TFPI2|7980 | -0.2691 | 3.222e-15 | 5.88e-11 |
| LRFN5|145581 | -0.2697 | 4.39e-15 | 8.01e-11 |
| TMEFF1|8577 | -0.2527 | 1.239e-13 | 2.26e-09 |
| SOBP|55084 | -0.2518 | 1.522e-13 | 2.78e-09 |
| DBX2|440097 | -0.2677 | 3.641e-13 | 6.64e-09 |
| DZIP1|22873 | -0.2452 | 6.76e-13 | 1.23e-08 |
| PCDH18|54510 | -0.2452 | 6.767e-13 | 1.23e-08 |
| RELN|5649 | -0.2474 | 7.641e-13 | 1.39e-08 |
| FXYD6|53826 | -0.2413 | 1.599e-12 | 2.92e-08 |
Figure S2. Get High-res Image As an example, this figure shows the association of ESR1|2099 to 'AGE'. P value = 7.77e-26 with Spearman correlation analysis. The straight line presents the best linear regression.
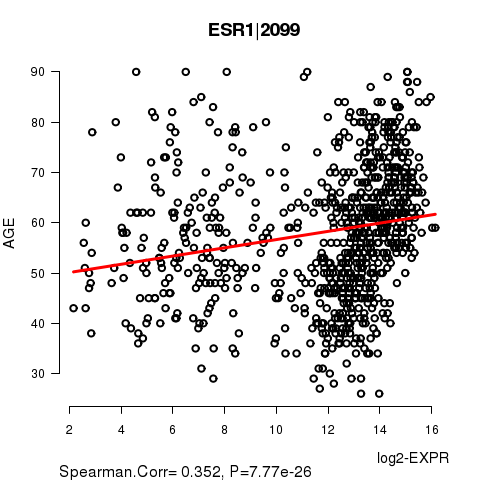
Table S5. Basic characteristics of clinical feature: 'GENDER'
| GENDER | Labels | N |
| FEMALE | 827 | |
| MALE | 9 | |
| Significant markers | N = 18 | |
| Higher in MALE | 8 | |
| Higher in FEMALE | 10 |
Table S6. Get Full Table List of top 10 genes differentially expressed by 'GENDER'
| T(pos if higher in 'MALE') | ttestP | Q | AUC | |
|---|---|---|---|---|
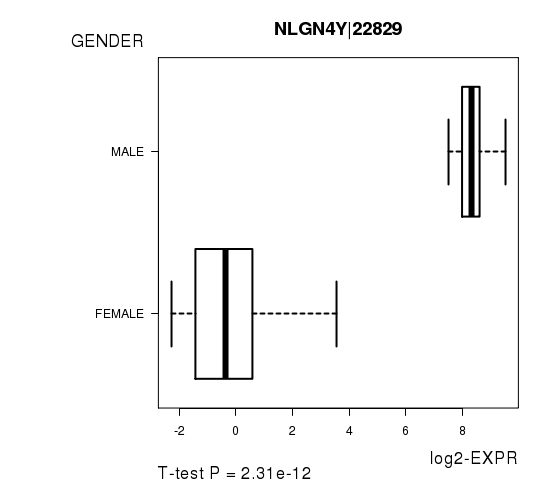
| NLGN4Y|22829 | 41.19 | 2.308e-12 | 4.15e-08 | 1 |
| ZFY|7544 | 41.95 | 1.793e-11 | 3.22e-07 | 1 |
| PRKY|5616 | 27.63 | 6.124e-10 | 1.1e-05 | 1 |
| C7ORF10|79783 | 8.66 | 3.577e-09 | 6.43e-05 | 0.6634 |
| SYT9|143425 | 12.5 | 6.154e-09 | 0.000111 | 0.795 |
| GSTA1|2938 | -16.05 | 8.896e-09 | 0.00016 | 0.8833 |
| MMP11|4320 | 11.05 | 1.652e-08 | 0.000297 | 0.7462 |
| RND2|8153 | 12.32 | 2.629e-08 | 0.000472 | 0.8353 |
| SNORA74B|677841 | -12 | 8.287e-08 | 0.00149 | 0.8348 |
| HTR4|3360 | -12.07 | 1.118e-07 | 0.00201 | 0.7909 |
Figure S3. Get High-res Image As an example, this figure shows the association of NLGN4Y|22829 to 'GENDER'. P value = 2.31e-12 with T-test analysis.
No gene related to 'RADIATIONS.RADIATION.REGIMENINDICATION'.
Table S7. Basic characteristics of clinical feature: 'RADIATIONS.RADIATION.REGIMENINDICATION'
| RADIATIONS.RADIATION.REGIMENINDICATION | Labels | N |
| NO | 204 | |
| YES | 632 | |
| Significant markers | N = 0 |
Table S8. Basic characteristics of clinical feature: 'DISTANT.METASTASIS'
| DISTANT.METASTASIS | Labels | N |
| CM0 (I+) | 2 | |
| M0 | 748 | |
| M1 | 15 | |
| MX | 71 | |
| Significant markers | N = 0 |
Table S9. Basic characteristics of clinical feature: 'LYMPH.NODE.METASTASIS'
| LYMPH.NODE.METASTASIS | Labels | N |
| N0 | 240 | |
| N0 (I+) | 22 | |
| N0 (I-) | 129 | |
| N0 (MOL+) | 1 | |
| N1 | 101 | |
| N1A | 124 | |
| N1B | 32 | |
| N1C | 2 | |
| N1MI | 22 | |
| N2 | 50 | |
| N2A | 50 | |
| N3 | 17 | |
| N3A | 29 | |
| N3B | 1 | |
| N3C | 1 | |
| NX | 15 | |
| Significant markers | N = 73 |
Table S10. Get Full Table List of top 10 genes differentially expressed by 'LYMPH.NODE.METASTASIS'
| ANOVA_P | Q | |
|---|---|---|
| PIK3CA|5290 | 2.679e-15 | 4.89e-11 |
| BTBD10|84280 | 1.717e-13 | 3.13e-09 |
| RPL35|11224 | 1.221e-10 | 2.23e-06 |
| HSPA8|3312 | 5.141e-10 | 9.38e-06 |
| C19ORF21|126353 | 1.081e-09 | 1.97e-05 |
| SERINC3|10955 | 1.136e-08 | 0.000207 |
| POLR2B|5431 | 1.558e-08 | 0.000284 |
| RPL12|6136 | 2.073e-08 | 0.000378 |
| RPL34|6164 | 4.636e-08 | 0.000846 |
| RPS19|6223 | 6.501e-08 | 0.00119 |
Figure S4. Get High-res Image As an example, this figure shows the association of PIK3CA|5290 to 'LYMPH.NODE.METASTASIS'. P value = 2.68e-15 with ANOVA analysis.
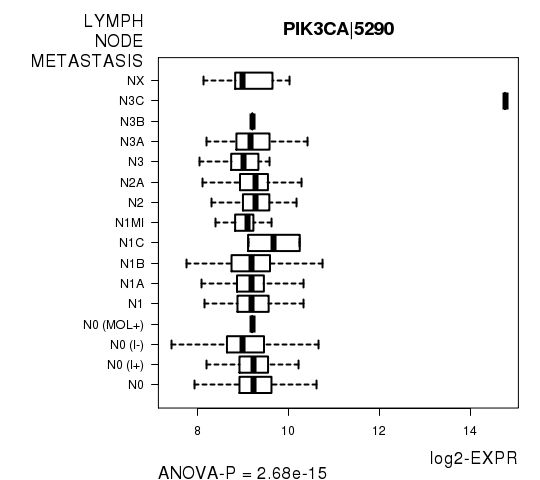
Table S11. Basic characteristics of clinical feature: 'NUMBER.OF.LYMPH.NODES'
| NUMBER.OF.LYMPH.NODES | Mean (SD) | 2.17 (4.3) |
| Significant markers | N = 1 | |
| pos. correlated | 0 | |
| neg. correlated | 1 |
Table S12. Get Full Table List of one gene significantly correlated to 'NUMBER.OF.LYMPH.NODES' by Spearman correlation test
| SpearmanCorr | corrP | Q | |
|---|---|---|---|
| HMSD|284293 | -0.2591 | 9.257e-08 | 0.00169 |
Figure S5. Get High-res Image As an example, this figure shows the association of HMSD|284293 to 'NUMBER.OF.LYMPH.NODES'. P value = 9.26e-08 with Spearman correlation analysis. The straight line presents the best linear regression.
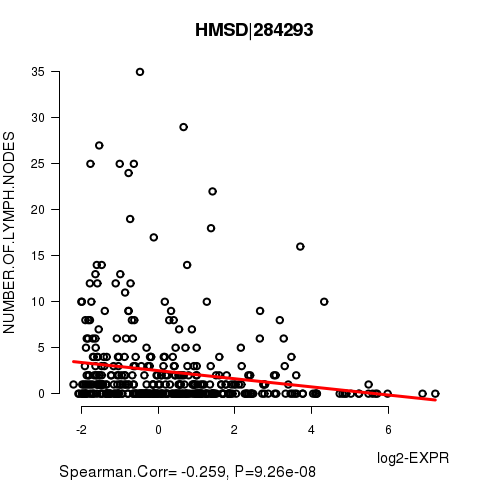
Table S13. Basic characteristics of clinical feature: 'NEOPLASM.DISEASESTAGE'
| NEOPLASM.DISEASESTAGE | Labels | N |
| STAGE I | 69 | |
| STAGE IA | 62 | |
| STAGE IB | 8 | |
| STAGE II | 8 | |
| STAGE IIA | 290 | |
| STAGE IIB | 185 | |
| STAGE III | 2 | |
| STAGE IIIA | 118 | |
| STAGE IIIB | 23 | |
| STAGE IIIC | 37 | |
| STAGE IV | 15 | |
| STAGE TIS | 1 | |
| STAGE X | 17 | |
| Significant markers | N = 3 |
Table S14. Get Full Table List of 3 genes differentially expressed by 'NEOPLASM.DISEASESTAGE'
| ANOVA_P | Q | |
|---|---|---|
| C20ORF43|51507 | 1.746e-10 | 3.19e-06 |
| CSTF1|1477 | 1.901e-08 | 0.000347 |
| PGGT1B|5229 | 7.471e-08 | 0.00136 |
Figure S6. Get High-res Image As an example, this figure shows the association of C20ORF43|51507 to 'NEOPLASM.DISEASESTAGE'. P value = 1.75e-10 with ANOVA analysis.
-
Expresson data file = BRCA-TP.uncv2.mRNAseq_RSEM_normalized_log2.txt
-
Clinical data file = BRCA-TP.clin.merged.picked.txt
-
Number of patients = 836
-
Number of genes = 18254
-
Number of clinical features = 8
For survival clinical features, Wald's test in univariate Cox regression analysis with proportional hazards model (Andersen and Gill 1982) was used to estimate the P values using the 'coxph' function in R. Kaplan-Meier survival curves were plot using the four quartile subgroups of patients based on expression levels
For continuous numerical clinical features, Spearman's rank correlation coefficients (Spearman 1904) and two-tailed P values were estimated using 'cor.test' function in R
For two-class clinical features, two-tailed Student's t test with unequal variance (Lehmann and Romano 2005) was applied to compare the log2-expression levels between the two clinical classes using 't.test' function in R
For multi-class clinical features (ordinal or nominal), one-way analysis of variance (Howell 2002) was applied to compare the log2-expression levels between different clinical classes using 'anova' function in R
For multiple hypothesis correction, Q value is the False Discovery Rate (FDR) analogue of the P value (Benjamini and Hochberg 1995), defined as the minimum FDR at which the test may be called significant. We used the 'Benjamini and Hochberg' method of 'p.adjust' function in R to convert P values into Q values.
This is an experimental feature. The full results of the analysis summarized in this report can be downloaded from the TCGA Data Coordination Center.