This pipeline uses various statistical tests to identify miRs whose expression levels correlated to selected clinical features.
Testing the association between 510 genes and 8 clinical features across 847 samples, statistically thresholded by Q value < 0.05, 4 clinical features related to at least one genes.
-
2 genes correlated to 'Time to Death'.
-
HSA-MIR-874 , HSA-MIR-148B
-
28 genes correlated to 'AGE'.
-
HSA-MIR-424 , HSA-MIR-381 , HSA-MIR-31 , HSA-MIR-598 , HSA-MIR-542 , ...
-
7 genes correlated to 'LYMPH.NODE.METASTASIS'.
-
HSA-MIR-874 , HSA-MIR-374C , HSA-MIR-328 , HSA-MIR-326 , HSA-MIR-197 , ...
-
8 genes correlated to 'NEOPLASM.DISEASESTAGE'.
-
HSA-MIR-143 , HSA-MIR-210 , HSA-LET-7F-2 , HSA-MIR-200A , HSA-MIR-338 , ...
-
No genes correlated to 'GENDER', 'RADIATIONS.RADIATION.REGIMENINDICATION', 'DISTANT.METASTASIS', and 'NUMBER.OF.LYMPH.NODES'.
Complete statistical result table is provided in Supplement Table 1
Table 1. Get Full Table This table shows the clinical features, statistical methods used, and the number of genes that are significantly associated with each clinical feature at Q value < 0.05.
| Clinical feature | Statistical test | Significant genes | Associated with | Associated with | ||
|---|---|---|---|---|---|---|
| Time to Death | Cox regression test | N=2 | shorter survival | N=2 | longer survival | N=0 |
| AGE | Spearman correlation test | N=28 | older | N=2 | younger | N=26 |
| GENDER | t test | N=0 | ||||
| RADIATIONS RADIATION REGIMENINDICATION | t test | N=0 | ||||
| DISTANT METASTASIS | ANOVA test | N=0 | ||||
| LYMPH NODE METASTASIS | ANOVA test | N=7 | ||||
| NUMBER OF LYMPH NODES | Spearman correlation test | N=0 | ||||
| NEOPLASM DISEASESTAGE | ANOVA test | N=8 |
Table S1. Basic characteristics of clinical feature: 'Time to Death'
| Time to Death | Duration (Months) | 0-223.4 (median=18.6) |
| censored | N = 693 | |
| death | N = 95 | |
| Significant markers | N = 2 | |
| associated with shorter survival | 2 | |
| associated with longer survival | 0 |
Table S2. Get Full Table List of 2 genes significantly associated with 'Time to Death' by Cox regression test
| HazardRatio | Wald_P | Q | C_index | |
|---|---|---|---|---|
| HSA-MIR-874 | 1.58 | 7.239e-06 | 0.0037 | 0.606 |
| HSA-MIR-148B | 1.8 | 4.374e-05 | 0.022 | 0.629 |
Figure S1. Get High-res Image As an example, this figure shows the association of HSA-MIR-874 to 'Time to Death'. four curves present the cumulative survival rates of 4 quartile subsets of patients. P value = 7.24e-06 with univariate Cox regression analysis using continuous log-2 expression values.
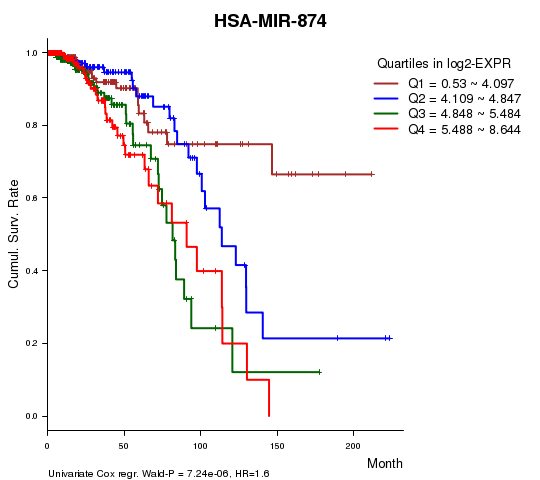
Table S3. Basic characteristics of clinical feature: 'AGE'
| AGE | Mean (SD) | 58.41 (13) |
| Significant markers | N = 28 | |
| pos. correlated | 2 | |
| neg. correlated | 26 |
Table S4. Get Full Table List of top 10 genes significantly correlated to 'AGE' by Spearman correlation test
| SpearmanCorr | corrP | Q | |
|---|---|---|---|
| HSA-MIR-424 | -0.2258 | 3.084e-11 | 1.57e-08 |
| HSA-MIR-381 | -0.2084 | 9.33e-10 | 4.75e-07 |
| HSA-MIR-31 | -0.2043 | 3.175e-09 | 1.61e-06 |
| HSA-MIR-598 | -0.1985 | 5.727e-09 | 2.9e-06 |
| HSA-MIR-542 | -0.197 | 7.524e-09 | 3.81e-06 |
| HSA-MIR-99A | -0.1895 | 2.778e-08 | 1.4e-05 |
| HSA-MIR-652 | -0.1774 | 2.075e-07 | 0.000105 |
| HSA-LET-7C | -0.1722 | 4.65e-07 | 0.000234 |
| HSA-MIR-450B | -0.1638 | 1.688e-06 | 0.000847 |
| HSA-MIR-125B-1 | -0.1533 | 7.517e-06 | 0.00377 |
Figure S2. Get High-res Image As an example, this figure shows the association of HSA-MIR-424 to 'AGE'. P value = 3.08e-11 with Spearman correlation analysis. The straight line presents the best linear regression.
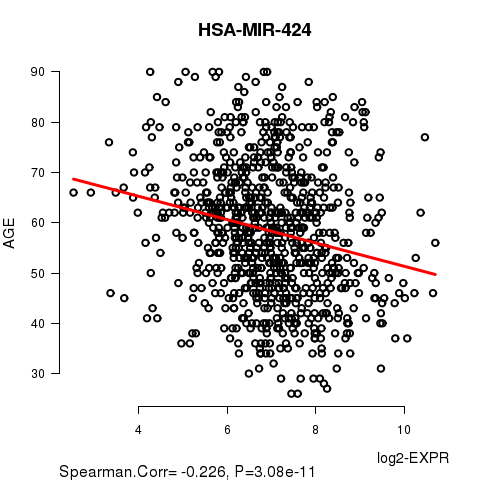
Table S5. Basic characteristics of clinical feature: 'GENDER'
| GENDER | Labels | N |
| FEMALE | 838 | |
| MALE | 9 | |
| Significant markers | N = 0 |
No gene related to 'RADIATIONS.RADIATION.REGIMENINDICATION'.
Table S6. Basic characteristics of clinical feature: 'RADIATIONS.RADIATION.REGIMENINDICATION'
| RADIATIONS.RADIATION.REGIMENINDICATION | Labels | N |
| NO | 205 | |
| YES | 642 | |
| Significant markers | N = 0 |
Table S7. Basic characteristics of clinical feature: 'DISTANT.METASTASIS'
| DISTANT.METASTASIS | Labels | N |
| CM0 (I+) | 2 | |
| M0 | 755 | |
| M1 | 14 | |
| MX | 76 | |
| Significant markers | N = 0 |
Table S8. Basic characteristics of clinical feature: 'LYMPH.NODE.METASTASIS'
| LYMPH.NODE.METASTASIS | Labels | N |
| N0 | 248 | |
| N0 (I+) | 22 | |
| N0 (I-) | 128 | |
| N0 (MOL+) | 1 | |
| N1 | 101 | |
| N1A | 125 | |
| N1B | 32 | |
| N1C | 2 | |
| N1MI | 23 | |
| N2 | 50 | |
| N2A | 50 | |
| N3 | 18 | |
| N3A | 29 | |
| N3B | 2 | |
| N3C | 1 | |
| NX | 15 | |
| Significant markers | N = 7 |
Table S9. Get Full Table List of 7 genes differentially expressed by 'LYMPH.NODE.METASTASIS'
| ANOVA_P | Q | |
|---|---|---|
| HSA-MIR-874 | 1.532e-08 | 7.81e-06 |
| HSA-MIR-374C | 2.336e-07 | 0.000119 |
| HSA-MIR-328 | 7.633e-06 | 0.00388 |
| HSA-MIR-326 | 1.14e-05 | 0.00578 |
| HSA-MIR-197 | 1.482e-05 | 0.0075 |
| HSA-MIR-331 | 2.758e-05 | 0.0139 |
| HSA-MIR-574 | 3.083e-05 | 0.0155 |
Figure S3. Get High-res Image As an example, this figure shows the association of HSA-MIR-874 to 'LYMPH.NODE.METASTASIS'. P value = 1.53e-08 with ANOVA analysis.
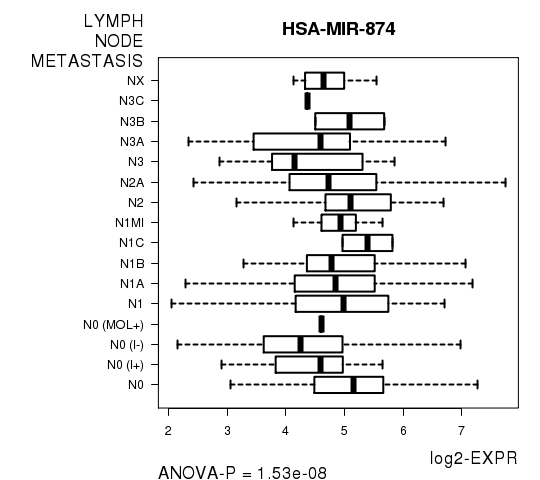
Table S10. Basic characteristics of clinical feature: 'NUMBER.OF.LYMPH.NODES'
| NUMBER.OF.LYMPH.NODES | Mean (SD) | 2.22 (4.4) |
| Significant markers | N = 0 |
Table S11. Basic characteristics of clinical feature: 'NEOPLASM.DISEASESTAGE'
| NEOPLASM.DISEASESTAGE | Labels | N |
| STAGE I | 72 | |
| STAGE IA | 63 | |
| STAGE IB | 8 | |
| STAGE II | 8 | |
| STAGE IIA | 290 | |
| STAGE IIB | 187 | |
| STAGE III | 2 | |
| STAGE IIIA | 120 | |
| STAGE IIIB | 24 | |
| STAGE IIIC | 40 | |
| STAGE IV | 14 | |
| STAGE TIS | 1 | |
| STAGE X | 17 | |
| Significant markers | N = 8 |
Table S12. Get Full Table List of 8 genes differentially expressed by 'NEOPLASM.DISEASESTAGE'
| ANOVA_P | Q | |
|---|---|---|
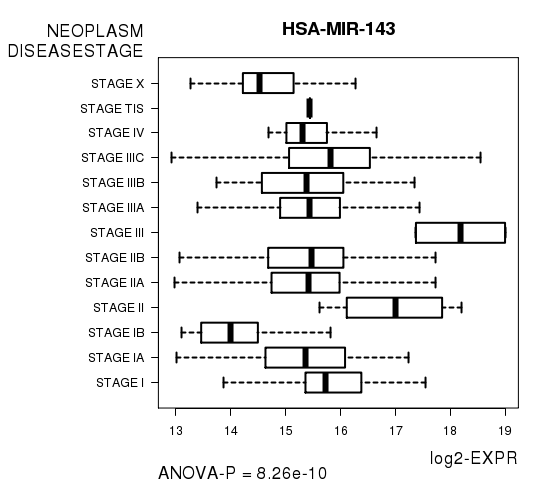
| HSA-MIR-143 | 8.256e-10 | 4.21e-07 |
| HSA-MIR-210 | 2.758e-08 | 1.4e-05 |
| HSA-LET-7F-2 | 2.063e-07 | 0.000105 |
| HSA-MIR-200A | 1.103e-06 | 0.000559 |
| HSA-MIR-338 | 1.048e-05 | 0.0053 |
| HSA-MIR-3607 | 1.872e-05 | 0.00945 |
| HSA-MIR-374C | 2.413e-05 | 0.0122 |
| HSA-MIR-3653 | 6.03e-05 | 0.0303 |
Figure S4. Get High-res Image As an example, this figure shows the association of HSA-MIR-143 to 'NEOPLASM.DISEASESTAGE'. P value = 8.26e-10 with ANOVA analysis.
-
Expresson data file = BRCA-TP.miRseq_RPKM_log2.txt
-
Clinical data file = BRCA-TP.clin.merged.picked.txt
-
Number of patients = 847
-
Number of genes = 510
-
Number of clinical features = 8
For survival clinical features, Wald's test in univariate Cox regression analysis with proportional hazards model (Andersen and Gill 1982) was used to estimate the P values using the 'coxph' function in R. Kaplan-Meier survival curves were plot using the four quartile subgroups of patients based on expression levels
For continuous numerical clinical features, Spearman's rank correlation coefficients (Spearman 1904) and two-tailed P values were estimated using 'cor.test' function in R
For two-class clinical features, two-tailed Student's t test with unequal variance (Lehmann and Romano 2005) was applied to compare the log2-expression levels between the two clinical classes using 't.test' function in R
For multi-class clinical features (ordinal or nominal), one-way analysis of variance (Howell 2002) was applied to compare the log2-expression levels between different clinical classes using 'anova' function in R
For multiple hypothesis correction, Q value is the False Discovery Rate (FDR) analogue of the P value (Benjamini and Hochberg 1995), defined as the minimum FDR at which the test may be called significant. We used the 'Benjamini and Hochberg' method of 'p.adjust' function in R to convert P values into Q values.
This is an experimental feature. The full results of the analysis summarized in this report can be downloaded from the TCGA Data Coordination Center.