This report serves to describe the mutational landscape and properties of a given individual set, as well as rank genes and genesets according to mutational significance. MutSig v2.0 was used to generate the results found in this report.
-
Working with individual set: BRCA-TP
-
Number of patients in set: 4
The input for this pipeline is a set of individuals with the following files associated for each:
-
An annotated .maf file describing the mutations called for the respective individual, and their properties.
-
A .wig file that contains information about the coverage of the sample.
-
MAF used for this analysis:BRCA-TP.final_analysis_set.maf
-
Significantly mutated genes (q ≤ 0.1): 2
-
Mutations seen in COSMIC: 8
-
Significantly mutated genes in COSMIC territory: 2
-
Genes with clustered mutations (≤ 3 aa apart): 1
-
Significantly mutated genesets: 106
-
Significantly mutated genesets: (excluding sig. mutated genes):1
-
Read 772 MAFs of type "WashU"
-
Total number of mutations in input MAFs: 47116
-
After removing 330 mutations outside chr1-24: 46786
-
After removing 559 blacklisted mutations: 46227
-
After removing 1703 noncoding mutations: 44524
-
After collapsing adjacent/redundant mutations: 44522
-
Number of mutations before filtering: 44522
-
After removing 44387 mutations outside patient set: 135
-
After removing 2 mutations outside gene set: 133
Table 1. Get Full Table Table representing breakdown of mutations by type.
| type | count |
|---|---|
| Frame_Shift_Del | 2 |
| Frame_Shift_Ins | 2 |
| In_Frame_Del | 1 |
| Missense_Mutation | 101 |
| Nonsense_Mutation | 5 |
| Silent | 17 |
| Splice_Site | 5 |
| Total | 133 |
Table 2. Get Full Table A breakdown of mutation rates per category discovered for this individual set.
| category | n | N | rate | rate_per_mb | relative_rate | exp_ns_s_ratio |
|---|---|---|---|---|---|---|
| *CpG->T | 28 | 6601072 | 4.2e-06 | 4.2 | 4.5 | 2.1 |
| *Cp(A/C/T)->T | 18 | 55704172 | 3.2e-07 | 0.32 | 0.34 | 1.7 |
| C->(G/A) | 32 | 62305244 | 5.1e-07 | 0.51 | 0.54 | 4.8 |
| A->mut | 23 | 60393368 | 3.8e-07 | 0.38 | 0.4 | 3.9 |
| indel+null | 15 | 122698612 | 1.2e-07 | 0.12 | 0.13 | NaN |
| double_null | 0 | 122698612 | 0 | 0 | 0 | NaN |
| Total | 116 | 122698612 | 9.5e-07 | 0.95 | 1 | 3.5 |
The x axis represents the samples. The y axis represents the exons, one row per exon, and they are sorted by average coverage across samples. For exons with exactly the same average coverage, they are sorted next by the %GC of the exon. (The secondary sort is especially useful for the zero-coverage exons at the bottom).
Figure 1.
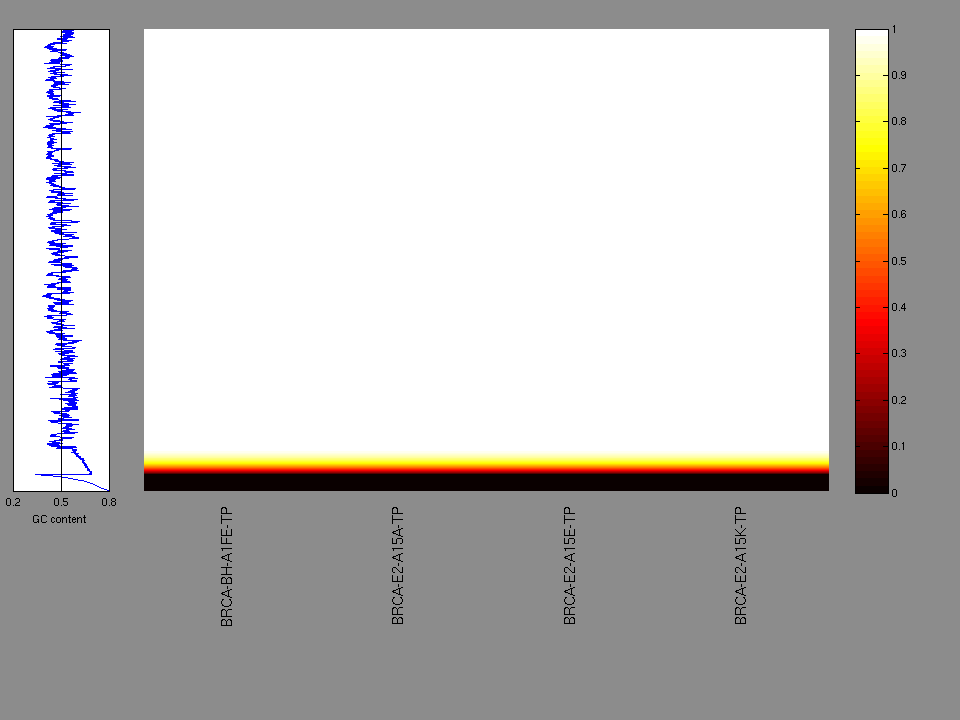
Figure 2. Patients counts and rates file used to generate this plot: BRCA-TP.patients.counts_and_rates.txt
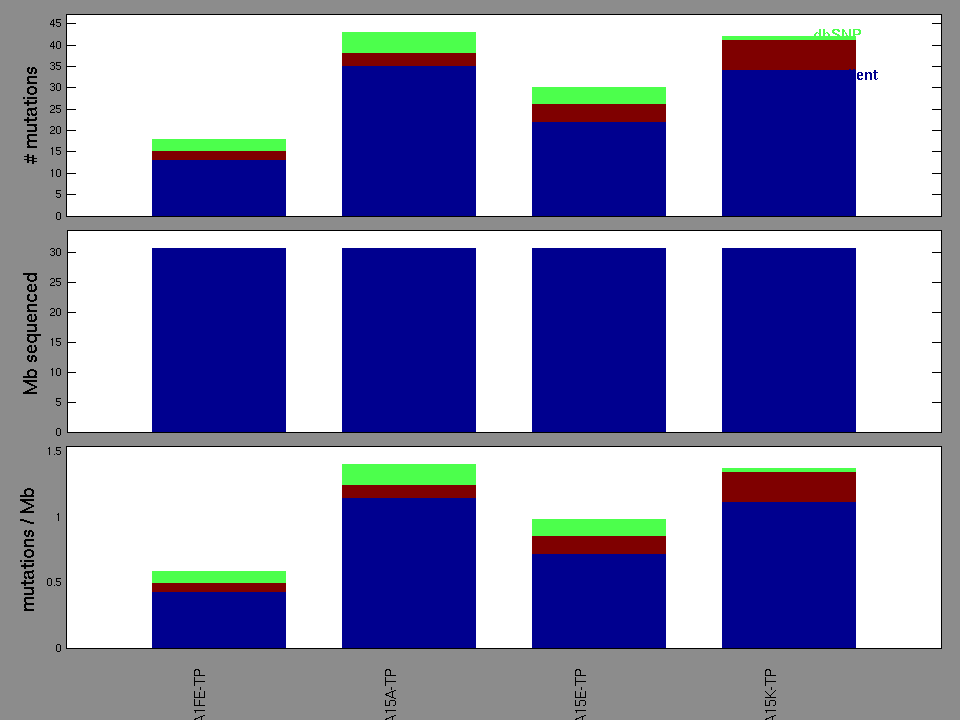
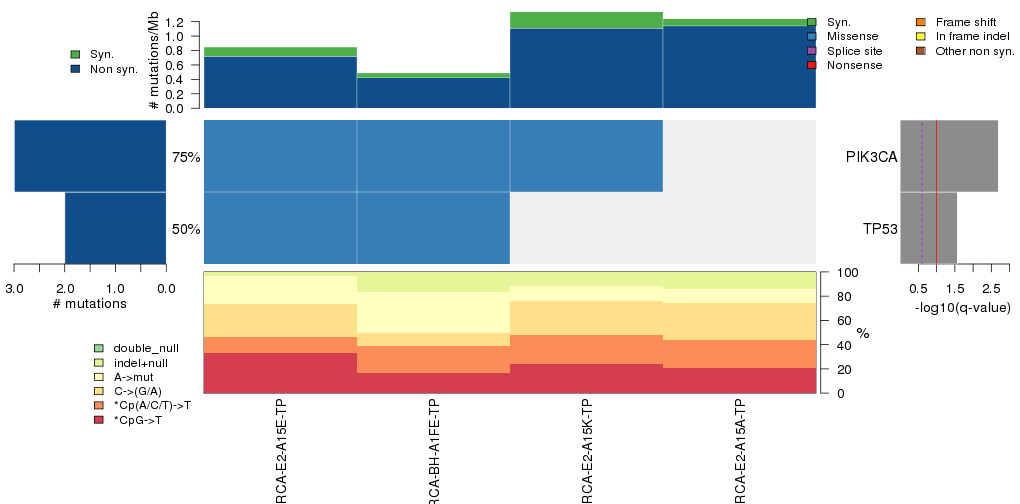
Figure 3. Get High-res Image The matrix in the center of the figure represents individual mutations in patient samples, color-coded by type of mutation, for the significantly mutated genes. The rate of synonymous and non-synonymous mutations is displayed at the top of the matrix. The barplot on the left of the matrix shows the number of mutations in each gene. The percentages represent the fraction of tumors with at least one mutation in the specified gene. The barplot to the right of the matrix displays the q-values for the most significantly mutated genes. The purple boxplots below the matrix (only displayed if required columns are present in the provided MAF) represent the distributions of allelic fractions observed in each sample. The plot at the bottom represents the base substitution distribution of individual samples, using the same categories that were used to calculate significance.
Column Descriptions:
-
N = number of sequenced bases in this gene across the individual set
-
n = number of (nonsilent) mutations in this gene across the individual set
-
npat = number of patients (individuals) with at least one nonsilent mutation
-
nsite = number of unique sites having a non-silent mutation
-
nsil = number of silent mutations in this gene across the individual set
-
n1 = number of nonsilent mutations of type: *CpG->T
-
n2 = number of nonsilent mutations of type: *Cp(A/C/T)->T
-
n3 = number of nonsilent mutations of type: C->(G/A)
-
n4 = number of nonsilent mutations of type: A->mut
-
n5 = number of nonsilent mutations of type: indel+null
-
n6 = number of nonsilent mutations of type: double_null
-
p_classic = p-value for the observed amount of nonsilent mutations being elevated in this gene
-
p_ns_s = p-value for the observed nonsilent/silent ratio being elevated in this gene
-
p_cons = p-value for enrichment of mutations at evolutionarily most-conserved sites in gene
-
p_joint = p-value for clustering + conservation
-
p = p-value (overall)
-
q = q-value, False Discovery Rate (Benjamini-Hochberg procedure)
Table 3. Get Full Table A Ranked List of Significantly Mutated Genes. Number of significant genes found: 2. Number of genes displayed: 35. Click on a gene name to display its stick figure depicting the distribution of mutations and mutation types across the chosen gene (this feature may not be available for all significant genes).
| rank | gene | description | N | n | npat | nsite | nsil | n1 | n2 | n3 | n4 | n5 | n6 | p_classic | p_ns_s | p_cons | p_joint | p | q |
|---|---|---|---|---|---|---|---|---|---|---|---|---|---|---|---|---|---|---|---|
| 1 | PIK3CA | phosphoinositide-3-kinase, catalytic, alpha polypeptide | 13148 | 3 | 3 | 2 | 0 | 0 | 0 | 0 | 3 | 0 | 0 | 5.4e-08 | 0.45 | NaN | NaN | 5.4e-08 | 0.00098 |
| 2 | TP53 | tumor protein p53 | 5124 | 2 | 2 | 2 | 0 | 0 | 0 | 0 | 2 | 0 | 0 | 2.8e-06 | 0.63 | NaN | NaN | 2.8e-06 | 0.025 |
| 3 | DGKG | diacylglycerol kinase, gamma 90kDa | 9860 | 1 | 1 | 1 | 0 | 0 | 0 | 0 | 0 | 1 | 0 | 0.00011 | 0.84 | NaN | NaN | 0.00011 | 0.68 |
| 4 | ETS1 | v-ets erythroblastosis virus E26 oncogene homolog 1 (avian) | 6320 | 1 | 1 | 1 | 0 | 0 | 1 | 0 | 0 | 0 | 0 | 0.00027 | 0.62 | NaN | NaN | 0.00027 | 1 |
| 5 | TNK2 | tyrosine kinase, non-receptor, 2 | 8412 | 1 | 1 | 1 | 0 | 0 | 1 | 0 | 0 | 0 | 0 | 0.00042 | 0.55 | NaN | NaN | 0.00042 | 1 |
| 6 | LIPF | lipase, gastric | 4932 | 1 | 1 | 1 | 0 | 0 | 0 | 0 | 0 | 1 | 0 | 0.00058 | 0.88 | NaN | NaN | 0.00058 | 1 |
| 7 | SPHKAP | SPHK1 interactor, AKAP domain containing | 20600 | 1 | 1 | 1 | 0 | 0 | 0 | 1 | 0 | 0 | 0 | 0.0006 | 0.84 | NaN | NaN | 0.0006 | 1 |
| 8 | TSEN15 | tRNA splicing endonuclease 15 homolog (S. cerevisiae) | 1652 | 1 | 1 | 1 | 0 | 0 | 0 | 1 | 0 | 0 | 0 | 0.00069 | 0.87 | NaN | NaN | 0.00069 | 1 |
| 9 | ZNF626 | zinc finger protein 626 | 6244 | 1 | 1 | 1 | 0 | 0 | 0 | 0 | 0 | 1 | 0 | 0.00069 | 1 | NaN | NaN | 0.00069 | 1 |
| 10 | BCAT1 | branched chain aminotransferase 1, cytosolic | 4848 | 1 | 1 | 1 | 0 | 1 | 0 | 0 | 0 | 0 | 0 | 0.00089 | 0.7 | NaN | NaN | 0.00089 | 1 |
| 11 | ZNF829 | zinc finger protein 829 | 5612 | 1 | 1 | 1 | 0 | 0 | 0 | 0 | 0 | 1 | 0 | 0.00095 | 1 | NaN | NaN | 0.00095 | 1 |
| 12 | MUC1 | mucin 1, cell surface associated | 3524 | 1 | 1 | 1 | 0 | 0 | 0 | 0 | 1 | 0 | 0 | 0.00097 | 0.83 | NaN | NaN | 0.00097 | 1 |
| 13 | ERBB2 | v-erb-b2 erythroblastic leukemia viral oncogene homolog 2, neuro/glioblastoma derived oncogene homolog (avian) | 15008 | 1 | 1 | 1 | 0 | 0 | 0 | 1 | 0 | 0 | 0 | 0.0011 | 0.78 | NaN | NaN | 0.0011 | 1 |
| 14 | CRTAP | cartilage associated protein | 3036 | 1 | 1 | 1 | 0 | 0 | 1 | 0 | 0 | 0 | 0 | 0.0011 | 0.59 | NaN | NaN | 0.0011 | 1 |
| 15 | BCL2L11 | BCL2-like 11 (apoptosis facilitator) | 2952 | 1 | 1 | 1 | 0 | 0 | 1 | 0 | 0 | 0 | 0 | 0.0011 | 0.68 | NaN | NaN | 0.0011 | 1 |
| 16 | CSMD3 | CUB and Sushi multiple domains 3 | 45880 | 1 | 1 | 1 | 0 | 1 | 0 | 0 | 0 | 0 | 0 | 0.0013 | 0.73 | NaN | NaN | 0.0013 | 1 |
| 17 | PDHB | pyruvate dehydrogenase (lipoamide) beta | 4480 | 1 | 1 | 1 | 0 | 0 | 0 | 0 | 1 | 0 | 0 | 0.0013 | 0.75 | NaN | NaN | 0.0013 | 1 |
| 18 | SRGN | serglycin | 1956 | 1 | 1 | 1 | 0 | 1 | 0 | 0 | 0 | 0 | 0 | 0.0014 | 0.71 | NaN | NaN | 0.0014 | 1 |
| 19 | NR1H2 | nuclear receptor subfamily 1, group H, member 2 | 4976 | 1 | 1 | 1 | 0 | 0 | 0 | 0 | 1 | 0 | 0 | 0.0014 | 0.84 | NaN | NaN | 0.0014 | 1 |
| 20 | OR8D1 | olfactory receptor, family 8, subfamily D, member 1 | 3720 | 1 | 1 | 1 | 0 | 0 | 1 | 0 | 0 | 0 | 0 | 0.0014 | 0.55 | NaN | NaN | 0.0014 | 1 |
| 21 | LHFPL4 | lipoma HMGIC fusion partner-like 4 | 3024 | 1 | 1 | 1 | 0 | 0 | 0 | 1 | 0 | 0 | 0 | 0.0015 | 0.73 | NaN | NaN | 0.0015 | 1 |
| 22 | ZNF675 | zinc finger protein 675 | 6892 | 1 | 1 | 1 | 0 | 0 | 0 | 0 | 0 | 1 | 0 | 0.0016 | 0.8 | NaN | NaN | 0.0016 | 1 |
| 23 | PIWIL2 | piwi-like 2 (Drosophila) | 12040 | 1 | 1 | 1 | 0 | 0 | 0 | 0 | 0 | 1 | 0 | 0.0017 | 1 | NaN | NaN | 0.0017 | 1 |
| 24 | NPAS4 | neuronal PAS domain protein 4 | 9508 | 1 | 1 | 1 | 0 | 0 | 0 | 0 | 1 | 0 | 0 | 0.0017 | 0.78 | NaN | NaN | 0.0017 | 1 |
| 25 | TTC9C | tetratricopeptide repeat domain 9C | 2112 | 1 | 1 | 1 | 0 | 1 | 0 | 0 | 0 | 0 | 0 | 0.0018 | 0.77 | NaN | NaN | 0.0018 | 1 |
| 26 | FBXL17 | F-box and leucine-rich repeat protein 17 | 4580 | 1 | 1 | 1 | 0 | 0 | 0 | 0 | 0 | 1 | 0 | 0.002 | 0.68 | NaN | NaN | 0.002 | 1 |
| 27 | SCAI | suppressor of cancer cell invasion | 7636 | 1 | 1 | 1 | 0 | 1 | 0 | 0 | 0 | 0 | 0 | 0.002 | 0.82 | NaN | NaN | 0.002 | 1 |
| 28 | PIK3R3 | phosphoinositide-3-kinase, regulatory subunit 3 (gamma) | 5704 | 1 | 1 | 1 | 0 | 0 | 0 | 0 | 1 | 0 | 0 | 0.0021 | 0.8 | NaN | NaN | 0.0021 | 1 |
| 29 | ATL3 | atlastin GTPase 3 | 6712 | 1 | 1 | 1 | 0 | 0 | 0 | 0 | 1 | 0 | 0 | 0.0021 | 0.78 | NaN | NaN | 0.0021 | 1 |
| 30 | SSX3 | synovial sarcoma, X breakpoint 3 | 2568 | 1 | 1 | 1 | 0 | 0 | 0 | 1 | 0 | 0 | 0 | 0.0021 | 0.86 | NaN | NaN | 0.0021 | 1 |
| 31 | FGFR2 | fibroblast growth factor receptor 2 (bacteria-expressed kinase, keratinocyte growth factor receptor, craniofacial dysostosis 1, Crouzon syndrome, Pfeiffer syndrome, Jackson-Weiss syndrome) | 11160 | 1 | 1 | 1 | 0 | 0 | 0 | 0 | 1 | 0 | 0 | 0.0021 | 0.81 | NaN | NaN | 0.0021 | 1 |
| 32 | DSP | desmoplakin | 34308 | 1 | 1 | 1 | 0 | 0 | 1 | 0 | 0 | 0 | 0 | 0.0022 | 0.57 | NaN | NaN | 0.0022 | 1 |
| 33 | CRIPAK | cysteine-rich PAK1 inhibitor | 5300 | 1 | 1 | 1 | 0 | 1 | 0 | 0 | 0 | 0 | 0 | 0.0023 | 0.66 | NaN | NaN | 0.0023 | 1 |
| 34 | CHI3L1 | chitinase 3-like 1 (cartilage glycoprotein-39) | 4768 | 1 | 1 | 1 | 0 | 0 | 0 | 1 | 0 | 0 | 0 | 0.0023 | 0.8 | NaN | NaN | 0.0023 | 1 |
| 35 | SLC16A1 | solute carrier family 16, member 1 (monocarboxylic acid transporter 1) | 6076 | 1 | 1 | 1 | 0 | 0 | 1 | 0 | 0 | 0 | 0 | 0.0024 | 0.69 | NaN | NaN | 0.0024 | 1 |
In this analysis, COSMIC is used as a filter to increase power by restricting the territory of each gene. Cosmic version: v48.
Table 4. Get Full Table Significantly mutated genes (COSMIC territory only). To access the database please go to: COSMIC. Number of significant genes found: 2. Number of genes displayed: 10
| rank | gene | description | n | cos | n_cos | N_cos | cos_ev | p | q |
|---|---|---|---|---|---|---|---|---|---|
| 1 | PIK3CA | phosphoinositide-3-kinase, catalytic, alpha polypeptide | 3 | 220 | 3 | 880 | 1967 | 9.6e-11 | 4.3e-07 |
| 2 | TP53 | tumor protein p53 | 2 | 356 | 2 | 1424 | 574 | 9e-07 | 0.002 |
| 3 | CSMD3 | CUB and Sushi multiple domains 3 | 1 | 22 | 1 | 88 | 1 | 0.000083 | 0.13 |
| 4 | ERBB2 | v-erb-b2 erythroblastic leukemia viral oncogene homolog 2, neuro/glioblastoma derived oncogene homolog (avian) | 1 | 42 | 1 | 168 | 3 | 0.00016 | 0.17 |
| 5 | FGFR2 | fibroblast growth factor receptor 2 (bacteria-expressed kinase, keratinocyte growth factor receptor, craniofacial dysostosis 1, Crouzon syndrome, Pfeiffer syndrome, Jackson-Weiss syndrome) | 1 | 51 | 1 | 204 | 5 | 0.00019 | 0.17 |
| 6 | A4GNT | alpha-1,4-N-acetylglucosaminyltransferase | 0 | 0 | 0 | 0 | 0 | 1 | 1 |
| 7 | AACS | acetoacetyl-CoA synthetase | 0 | 0 | 0 | 0 | 0 | 1 | 1 |
| 8 | ABCA9 | ATP-binding cassette, sub-family A (ABC1), member 9 | 0 | 0 | 0 | 0 | 0 | 1 | 1 |
| 9 | ABCC10 | ATP-binding cassette, sub-family C (CFTR/MRP), member 10 | 0 | 0 | 0 | 0 | 0 | 1 | 1 |
| 10 | ABCF2 | ATP-binding cassette, sub-family F (GCN20), member 2 | 0 | 0 | 0 | 0 | 0 | 1 | 1 |
Note:
n - number of (nonsilent) mutations in this gene across the individual set.
cos = number of unique mutated sites in this gene in COSMIC
n_cos = overlap between n and cos.
N_cos = number of individuals times cos.
cos_ev = total evidence: number of reports in COSMIC for mutations seen in this gene.
p = p-value for seeing the observed amount of overlap in this gene)
q = q-value, False Discovery Rate (Benjamini-Hochberg procedure)
Table 5. Get Full Table Genes with Clustered Mutations
| num | gene | desc | n | mindist | nmuts0 | nmuts3 | nmuts12 | npairs0 | npairs3 | npairs12 |
|---|---|---|---|---|---|---|---|---|---|---|
| 71 | PIK3CA | phosphoinositide-3-kinase, catalytic, alpha polypeptide | 3 | 0 | 1 | 1 | 1 | 1 | 1 | 1 |
| 92 | TEX15 | testis expressed 15 | 3 | 22 | 0 | 0 | 0 | 0 | 0 | 0 |
| 95 | TP53 | tumor protein p53 | 2 | 54 | 0 | 0 | 0 | 0 | 0 | 0 |
Note:
n - number of mutations in this gene in the individual set.
mindist - distance (in aa) between closest pair of mutations in this gene
npairs3 - how many pairs of mutations are within 3 aa of each other.
npairs12 - how many pairs of mutations are within 12 aa of each other.
Table 6. Get Full Table A Ranked List of Significantly Mutated Genesets. (Source: MSigDB GSEA Cannonical Pathway Set).Number of significant genesets found: 106. Number of genesets displayed: 10
| rank | geneset | description | genes | N_genes | mut_tally | N | n | npat | nsite | nsil | n1 | n2 | n3 | n4 | n5 | n6 | p_ns_s | p | q |
|---|---|---|---|---|---|---|---|---|---|---|---|---|---|---|---|---|---|---|---|
| 1 | PAR1PATHWAY | Activated extracellular thrombin cleaves and activates the G-protein coupled receptors PAR1 and PAR4, which activate platelets. | ADCY1, ARHA, ARHGEF1, F2, F2R, F2RL3, GNA12, GNA13, GNAI1, GNAQ, GNB1, GNGT1, MAP3K7, PIK3CA, PIK3R1, PLCB1, PPP1R12B, PRKCA, PRKCB1, PTK2B, ROCK1 | 19 | F2(1), PIK3CA(3) | 153848 | 4 | 4 | 3 | 0 | 0 | 0 | 1 | 3 | 0 | 0 | 0.44 | 1.1e-06 | 0.00066 |
| 2 | LONGEVITYPATHWAY | Caloric restriction in animals often increases lifespan, which may occur via decreased IGF receptor expression and consequent expression of stress-resistance proteins. | AKT1, CAT, FOXO3A, GH1, GHR, HRAS, IGF1, IGF1R, PIK3CA, PIK3R1, SHC1, SOD1, SOD2, SOD3 | 12 | PIK3CA(3) | 78608 | 3 | 3 | 2 | 0 | 0 | 0 | 0 | 3 | 0 | 0 | 0.52 | 8.9e-06 | 0.0009 |
| 3 | CTLA4PATHWAY | T cell activation requires interaction with an antigen-MHC-I complex on an antigen-presenting cell (APC), as well as CD28 interaction with the APC's CD80 or 86. | CD28, CD3D, CD3E, CD3G, CD3Z, CD80, CD86, CTLA4, GRB2, HLA-DRA, HLA-DRB1, ICOS, ICOSL, IL2, ITK, LCK, PIK3CA, PIK3R1, PTPN11, TRA@, TRB@ | 16 | PIK3CA(3) | 72992 | 3 | 3 | 2 | 0 | 0 | 0 | 0 | 3 | 0 | 0 | 0.5 | 9.1e-06 | 0.0009 |
| 4 | PLCPATHWAY | Phospholipase C hydrolyzes the membrane lipid PIP2 to DAG, which activates protein kinase C, and IP3, which causes calcium influx. | AKT1, PIK3CA, PIK3R1, PLCB1, PLCG1, PRKCA, PRKCB1, VAV1 | 7 | PIK3CA(3) | 78008 | 3 | 3 | 2 | 0 | 0 | 0 | 0 | 3 | 0 | 0 | 0.54 | 9.7e-06 | 0.0009 |
| 5 | CDC42RACPATHWAY | PI3 kinase stimulates cell migration by activating cdc42, which activates ARP2/3, which in turn promotes formation of new actin fibers. | ACTR2, ACTR3, ARHA, ARPC1A, ARPC1B, ARPC2, ARPC3, ARPC4, CDC42, PAK1, PDGFRA, PIK3CA, PIK3R1, RAC1, WASL | 14 | PIK3CA(3) | 81180 | 3 | 3 | 2 | 0 | 0 | 0 | 0 | 3 | 0 | 0 | 0.48 | 0.000012 | 0.0009 |
| 6 | AKTPATHWAY | Second messenger PIP3 promotes cell survival by activating the anti-apoptotic kinase AKT. | AKT1, BAD, CASP9, CHUK, FOXO1A, FOXO3A, GH1, GHR, HSPCA, MLLT7, NFKB1, NFKBIA, PDPK1, PIK3CA, PIK3R1, PPP2CA, RELA, TNFSF6, YWHAH | 14 | PIK3CA(3) | 85460 | 3 | 3 | 2 | 0 | 0 | 0 | 0 | 3 | 0 | 0 | 0.49 | 0.000013 | 0.0009 |
| 7 | SA_TRKA_RECEPTOR | The TrkA receptor binds nerve growth factor to activate MAP kinase pathways and promote cell growth. | AKT1, AKT2, AKT3, ARHA, CDKN1A, ELK1, GRB2, HRAS, MAP2K1, MAP2K2, NGFB, NGFR, NTRK1, PIK3CA, PIK3CD, SHC1, SOS1 | 15 | PIK3CA(3) | 98576 | 3 | 3 | 2 | 0 | 0 | 0 | 0 | 3 | 0 | 0 | 0.54 | 0.000014 | 0.0009 |
| 8 | ACHPATHWAY | Nicotinic acetylcholine receptors are ligand-gated ion channels that primarily mediate neuromuscular signaling and may inhibit neuronal apoptosis via the AKT pathway. | AKT1, BAD, CHRNB1, CHRNG, FOXO3A, MUSK, PIK3CA, PIK3R1, PTK2, PTK2B, RAPSN, SRC, TERT, TNFSF6, YWHAH | 13 | PIK3CA(3) | 101872 | 3 | 3 | 2 | 0 | 0 | 0 | 0 | 3 | 0 | 0 | 0.56 | 0.000015 | 0.0009 |
| 9 | NFATPATHWAY | Cardiac hypertrophy is induced by NF-ATc4 and GATA4, which are stimulated through calcineurin activated by CaMK. | ACTA1, AGT, AKT1, CALM1, CALM2, CALM3, CALR, CAMK1, CAMK1G, CAMK4, CREBBP, CSNK1A1, CTF1, DTR, EDN1, ELSPBP1, F2, FGF2, FKBP1A, GATA4, GSK3B, HAND1, HAND2, HRAS, IGF1, LIF, MAP2K1, MAPK1, MAPK14, MAPK3, MAPK8, MEF2C, MYH2, NFATC1, NFATC2, NFATC3, NFATC4, NKX2-5, NPPA, PIK3CA, PIK3R1, PPP3CA, PPP3CB, PPP3CC, PRKACB, PRKACG, PRKAR1A, PRKAR1B, PRKAR2A, PRKAR2B, RAF1, RPS6KB1, SYT1 | 52 | F2(1), NFATC4(1), PIK3CA(3) | 300744 | 5 | 4 | 4 | 0 | 0 | 0 | 1 | 3 | 1 | 0 | 0.43 | 0.000016 | 0.0009 |
| 10 | TRKAPATHWAY | Nerve growth factor (NGF) promotes neuronal survival and proliferation by binding its receptor TrkA, which activates PI3K/AKT, Ras, and the MAP kinase pathway. | AKT1, DPM2, GRB2, HRAS, KLK2, NGFB, NTRK1, PIK3CA, PIK3R1, PLCG1, PRKCA, PRKCB1, SHC1, SOS1 | 12 | PIK3CA(3) | 93892 | 3 | 3 | 2 | 0 | 0 | 0 | 0 | 3 | 0 | 0 | 0.52 | 0.000016 | 0.0009 |
Table 7. Get Full Table A Ranked List of Significantly Mutated Genesets (Excluding Significantly Mutated Genes). Number of significant genesets found: 1. Number of genesets displayed: 10
| rank | geneset | description | genes | N_genes | mut_tally | N | n | npat | nsite | nsil | n1 | n2 | n3 | n4 | n5 | n6 | p_ns_s | p | q |
|---|---|---|---|---|---|---|---|---|---|---|---|---|---|---|---|---|---|---|---|
| 1 | HSA04320_DORSO_VENTRAL_AXIS_FORMATION | Genes involved in dorso-ventral axis formation | BRAF, CPEB1, EGFR, ERBB2, ERBB4, ETS1, ETS2, ETV6, ETV7, FMN2, GRB2, KRAS, MAP2K1, MAPK1, MAPK3, NOTCH1, NOTCH2, NOTCH3, NOTCH4, PIWIL1, PIWIL2, PIWIL3, PIWIL4, RAF1, SOS1, SOS2, SPIRE1, SPIRE2 | 27 | ERBB2(1), ETS1(1), PIWIL2(1) | 293236 | 3 | 3 | 3 | 1 | 0 | 1 | 1 | 0 | 1 | 0 | 0.79 | 0.000024 | 0.015 |
| 2 | VALINE_LEUCINE_AND_ISOLEUCINE_BIOSYNTHESIS | BCAT1, IARS, LARS, LARS2, PDHA1, PDHA2, PDHB | 7 | BCAT1(1), PDHB(1) | 60328 | 2 | 2 | 2 | 0 | 1 | 0 | 0 | 1 | 0 | 0 | 0.55 | 0.00034 | 0.1 | |
| 3 | GLYCEROLIPID_METABOLISM | ADH1A, ADH1A, ADH1B, ADH1C, ADH1B, ADH1C, ADH4, ADH6, ADH7, ADHFE1, AGPAT1, AGPAT2, AGPAT3, AGPAT4, AKR1A1, AKR1B1, ALDH1A1, ALDH1A2, ALDH1A3, ALDH1B1, ALDH2, ALDH3A1, ALDH3A2, ALDH9A1, CEL, DGAT1, DGKA, DGKB, DGKD, DGKE, DGKG, DGKH, DGKQ, DGKZ, GK, GLA, GLB1, LCT, LIPC, LIPF, LIPG, LPL, PNLIP, PNLIPRP1, PNLIPRP2, PPAP2A, PPAP2B, PPAP2C | 44 | DGKG(1), LIPF(1) | 292672 | 2 | 2 | 2 | 0 | 0 | 0 | 0 | 0 | 2 | 0 | 0.66 | 0.0011 | 0.17 | |
| 4 | HSA00290_VALINE_LEUCINE_AND_ISOLEUCINE_BIOSYNTHESIS | Genes involved in valine, leucine and isoleucine biosynthesis | BCAT1, BCAT2, IARS, IARS2, ILVBL, LARS, LARS2, PDHA1, PDHA2, PDHB, VARS, VARS2 | 12 | BCAT1(1), PDHB(1) | 93956 | 2 | 2 | 2 | 0 | 1 | 0 | 0 | 1 | 0 | 0 | 0.55 | 0.0011 | 0.17 |
| 5 | HSA00561_GLYCEROLIPID_METABOLISM | Genes involved in glycerolipid metabolism | ADH1A, ADH1B, ADH1C, ADH4, ADH5, ADH6, ADH7, ADHFE1, AGK, AGPAT1, AGPAT2, AGPAT3, AGPAT4, AGPAT6, AKR1A1, AKR1B1, ALDH1A3, ALDH1B1, ALDH2, ALDH3A1, ALDH3A2, ALDH7A1, ALDH9A1, CEL, DAK, DGAT1, DGAT2, DGKA, DGKB, DGKD, DGKE, DGKG, DGKH, DGKI, DGKQ, DGKZ, GK, GK2, GLA, GLB1, GPAM, LCT, LIPA, LIPC, LIPF, LIPG, LPL, LYCAT, MGLL, PNLIP, PNLIPRP1, PNLIPRP2, PNPLA3, PPAP2A, PPAP2B, PPAP2C, UGCGL1, UGCGL2 | 54 | DGKG(1), LIPF(1) | 356400 | 2 | 2 | 2 | 0 | 0 | 0 | 0 | 0 | 2 | 0 | 0.66 | 0.0019 | 0.23 |
| 6 | HSA04012_ERBB_SIGNALING_PATHWAY | Genes involved in ErbB signaling pathway | ABL1, ABL2, AKT1, AKT2, AKT3, ARAF, AREG, BAD, BRAF, BTC, CAMK2A, CAMK2B, CAMK2D, CAMK2G, CBL, CBLB, CBLC, CDKN1A, CDKN1B, CRK, CRKL, EGF, EGFR, EIF4EBP1, ELK1, ERBB2, ERBB3, ERBB4, EREG, FRAP1, GAB1, GRB2, GSK3B, HBEGF, HRAS, JUN, KRAS, MAP2K1, MAP2K2, MAP2K4, MAP2K7, MAPK1, MAPK10, MAPK3, MAPK8, MAPK9, MYC, NCK1, NCK2, NRAS, NRG1, NRG2, NRG3, NRG4, PAK1, PAK2, PAK3, PAK4, PAK6, PAK7, PIK3CA, PIK3CB, PIK3CD, PIK3CG, PIK3R1, PIK3R2, PIK3R3, PIK3R5, PLCG1, PLCG2, PRKCA, PRKCB1, PRKCG, PTK2, RAF1, RPS6KB1, RPS6KB2, SHC1, SHC2, SHC3, SHC4, SOS1, SOS2, SRC, STAT5A, STAT5B, TGFA | 84 | ERBB2(1), PIK3R3(1) | 601936 | 2 | 2 | 2 | 0 | 0 | 0 | 1 | 1 | 0 | 0 | 0.66 | 0.011 | 1 |
| 7 | ETSPATHWAY | The Ets transcription factors are activated by Ras and promote macrophage differentiation. | CSF1, CSF1R, DDX20, E2F1, E2F4, ETS1, ETS2, ETV3, FOS, HDAC2, HDAC5, HRAS, JUN, NCOR2, RBL1, RBL2, SIN3A, SIN3B | 18 | ETS1(1) | 166252 | 1 | 1 | 1 | 0 | 0 | 1 | 0 | 0 | 0 | 0 | 0.6 | 0.013 | 1 |
| 8 | HSA04070_PHOSPHATIDYLINOSITOL_SIGNALING_SYSTEM | Genes involved in phosphatidylinositol signaling system | CALM1, CALM2, CALM3, CALML3, CALML6, CARKL, CDIPT, CDS1, CDS2, DGKA, DGKB, DGKD, DGKE, DGKG, DGKH, DGKI, DGKQ, DGKZ, FN3K, IMPA1, IMPA2, INPP1, INPP4A, INPP4B, INPP5A, INPP5B, INPP5D, INPP5E, INPPL1, ITGB1BP3, ITPK1, ITPKA, ITPKB, ITPR1, ITPR2, ITPR3, OCRL, PI4KA, PI4KB, PIB5PA, PIK3C2A, PIK3C2B, PIK3C2G, PIK3C3, PIK3CA, PIK3CB, PIK3CD, PIK3CG, PIK3R1, PIK3R2, PIK3R3, PIK3R5, PIP4K2A, PIP4K2B, PIP4K2C, PIP5K1A, PIP5K1B, PIP5K1C, PIP5K3, PLCB1, PLCB2, PLCB3, PLCB4, PLCD1, PLCD3, PLCD4, PLCE1, PLCG1, PLCG2, PLCZ1, PRKCA, PRKCB1, PRKCG, PTEN, PTPMT1, SKIP, SYNJ1, SYNJ2 | 72 | DGKG(1), PIK3R3(1) | 754748 | 2 | 2 | 2 | 0 | 0 | 0 | 0 | 1 | 1 | 0 | 0.67 | 0.016 | 1 |
| 9 | NFATPATHWAY | Cardiac hypertrophy is induced by NF-ATc4 and GATA4, which are stimulated through calcineurin activated by CaMK. | ACTA1, AGT, AKT1, CALM1, CALM2, CALM3, CALR, CAMK1, CAMK1G, CAMK4, CREBBP, CSNK1A1, CTF1, DTR, EDN1, ELSPBP1, F2, FGF2, FKBP1A, GATA4, GSK3B, HAND1, HAND2, HRAS, IGF1, LIF, MAP2K1, MAPK1, MAPK14, MAPK3, MAPK8, MEF2C, MYH2, NFATC1, NFATC2, NFATC3, NFATC4, NKX2-5, NPPA, PIK3CA, PIK3R1, PPP3CA, PPP3CB, PPP3CC, PRKACB, PRKACG, PRKAR1A, PRKAR1B, PRKAR2A, PRKAR2B, RAF1, RPS6KB1, SYT1 | 51 | F2(1), NFATC4(1) | 287596 | 2 | 2 | 2 | 0 | 0 | 0 | 1 | 0 | 1 | 0 | 0.83 | 0.017 | 1 |
| 10 | CHEMICALPATHWAY | DNA damage promotes Bid cleavage, which stimulates mitochondrial cytochrome c release and consequent caspase activation, resulting in apoptosis. | ADPRT, AKT1, APAF1, ATM, BAD, BAX, BCL2, BCL2L1, BID, CASP3, CASP6, CASP7, CASP9, CYCS, EIF2S1, PRKCA, PRKCB1, PTK2, PXN, STAT1, TLN1, TP53 | 19 | TLN1(1) | 162092 | 1 | 1 | 1 | 0 | 1 | 0 | 0 | 0 | 0 | 0 | 0.7 | 0.018 | 1 |
In brief, we tabulate the number of mutations and the number of covered bases for each gene. The counts are broken down by mutation context category: four context categories that are discovered by MutSig, and one for indel and 'null' mutations, which include indels, nonsense mutations, splice-site mutations, and non-stop (read-through) mutations. For each gene, we calculate the probability of seeing the observed constellation of mutations, i.e. the product P1 x P2 x ... x Pm, or a more extreme one, given the background mutation rates calculated across the dataset. [1]
This is an experimental feature. The full results of the analysis summarized in this report can be downloaded from the TCGA Data Coordination Center.