This pipeline computes the correlation between significant arm-level copy number variations (cnvs) and subtypes.
Testing the association between copy number variation 73 arm-level results and 6 molecular subtypes across 114 patients, 3 significant findings detected with Q value < 0.25.
-
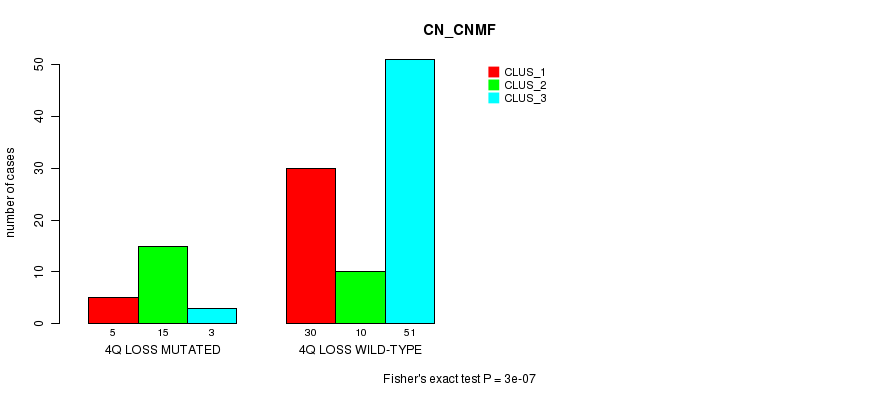
4q loss cnv correlated to 'CN_CNMF'.
-
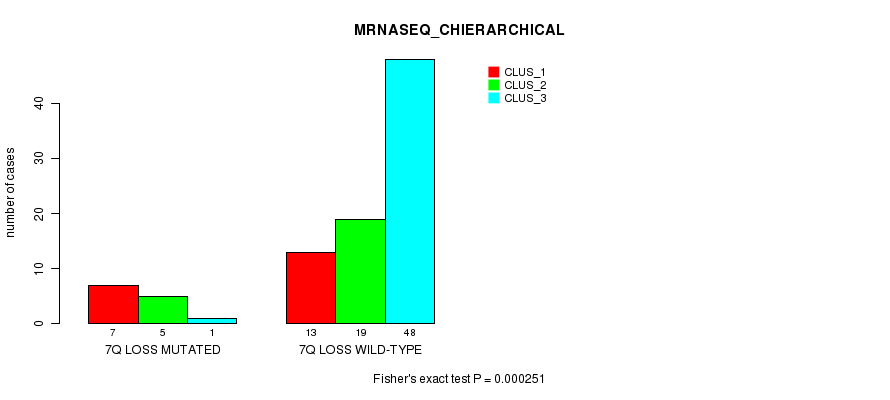
7q loss cnv correlated to 'MRNASEQ_CHIERARCHICAL'.
-
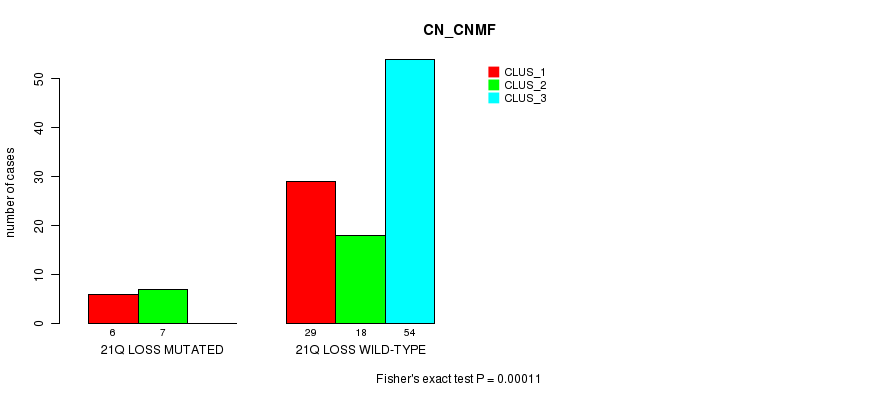
21q loss cnv correlated to 'CN_CNMF'.
Table 1. Get Full Table Overview of the association between significant copy number variation of 73 arm-level results and 6 molecular subtypes. Shown in the table are P values (Q values). Thresholded by Q value < 0.25, 3 significant findings detected.
|
Molecular subtypes |
CN CNMF |
METHLYATION CNMF |
MRNASEQ CNMF |
MRNASEQ CHIERARCHICAL |
MIRSEQ CNMF |
MIRSEQ CHIERARCHICAL |
||
| nCNV (%) | nWild-Type | Fisher's exact test | Chi-square test | Fisher's exact test | Fisher's exact test | Fisher's exact test | Fisher's exact test | |
| 4q loss | 23 (20%) | 91 |
3e-07 (0.00013) |
0.239 (1.00) |
0.0661 (1.00) |
0.164 (1.00) |
0.474 (1.00) |
0.501 (1.00) |
| 7q loss | 13 (11%) | 101 |
0.324 (1.00) |
0.175 (1.00) |
0.00803 (1.00) |
0.000251 (0.108) |
0.0136 (1.00) |
0.0909 (1.00) |
| 21q loss | 13 (11%) | 101 |
0.00011 (0.0477) |
0.0152 (1.00) |
0.731 (1.00) |
0.598 (1.00) |
1 (1.00) |
0.868 (1.00) |
| 1p gain | 30 (26%) | 84 |
0.925 (1.00) |
0.51 (1.00) |
0.335 (1.00) |
0.104 (1.00) |
0.668 (1.00) |
0.655 (1.00) |
| 1q gain | 41 (36%) | 73 |
0.182 (1.00) |
0.771 (1.00) |
0.403 (1.00) |
0.117 (1.00) |
0.185 (1.00) |
0.634 (1.00) |
| 2p gain | 16 (14%) | 98 |
0.108 (1.00) |
0.0917 (1.00) |
0.0371 (1.00) |
0.23 (1.00) |
0.0943 (1.00) |
0.0418 (1.00) |
| 2q gain | 4 (4%) | 110 |
0.0917 (1.00) |
0.374 (1.00) |
0.16 (1.00) |
0.418 (1.00) |
1 (1.00) |
1 (1.00) |
| 3p gain | 20 (18%) | 94 |
0.312 (1.00) |
0.0889 (1.00) |
0.378 (1.00) |
0.378 (1.00) |
0.748 (1.00) |
0.667 (1.00) |
| 3q gain | 57 (50%) | 57 |
0.00857 (1.00) |
0.0156 (1.00) |
0.00217 (0.923) |
0.000921 (0.397) |
0.633 (1.00) |
0.0309 (1.00) |
| 4q gain | 3 (3%) | 111 |
0.313 (1.00) |
0.32 (1.00) |
0.458 (1.00) |
0.278 (1.00) |
0.203 (1.00) |
0.343 (1.00) |
| 5p gain | 37 (32%) | 77 |
0.00806 (1.00) |
0.934 (1.00) |
0.706 (1.00) |
0.921 (1.00) |
0.0819 (1.00) |
0.293 (1.00) |
| 5q gain | 13 (11%) | 101 |
1 (1.00) |
0.532 (1.00) |
1 (1.00) |
0.711 (1.00) |
0.325 (1.00) |
0.451 (1.00) |
| 6p gain | 14 (12%) | 100 |
0.221 (1.00) |
0.019 (1.00) |
0.00456 (1.00) |
0.0609 (1.00) |
0.0237 (1.00) |
0.0619 (1.00) |
| 6q gain | 8 (7%) | 106 |
0.803 (1.00) |
0.259 (1.00) |
0.161 (1.00) |
0.0414 (1.00) |
0.309 (1.00) |
0.0708 (1.00) |
| 7p gain | 6 (5%) | 108 |
0.564 (1.00) |
0.0623 (1.00) |
0.139 (1.00) |
0.0763 (1.00) |
0.366 (1.00) |
0.281 (1.00) |
| 7q gain | 10 (9%) | 104 |
0.175 (1.00) |
0.527 (1.00) |
0.223 (1.00) |
0.266 (1.00) |
0.71 (1.00) |
0.918 (1.00) |
| 8p gain | 11 (10%) | 103 |
0.656 (1.00) |
0.467 (1.00) |
0.144 (1.00) |
0.0303 (1.00) |
0.725 (1.00) |
0.919 (1.00) |
| 8q gain | 21 (18%) | 93 |
0.249 (1.00) |
0.515 (1.00) |
0.0684 (1.00) |
0.103 (1.00) |
0.32 (1.00) |
0.319 (1.00) |
| 9p gain | 10 (9%) | 104 |
0.836 (1.00) |
0.8 (1.00) |
0.741 (1.00) |
0.259 (1.00) |
0.844 (1.00) |
0.0911 (1.00) |
| 9q gain | 10 (9%) | 104 |
0.356 (1.00) |
0.248 (1.00) |
0.318 (1.00) |
0.0613 (1.00) |
0.772 (1.00) |
0.272 (1.00) |
| 10p gain | 7 (6%) | 107 |
1 (1.00) |
0.946 (1.00) |
0.651 (1.00) |
0.542 (1.00) |
0.296 (1.00) |
1 (1.00) |
| 10q gain | 4 (4%) | 110 |
0.812 (1.00) |
0.522 (1.00) |
1 (1.00) |
1 (1.00) |
0.387 (1.00) |
0.693 (1.00) |
| 12p gain | 14 (12%) | 100 |
0.26 (1.00) |
0.471 (1.00) |
0.219 (1.00) |
0.166 (1.00) |
0.163 (1.00) |
0.334 (1.00) |
| 12q gain | 10 (9%) | 104 |
0.391 (1.00) |
0.505 (1.00) |
0.895 (1.00) |
0.618 (1.00) |
0.545 (1.00) |
0.838 (1.00) |
| 13q gain | 4 (4%) | 110 |
0.256 (1.00) |
0.256 (1.00) |
0.464 (1.00) |
0.693 (1.00) |
||
| 14q gain | 9 (8%) | 105 |
0.737 (1.00) |
0.393 (1.00) |
0.258 (1.00) |
0.0974 (1.00) |
0.289 (1.00) |
0.739 (1.00) |
| 15q gain | 13 (11%) | 101 |
0.193 (1.00) |
0.398 (1.00) |
0.477 (1.00) |
0.744 (1.00) |
0.933 (1.00) |
0.931 (1.00) |
| 16p gain | 13 (11%) | 101 |
0.193 (1.00) |
0.332 (1.00) |
0.646 (1.00) |
0.891 (1.00) |
0.21 (1.00) |
0.267 (1.00) |
| 16q gain | 9 (8%) | 105 |
0.236 (1.00) |
0.45 (1.00) |
1 (1.00) |
1 (1.00) |
0.208 (1.00) |
0.287 (1.00) |
| 17p gain | 4 (4%) | 110 |
0.555 (1.00) |
0.217 (1.00) |
1 (1.00) |
1 (1.00) |
0.159 (1.00) |
0.029 (1.00) |
| 17q gain | 11 (10%) | 103 |
0.77 (1.00) |
0.275 (1.00) |
0.161 (1.00) |
0.0414 (1.00) |
0.348 (1.00) |
0.099 (1.00) |
| 18p gain | 11 (10%) | 103 |
0.77 (1.00) |
0.0219 (1.00) |
0.52 (1.00) |
0.548 (1.00) |
0.23 (1.00) |
0.19 (1.00) |
| 18q gain | 6 (5%) | 108 |
1 (1.00) |
0.00157 (0.673) |
0.616 (1.00) |
0.783 (1.00) |
0.316 (1.00) |
0.136 (1.00) |
| 19p gain | 8 (7%) | 106 |
0.361 (1.00) |
0.555 (1.00) |
0.619 (1.00) |
0.576 (1.00) |
0.146 (1.00) |
0.894 (1.00) |
| 19q gain | 20 (18%) | 94 |
0.0384 (1.00) |
0.077 (1.00) |
0.463 (1.00) |
0.262 (1.00) |
0.0068 (1.00) |
0.094 (1.00) |
| 20p gain | 30 (26%) | 84 |
0.00308 (1.00) |
0.398 (1.00) |
1 (1.00) |
0.632 (1.00) |
0.413 (1.00) |
0.562 (1.00) |
| 20q gain | 35 (31%) | 79 |
0.0595 (1.00) |
0.482 (1.00) |
0.918 (1.00) |
0.144 (1.00) |
0.548 (1.00) |
0.432 (1.00) |
| 21q gain | 14 (12%) | 100 |
0.87 (1.00) |
0.4 (1.00) |
0.0714 (1.00) |
0.18 (1.00) |
0.163 (1.00) |
0.504 (1.00) |
| 22q gain | 7 (6%) | 107 |
0.0485 (1.00) |
0.0034 (1.00) |
0.237 (1.00) |
0.0763 (1.00) |
0.0298 (1.00) |
0.884 (1.00) |
| Xq gain | 6 (5%) | 108 |
0.0422 (1.00) |
0.569 (1.00) |
0.268 (1.00) |
0.705 (1.00) |
0.161 (1.00) |
0.761 (1.00) |
| 1q loss | 3 (3%) | 111 |
0.21 (1.00) |
0.183 (1.00) |
0.103 (1.00) |
0.0595 (1.00) |
0.647 (1.00) |
1 (1.00) |
| 2p loss | 3 (3%) | 111 |
0.792 (1.00) |
0.268 (1.00) |
0.773 (1.00) |
0.792 (1.00) |
||
| 2q loss | 5 (4%) | 109 |
0.299 (1.00) |
0.0193 (1.00) |
0.124 (1.00) |
0.172 (1.00) |
1 (1.00) |
1 (1.00) |
| 3p loss | 26 (23%) | 88 |
0.594 (1.00) |
0.00335 (1.00) |
0.688 (1.00) |
0.0852 (1.00) |
0.0127 (1.00) |
0.00406 (1.00) |
| 4p loss | 37 (32%) | 77 |
0.00304 (1.00) |
0.308 (1.00) |
0.795 (1.00) |
0.96 (1.00) |
0.11 (1.00) |
0.763 (1.00) |
| 5p loss | 3 (3%) | 111 |
0.792 (1.00) |
0.238 (1.00) |
0.787 (1.00) |
0.278 (1.00) |
1 (1.00) |
0.616 (1.00) |
| 5q loss | 17 (15%) | 97 |
0.0193 (1.00) |
0.359 (1.00) |
0.888 (1.00) |
0.352 (1.00) |
0.116 (1.00) |
0.0474 (1.00) |
| 6p loss | 13 (11%) | 101 |
0.275 (1.00) |
0.532 (1.00) |
0.223 (1.00) |
0.266 (1.00) |
0.71 (1.00) |
0.805 (1.00) |
| 6q loss | 23 (20%) | 91 |
0.912 (1.00) |
0.18 (1.00) |
0.504 (1.00) |
0.503 (1.00) |
0.434 (1.00) |
0.66 (1.00) |
| 7p loss | 6 (5%) | 108 |
0.261 (1.00) |
0.514 (1.00) |
0.0124 (1.00) |
0.058 (1.00) |
0.0958 (1.00) |
0.483 (1.00) |
| 8p loss | 27 (24%) | 87 |
0.41 (1.00) |
0.175 (1.00) |
0.219 (1.00) |
0.819 (1.00) |
0.925 (1.00) |
0.921 (1.00) |
| 8q loss | 7 (6%) | 107 |
0.413 (1.00) |
0.231 (1.00) |
0.0398 (1.00) |
0.121 (1.00) |
0.339 (1.00) |
0.00487 (1.00) |
| 9p loss | 9 (8%) | 105 |
0.143 (1.00) |
0.639 (1.00) |
0.318 (1.00) |
0.482 (1.00) |
0.289 (1.00) |
0.287 (1.00) |
| 9q loss | 10 (9%) | 104 |
0.356 (1.00) |
0.0416 (1.00) |
0.35 (1.00) |
0.153 (1.00) |
0.844 (1.00) |
0.0534 (1.00) |
| 10p loss | 20 (18%) | 94 |
0.135 (1.00) |
0.36 (1.00) |
0.398 (1.00) |
0.691 (1.00) |
0.583 (1.00) |
0.397 (1.00) |
| 10q loss | 22 (19%) | 92 |
0.195 (1.00) |
0.66 (1.00) |
0.802 (1.00) |
0.463 (1.00) |
0.279 (1.00) |
1 (1.00) |
| 11p loss | 23 (20%) | 91 |
0.0718 (1.00) |
0.46 (1.00) |
0.368 (1.00) |
0.9 (1.00) |
0.312 (1.00) |
0.66 (1.00) |
| 11q loss | 25 (22%) | 89 |
0.00105 (0.452) |
0.0151 (1.00) |
0.802 (1.00) |
0.889 (1.00) |
0.313 (1.00) |
0.457 (1.00) |
| 12p loss | 15 (13%) | 99 |
0.185 (1.00) |
0.142 (1.00) |
0.127 (1.00) |
1 (1.00) |
0.326 (1.00) |
0.355 (1.00) |
| 12q loss | 4 (4%) | 110 |
0.0218 (1.00) |
0.188 (1.00) |
0.285 (1.00) |
0.655 (1.00) |
1 (1.00) |
0.809 (1.00) |
| 13q loss | 21 (18%) | 93 |
0.605 (1.00) |
0.121 (1.00) |
0.836 (1.00) |
0.562 (1.00) |
0.911 (1.00) |
0.191 (1.00) |
| 14q loss | 7 (6%) | 107 |
0.413 (1.00) |
0.231 (1.00) |
0.00515 (1.00) |
0.0416 (1.00) |
0.0373 (1.00) |
0.00487 (1.00) |
| 15q loss | 8 (7%) | 106 |
0.144 (1.00) |
0.444 (1.00) |
0.28 (1.00) |
1 (1.00) |
0.905 (1.00) |
0.807 (1.00) |
| 16p loss | 7 (6%) | 107 |
0.886 (1.00) |
0.173 (1.00) |
0.595 (1.00) |
0.602 (1.00) |
0.794 (1.00) |
0.169 (1.00) |
| 16q loss | 13 (11%) | 101 |
1 (1.00) |
0.0376 (1.00) |
0.0603 (1.00) |
0.0414 (1.00) |
0.614 (1.00) |
0.00792 (1.00) |
| 17p loss | 26 (23%) | 88 |
0.0115 (1.00) |
0.604 (1.00) |
0.293 (1.00) |
0.86 (1.00) |
0.0282 (1.00) |
0.111 (1.00) |
| 17q loss | 5 (4%) | 109 |
1 (1.00) |
0.37 (1.00) |
0.219 (1.00) |
1 (1.00) |
0.37 (1.00) |
0.519 (1.00) |
| 18p loss | 16 (14%) | 98 |
0.316 (1.00) |
0.112 (1.00) |
0.0244 (1.00) |
0.0827 (1.00) |
0.367 (1.00) |
0.0642 (1.00) |
| 18q loss | 22 (19%) | 92 |
0.392 (1.00) |
0.00179 (0.763) |
0.00162 (0.691) |
0.00262 (1.00) |
0.103 (1.00) |
0.00237 (1.00) |
| 19p loss | 11 (10%) | 103 |
0.461 (1.00) |
0.0944 (1.00) |
0.141 (1.00) |
0.356 (1.00) |
0.195 (1.00) |
0.00108 (0.465) |
| 19q loss | 6 (5%) | 108 |
0.406 (1.00) |
0.569 (1.00) |
0.482 (1.00) |
1 (1.00) |
0.596 (1.00) |
0.0298 (1.00) |
| 20p loss | 5 (4%) | 109 |
0.299 (1.00) |
0.789 (1.00) |
0.616 (1.00) |
0.783 (1.00) |
1 (1.00) |
0.595 (1.00) |
| 22q loss | 12 (11%) | 102 |
0.668 (1.00) |
0.0597 (1.00) |
0.526 (1.00) |
0.0879 (1.00) |
1 (1.00) |
0.926 (1.00) |
P value = 3e-07 (Fisher's exact test), Q value = 0.00013
Table S1. Gene #43: '4q loss mutation analysis' versus Clinical Feature #1: 'CN_CNMF'
| nPatients | CLUS_1 | CLUS_2 | CLUS_3 |
|---|---|---|---|
| ALL | 35 | 25 | 54 |
| 4Q LOSS MUTATED | 5 | 15 | 3 |
| 4Q LOSS WILD-TYPE | 30 | 10 | 51 |
Figure S1. Get High-res Image Gene #43: '4q loss mutation analysis' versus Clinical Feature #1: 'CN_CNMF'
P value = 0.000251 (Fisher's exact test), Q value = 0.11
Table S2. Gene #49: '7q loss mutation analysis' versus Clinical Feature #4: 'MRNASEQ_CHIERARCHICAL'
| nPatients | CLUS_1 | CLUS_2 | CLUS_3 |
|---|---|---|---|
| ALL | 20 | 24 | 49 |
| 7Q LOSS MUTATED | 7 | 5 | 1 |
| 7Q LOSS WILD-TYPE | 13 | 19 | 48 |
Figure S2. Get High-res Image Gene #49: '7q loss mutation analysis' versus Clinical Feature #4: 'MRNASEQ_CHIERARCHICAL'
P value = 0.00011 (Fisher's exact test), Q value = 0.048
Table S3. Gene #72: '21q loss mutation analysis' versus Clinical Feature #1: 'CN_CNMF'
| nPatients | CLUS_1 | CLUS_2 | CLUS_3 |
|---|---|---|---|
| ALL | 35 | 25 | 54 |
| 21Q LOSS MUTATED | 6 | 7 | 0 |
| 21Q LOSS WILD-TYPE | 29 | 18 | 54 |
Figure S3. Get High-res Image Gene #72: '21q loss mutation analysis' versus Clinical Feature #1: 'CN_CNMF'
-
Mutation data file = broad_values_by_arm.mutsig.cluster.txt
-
Molecular subtypes file = CESC-TP.transferedmergedcluster.txt
-
Number of patients = 114
-
Number of significantly arm-level cnvs = 73
-
Number of molecular subtypes = 6
-
Exclude genes that fewer than K tumors have mutations, K = 3
For binary or multi-class clinical features (nominal or ordinal), two-tailed Fisher's exact tests (Fisher 1922) were used to estimate the P values using the 'fisher.test' function in R
For multi-class clinical features (nominal or ordinal), Chi-square tests (Greenwood and Nikulin 1996) were used to estimate the P values using the 'chisq.test' function in R
For multiple hypothesis correction, Q value is the False Discovery Rate (FDR) analogue of the P value (Benjamini and Hochberg 1995), defined as the minimum FDR at which the test may be called significant. We used the 'Benjamini and Hochberg' method of 'p.adjust' function in R to convert P values into Q values.
This is an experimental feature. The full results of the analysis summarized in this report can be downloaded from the TCGA Data Coordination Center.