This pipeline computes the correlation between significant arm-level copy number variations (cnvs) and selected clinical features.
Testing the association between subtypes identified by 78 different clustering approaches and 10 clinical features across 575 patients, 25 significant findings detected with Q value < 0.25.
-
2 subtypes identified in current cancer cohort by '1p gain mutation analysis'. These subtypes do not correlate to any clinical features.
-
2 subtypes identified in current cancer cohort by '1q gain mutation analysis'. These subtypes do not correlate to any clinical features.
-
2 subtypes identified in current cancer cohort by '2p gain mutation analysis'. These subtypes do not correlate to any clinical features.
-
2 subtypes identified in current cancer cohort by '2q gain mutation analysis'. These subtypes do not correlate to any clinical features.
-
2 subtypes identified in current cancer cohort by '3p gain mutation analysis'. These subtypes do not correlate to any clinical features.
-
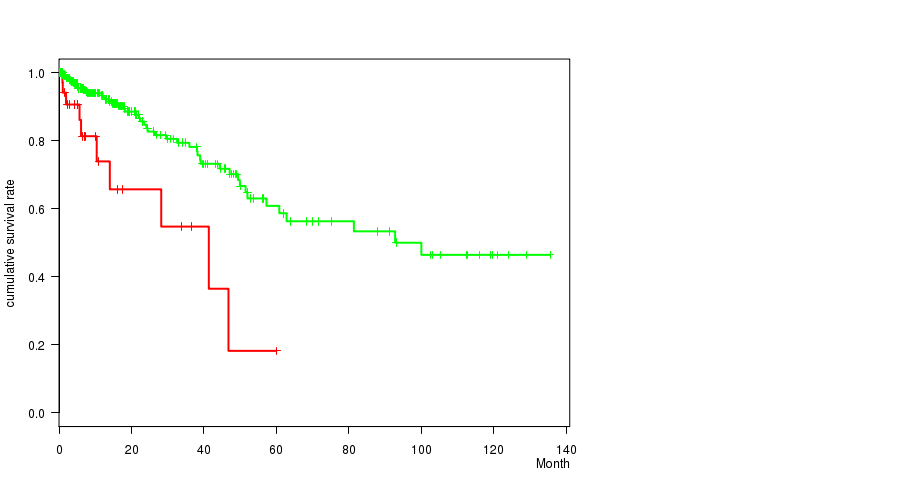
2 subtypes identified in current cancer cohort by '3q gain mutation analysis'. These subtypes correlate to 'Time to Death' and 'PATHOLOGICSPREAD(M)'.
-
2 subtypes identified in current cancer cohort by '4p gain mutation analysis'. These subtypes do not correlate to any clinical features.
-
2 subtypes identified in current cancer cohort by '4q gain mutation analysis'. These subtypes do not correlate to any clinical features.
-
2 subtypes identified in current cancer cohort by '5p gain mutation analysis'. These subtypes do not correlate to any clinical features.
-
2 subtypes identified in current cancer cohort by '5q gain mutation analysis'. These subtypes do not correlate to any clinical features.
-
2 subtypes identified in current cancer cohort by '6p gain mutation analysis'. These subtypes do not correlate to any clinical features.
-
2 subtypes identified in current cancer cohort by '6q gain mutation analysis'. These subtypes do not correlate to any clinical features.
-
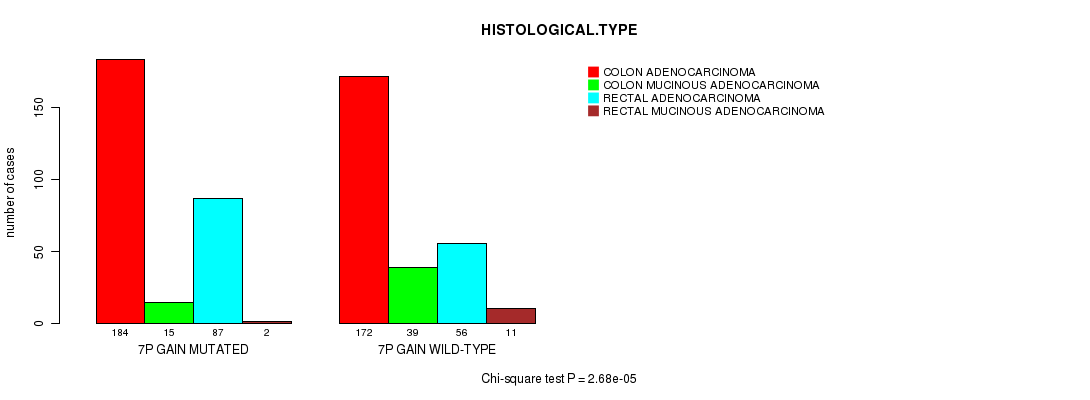
2 subtypes identified in current cancer cohort by '7p gain mutation analysis'. These subtypes correlate to 'HISTOLOGICAL.TYPE' and 'TUMOR.STAGE'.
-
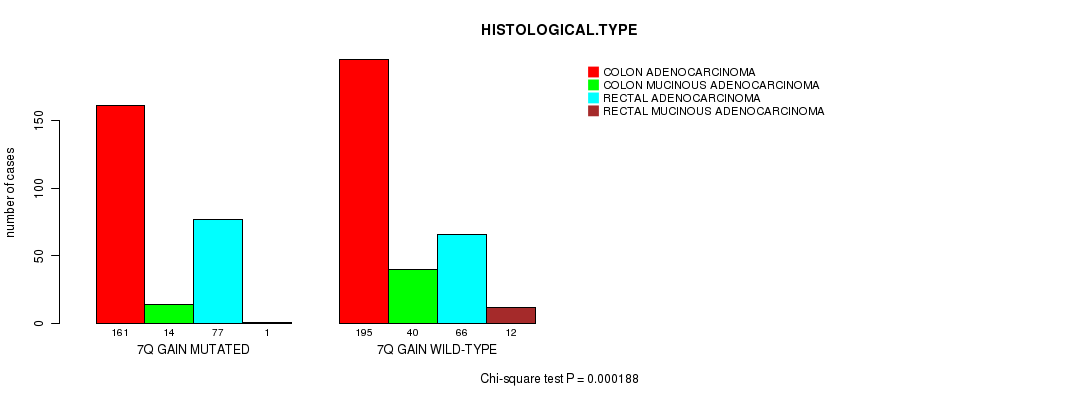
2 subtypes identified in current cancer cohort by '7q gain mutation analysis'. These subtypes correlate to 'HISTOLOGICAL.TYPE' and 'TUMOR.STAGE'.
-
2 subtypes identified in current cancer cohort by '8p gain mutation analysis'. These subtypes do not correlate to any clinical features.
-
2 subtypes identified in current cancer cohort by '8q gain mutation analysis'. These subtypes do not correlate to any clinical features.
-
2 subtypes identified in current cancer cohort by '9p gain mutation analysis'. These subtypes do not correlate to any clinical features.
-
2 subtypes identified in current cancer cohort by '9q gain mutation analysis'. These subtypes do not correlate to any clinical features.
-
2 subtypes identified in current cancer cohort by '10p gain mutation analysis'. These subtypes do not correlate to any clinical features.
-
2 subtypes identified in current cancer cohort by '10q gain mutation analysis'. These subtypes do not correlate to any clinical features.
-
2 subtypes identified in current cancer cohort by '11p gain mutation analysis'. These subtypes correlate to 'HISTOLOGICAL.TYPE'.
-
2 subtypes identified in current cancer cohort by '11q gain mutation analysis'. These subtypes do not correlate to any clinical features.
-
2 subtypes identified in current cancer cohort by '12p gain mutation analysis'. These subtypes do not correlate to any clinical features.
-
2 subtypes identified in current cancer cohort by '12q gain mutation analysis'. These subtypes do not correlate to any clinical features.
-
2 subtypes identified in current cancer cohort by '13q gain mutation analysis'. These subtypes correlate to 'HISTOLOGICAL.TYPE'.
-
2 subtypes identified in current cancer cohort by '14q gain mutation analysis'. These subtypes do not correlate to any clinical features.
-
2 subtypes identified in current cancer cohort by '15q gain mutation analysis'. These subtypes do not correlate to any clinical features.
-
2 subtypes identified in current cancer cohort by '16p gain mutation analysis'. These subtypes do not correlate to any clinical features.
-
2 subtypes identified in current cancer cohort by '16q gain mutation analysis'. These subtypes correlate to 'TUMOR.STAGE'.
-
2 subtypes identified in current cancer cohort by '17p gain mutation analysis'. These subtypes do not correlate to any clinical features.
-
2 subtypes identified in current cancer cohort by '17q gain mutation analysis'. These subtypes do not correlate to any clinical features.
-
2 subtypes identified in current cancer cohort by '18p gain mutation analysis'. These subtypes correlate to 'PATHOLOGICSPREAD(M)'.
-
2 subtypes identified in current cancer cohort by '18q gain mutation analysis'. These subtypes do not correlate to any clinical features.
-
2 subtypes identified in current cancer cohort by '19p gain mutation analysis'. These subtypes do not correlate to any clinical features.
-
2 subtypes identified in current cancer cohort by '19q gain mutation analysis'. These subtypes do not correlate to any clinical features.
-
2 subtypes identified in current cancer cohort by '20p gain mutation analysis'. These subtypes correlate to 'HISTOLOGICAL.TYPE'.
-
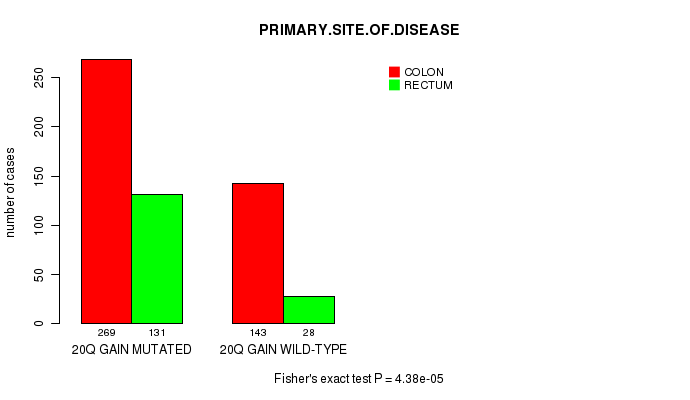
2 subtypes identified in current cancer cohort by '20q gain mutation analysis'. These subtypes correlate to 'PRIMARY.SITE.OF.DISEASE' and 'HISTOLOGICAL.TYPE'.
-
2 subtypes identified in current cancer cohort by '21q gain mutation analysis'. These subtypes do not correlate to any clinical features.
-
2 subtypes identified in current cancer cohort by '22q gain mutation analysis'. These subtypes do not correlate to any clinical features.
-
2 subtypes identified in current cancer cohort by 'Xq gain mutation analysis'. These subtypes correlate to 'PATHOLOGICSPREAD(M)'.
-
2 subtypes identified in current cancer cohort by '1p loss mutation analysis'. These subtypes do not correlate to any clinical features.
-
2 subtypes identified in current cancer cohort by '1q loss mutation analysis'. These subtypes do not correlate to any clinical features.
-
2 subtypes identified in current cancer cohort by '2p loss mutation analysis'. These subtypes do not correlate to any clinical features.
-
2 subtypes identified in current cancer cohort by '2q loss mutation analysis'. These subtypes correlate to 'Time to Death'.
-
2 subtypes identified in current cancer cohort by '3p loss mutation analysis'. These subtypes correlate to 'Time to Death'.
-
2 subtypes identified in current cancer cohort by '3q loss mutation analysis'. These subtypes correlate to 'HISTOLOGICAL.TYPE'.
-
2 subtypes identified in current cancer cohort by '4p loss mutation analysis'. These subtypes do not correlate to any clinical features.
-
2 subtypes identified in current cancer cohort by '4q loss mutation analysis'. These subtypes do not correlate to any clinical features.
-
2 subtypes identified in current cancer cohort by '5p loss mutation analysis'. These subtypes do not correlate to any clinical features.
-
2 subtypes identified in current cancer cohort by '5q loss mutation analysis'. These subtypes do not correlate to any clinical features.
-
2 subtypes identified in current cancer cohort by '6p loss mutation analysis'. These subtypes do not correlate to any clinical features.
-
2 subtypes identified in current cancer cohort by '6q loss mutation analysis'. These subtypes do not correlate to any clinical features.
-
2 subtypes identified in current cancer cohort by '7q loss mutation analysis'. These subtypes do not correlate to any clinical features.
-
2 subtypes identified in current cancer cohort by '8p loss mutation analysis'. These subtypes do not correlate to any clinical features.
-
2 subtypes identified in current cancer cohort by '8q loss mutation analysis'. These subtypes do not correlate to any clinical features.
-
2 subtypes identified in current cancer cohort by '9p loss mutation analysis'. These subtypes do not correlate to any clinical features.
-
2 subtypes identified in current cancer cohort by '9q loss mutation analysis'. These subtypes do not correlate to any clinical features.
-
2 subtypes identified in current cancer cohort by '10p loss mutation analysis'. These subtypes do not correlate to any clinical features.
-
2 subtypes identified in current cancer cohort by '10q loss mutation analysis'. These subtypes do not correlate to any clinical features.
-
2 subtypes identified in current cancer cohort by '11p loss mutation analysis'. These subtypes do not correlate to any clinical features.
-
2 subtypes identified in current cancer cohort by '11q loss mutation analysis'. These subtypes correlate to 'HISTOLOGICAL.TYPE'.
-
2 subtypes identified in current cancer cohort by '12p loss mutation analysis'. These subtypes do not correlate to any clinical features.
-
2 subtypes identified in current cancer cohort by '12q loss mutation analysis'. These subtypes do not correlate to any clinical features.
-
2 subtypes identified in current cancer cohort by '13q loss mutation analysis'. These subtypes do not correlate to any clinical features.
-
2 subtypes identified in current cancer cohort by '14q loss mutation analysis'. These subtypes correlate to 'HISTOLOGICAL.TYPE'.
-
2 subtypes identified in current cancer cohort by '15q loss mutation analysis'. These subtypes do not correlate to any clinical features.
-
2 subtypes identified in current cancer cohort by '16p loss mutation analysis'. These subtypes do not correlate to any clinical features.
-
2 subtypes identified in current cancer cohort by '16q loss mutation analysis'. These subtypes do not correlate to any clinical features.
-
2 subtypes identified in current cancer cohort by '17p loss mutation analysis'. These subtypes correlate to 'HISTOLOGICAL.TYPE'.
-
2 subtypes identified in current cancer cohort by '17q loss mutation analysis'. These subtypes do not correlate to any clinical features.
-
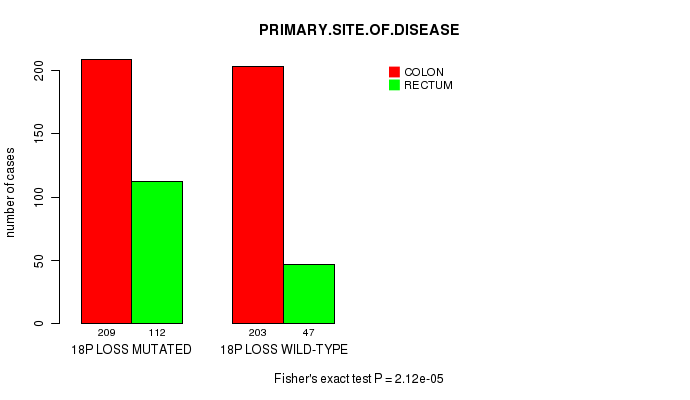
2 subtypes identified in current cancer cohort by '18p loss mutation analysis'. These subtypes correlate to 'PRIMARY.SITE.OF.DISEASE' and 'HISTOLOGICAL.TYPE'.
-
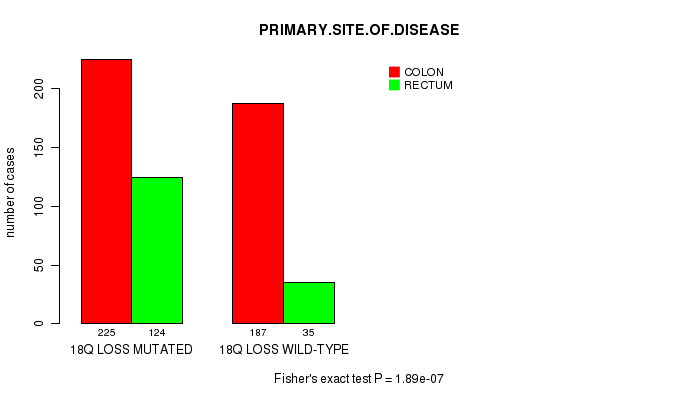
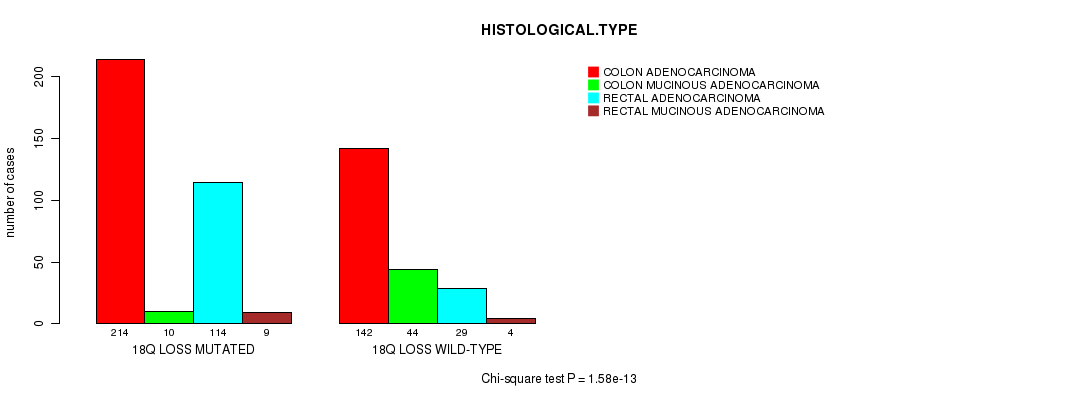
2 subtypes identified in current cancer cohort by '18q loss mutation analysis'. These subtypes correlate to 'PRIMARY.SITE.OF.DISEASE', 'HISTOLOGICAL.TYPE', and 'TUMOR.STAGE'.
-
2 subtypes identified in current cancer cohort by '19p loss mutation analysis'. These subtypes do not correlate to any clinical features.
-
2 subtypes identified in current cancer cohort by '19q loss mutation analysis'. These subtypes do not correlate to any clinical features.
-
2 subtypes identified in current cancer cohort by '20p loss mutation analysis'. These subtypes do not correlate to any clinical features.
-
2 subtypes identified in current cancer cohort by '21q loss mutation analysis'. These subtypes do not correlate to any clinical features.
-
2 subtypes identified in current cancer cohort by '22q loss mutation analysis'. These subtypes do not correlate to any clinical features.
-
2 subtypes identified in current cancer cohort by 'Xq loss mutation analysis'. These subtypes do not correlate to any clinical features.
Table 1. Get Full Table Overview of the association between subtypes identified by 78 different clustering approaches and 10 clinical features. Shown in the table are P values (Q values). Thresholded by Q value < 0.25, 25 significant findings detected.
|
Clinical Features |
Time to Death |
AGE |
PRIMARY SITE OF DISEASE |
GENDER |
HISTOLOGICAL TYPE |
PATHOLOGY T |
PATHOLOGY N |
PATHOLOGICSPREAD(M) |
TUMOR STAGE |
RADIATIONS RADIATION REGIMENINDICATION |
| Statistical Tests | logrank test | t-test | Fisher's exact test | Fisher's exact test | Chi-square test | Chi-square test | Chi-square test | Chi-square test | Chi-square test | Fisher's exact test |
| 1p gain |
0.85 (1.00) |
0.658 (1.00) |
1 (1.00) |
0.61 (1.00) |
0.655 (1.00) |
0.828 (1.00) |
0.0333 (1.00) |
0.813 (1.00) |
0.59 (1.00) |
1 (1.00) |
| 1q gain |
0.656 (1.00) |
0.838 (1.00) |
0.174 (1.00) |
0.148 (1.00) |
0.0752 (1.00) |
0.203 (1.00) |
0.182 (1.00) |
0.33 (1.00) |
0.0233 (1.00) |
1 (1.00) |
| 2p gain |
0.328 (1.00) |
0.924 (1.00) |
0.361 (1.00) |
0.173 (1.00) |
0.0531 (1.00) |
0.532 (1.00) |
0.314 (1.00) |
0.976 (1.00) |
0.137 (1.00) |
1 (1.00) |
| 2q gain |
0.384 (1.00) |
0.448 (1.00) |
0.169 (1.00) |
0.217 (1.00) |
0.036 (1.00) |
0.748 (1.00) |
0.405 (1.00) |
0.9 (1.00) |
0.141 (1.00) |
1 (1.00) |
| 3p gain |
0.0324 (1.00) |
0.31 (1.00) |
0.0194 (1.00) |
0.301 (1.00) |
0.0318 (1.00) |
0.879 (1.00) |
0.634 (1.00) |
0.00172 (1.00) |
0.424 (1.00) |
0.444 (1.00) |
| 3q gain |
0.000218 (0.165) |
0.644 (1.00) |
0.00881 (1.00) |
0.148 (1.00) |
0.00797 (1.00) |
0.91 (1.00) |
0.0331 (1.00) |
0.000283 (0.214) |
0.0225 (1.00) |
0.198 (1.00) |
| 4p gain |
0.421 (1.00) |
0.885 (1.00) |
0.0537 (1.00) |
0.691 (1.00) |
0.129 (1.00) |
0.64 (1.00) |
0.252 (1.00) |
0.0446 (1.00) |
0.102 (1.00) |
1 (1.00) |
| 4q gain |
0.983 (1.00) |
0.758 (1.00) |
0.404 (1.00) |
1 (1.00) |
0.627 (1.00) |
0.591 (1.00) |
0.125 (1.00) |
0.179 (1.00) |
0.074 (1.00) |
1 (1.00) |
| 5p gain |
0.953 (1.00) |
0.356 (1.00) |
0.361 (1.00) |
1 (1.00) |
0.192 (1.00) |
0.836 (1.00) |
0.232 (1.00) |
0.777 (1.00) |
0.517 (1.00) |
0.24 (1.00) |
| 5q gain |
0.903 (1.00) |
0.867 (1.00) |
0.316 (1.00) |
0.592 (1.00) |
0.251 (1.00) |
0.675 (1.00) |
0.212 (1.00) |
0.416 (1.00) |
0.211 (1.00) |
1 (1.00) |
| 6p gain |
0.624 (1.00) |
0.48 (1.00) |
0.0769 (1.00) |
1 (1.00) |
0.0508 (1.00) |
0.626 (1.00) |
0.0014 (1.00) |
0.752 (1.00) |
0.0511 (1.00) |
0.107 (1.00) |
| 6q gain |
0.875 (1.00) |
0.874 (1.00) |
0.0866 (1.00) |
0.899 (1.00) |
0.0593 (1.00) |
0.886 (1.00) |
0.0057 (1.00) |
0.631 (1.00) |
0.029 (1.00) |
0.307 (1.00) |
| 7p gain |
0.157 (1.00) |
0.631 (1.00) |
0.113 (1.00) |
1 (1.00) |
2.68e-05 (0.0206) |
0.928 (1.00) |
0.000393 (0.296) |
0.0472 (1.00) |
1.2e-05 (0.00925) |
0.505 (1.00) |
| 7q gain |
0.216 (1.00) |
0.615 (1.00) |
0.16 (1.00) |
0.866 (1.00) |
0.000188 (0.143) |
0.902 (1.00) |
0.00989 (1.00) |
0.0213 (1.00) |
5.86e-05 (0.0447) |
0.519 (1.00) |
| 8p gain |
0.64 (1.00) |
0.516 (1.00) |
0.551 (1.00) |
0.831 (1.00) |
0.911 (1.00) |
0.445 (1.00) |
0.323 (1.00) |
0.832 (1.00) |
0.89 (1.00) |
1 (1.00) |
| 8q gain |
0.232 (1.00) |
0.125 (1.00) |
0.395 (1.00) |
0.396 (1.00) |
0.0428 (1.00) |
0.2 (1.00) |
0.256 (1.00) |
0.29 (1.00) |
0.367 (1.00) |
0.744 (1.00) |
| 9p gain |
0.239 (1.00) |
0.339 (1.00) |
0.00178 (1.00) |
0.717 (1.00) |
0.0137 (1.00) |
0.785 (1.00) |
0.316 (1.00) |
0.674 (1.00) |
0.286 (1.00) |
0.619 (1.00) |
| 9q gain |
0.106 (1.00) |
0.197 (1.00) |
0.0386 (1.00) |
0.233 (1.00) |
0.251 (1.00) |
0.351 (1.00) |
0.328 (1.00) |
0.7 (1.00) |
0.189 (1.00) |
0.607 (1.00) |
| 10p gain |
0.0421 (1.00) |
0.165 (1.00) |
1 (1.00) |
0.252 (1.00) |
0.585 (1.00) |
0.0906 (1.00) |
0.00216 (1.00) |
0.14 (1.00) |
0.215 (1.00) |
1 (1.00) |
| 10q gain |
0.431 (1.00) |
0.0098 (1.00) |
0.762 (1.00) |
0.4 (1.00) |
0.774 (1.00) |
0.261 (1.00) |
0.0237 (1.00) |
0.494 (1.00) |
0.122 (1.00) |
1 (1.00) |
| 11p gain |
0.458 (1.00) |
0.031 (1.00) |
0.000607 (0.455) |
0.187 (1.00) |
0.000142 (0.108) |
0.11 (1.00) |
0.377 (1.00) |
0.479 (1.00) |
0.388 (1.00) |
1 (1.00) |
| 11q gain |
0.414 (1.00) |
0.00274 (1.00) |
0.0272 (1.00) |
1 (1.00) |
0.0128 (1.00) |
0.226 (1.00) |
0.503 (1.00) |
0.751 (1.00) |
0.13 (1.00) |
1 (1.00) |
| 12p gain |
0.659 (1.00) |
0.0189 (1.00) |
0.801 (1.00) |
0.91 (1.00) |
0.928 (1.00) |
0.492 (1.00) |
0.0134 (1.00) |
0.409 (1.00) |
0.0741 (1.00) |
0.644 (1.00) |
| 12q gain |
0.834 (1.00) |
0.00427 (1.00) |
0.344 (1.00) |
0.393 (1.00) |
0.662 (1.00) |
0.604 (1.00) |
0.0409 (1.00) |
0.443 (1.00) |
0.0292 (1.00) |
0.617 (1.00) |
| 13q gain |
0.29 (1.00) |
0.874 (1.00) |
0.0192 (1.00) |
0.45 (1.00) |
9.64e-09 (7.48e-06) |
0.783 (1.00) |
0.00128 (0.951) |
0.188 (1.00) |
0.00258 (1.00) |
0.521 (1.00) |
| 14q gain |
0.313 (1.00) |
0.908 (1.00) |
0.61 (1.00) |
1 (1.00) |
0.707 (1.00) |
0.247 (1.00) |
0.445 (1.00) |
0.0266 (1.00) |
0.447 (1.00) |
0.263 (1.00) |
| 15q gain |
0.91 (1.00) |
0.405 (1.00) |
1 (1.00) |
0.71 (1.00) |
0.137 (1.00) |
0.938 (1.00) |
0.741 (1.00) |
0.714 (1.00) |
0.715 (1.00) |
1 (1.00) |
| 16p gain |
0.689 (1.00) |
0.342 (1.00) |
0.618 (1.00) |
1 (1.00) |
0.029 (1.00) |
0.788 (1.00) |
0.00692 (1.00) |
0.371 (1.00) |
0.00299 (1.00) |
0.178 (1.00) |
| 16q gain |
0.853 (1.00) |
0.215 (1.00) |
0.454 (1.00) |
1 (1.00) |
0.0242 (1.00) |
0.737 (1.00) |
0.000453 (0.341) |
0.312 (1.00) |
0.000263 (0.199) |
0.178 (1.00) |
| 17p gain |
0.163 (1.00) |
0.669 (1.00) |
0.531 (1.00) |
0.78 (1.00) |
0.378 (1.00) |
0.65 (1.00) |
0.892 (1.00) |
0.00171 (1.00) |
0.694 (1.00) |
1 (1.00) |
| 17q gain |
0.0443 (1.00) |
0.51 (1.00) |
0.772 (1.00) |
0.3 (1.00) |
0.118 (1.00) |
0.812 (1.00) |
0.985 (1.00) |
0.0163 (1.00) |
0.371 (1.00) |
1 (1.00) |
| 18p gain |
0.696 (1.00) |
0.931 (1.00) |
1 (1.00) |
1 (1.00) |
0.109 (1.00) |
0.471 (1.00) |
0.00124 (0.926) |
1.41e-05 (0.0108) |
0.718 (1.00) |
0.286 (1.00) |
| 18q gain |
0.639 (1.00) |
0.596 (1.00) |
1 (1.00) |
0.398 (1.00) |
0.298 (1.00) |
0.0617 (1.00) |
0.0735 (1.00) |
0.826 (1.00) |
0.987 (1.00) |
0.174 (1.00) |
| 19p gain |
0.575 (1.00) |
0.37 (1.00) |
0.259 (1.00) |
0.884 (1.00) |
0.0792 (1.00) |
0.87 (1.00) |
0.836 (1.00) |
0.724 (1.00) |
0.984 (1.00) |
1 (1.00) |
| 19q gain |
0.279 (1.00) |
0.351 (1.00) |
0.367 (1.00) |
0.499 (1.00) |
0.285 (1.00) |
0.892 (1.00) |
0.952 (1.00) |
0.992 (1.00) |
0.911 (1.00) |
0.608 (1.00) |
| 20p gain |
0.34 (1.00) |
0.564 (1.00) |
0.00146 (1.00) |
0.024 (1.00) |
2.61e-08 (2.02e-05) |
0.35 (1.00) |
0.365 (1.00) |
0.0171 (1.00) |
0.0352 (1.00) |
1 (1.00) |
| 20q gain |
0.431 (1.00) |
0.88 (1.00) |
4.38e-05 (0.0335) |
0.362 (1.00) |
1.53e-15 (1.19e-12) |
0.236 (1.00) |
0.0396 (1.00) |
0.0328 (1.00) |
0.00142 (1.00) |
0.731 (1.00) |
| 21q gain |
0.262 (1.00) |
0.607 (1.00) |
0.292 (1.00) |
0.644 (1.00) |
0.52 (1.00) |
0.177 (1.00) |
0.126 (1.00) |
0.741 (1.00) |
0.311 (1.00) |
1 (1.00) |
| 22q gain |
0.487 (1.00) |
0.542 (1.00) |
0.0201 (1.00) |
0.71 (1.00) |
0.0431 (1.00) |
0.722 (1.00) |
0.174 (1.00) |
0.179 (1.00) |
0.0747 (1.00) |
1 (1.00) |
| Xq gain |
0.0508 (1.00) |
0.469 (1.00) |
0.583 (1.00) |
0.628 (1.00) |
0.69 (1.00) |
0.295 (1.00) |
0.128 (1.00) |
1.67e-07 (0.000129) |
0.0988 (1.00) |
1 (1.00) |
| 1p loss |
0.054 (1.00) |
0.932 (1.00) |
0.774 (1.00) |
0.52 (1.00) |
0.231 (1.00) |
0.714 (1.00) |
0.0535 (1.00) |
0.185 (1.00) |
0.101 (1.00) |
1 (1.00) |
| 1q loss |
0.717 (1.00) |
0.179 (1.00) |
0.651 (1.00) |
0.312 (1.00) |
0.76 (1.00) |
0.733 (1.00) |
0.192 (1.00) |
0.631 (1.00) |
0.365 (1.00) |
0.332 (1.00) |
| 2p loss |
0.311 (1.00) |
0.324 (1.00) |
0.151 (1.00) |
0.758 (1.00) |
0.233 (1.00) |
0.652 (1.00) |
0.885 (1.00) |
0.855 (1.00) |
0.842 (1.00) |
1 (1.00) |
| 2q loss |
3.78e-07 (0.000292) |
0.809 (1.00) |
1 (1.00) |
0.73 (1.00) |
0.623 (1.00) |
0.644 (1.00) |
0.862 (1.00) |
0.658 (1.00) |
0.259 (1.00) |
1 (1.00) |
| 3p loss |
3.17e-05 (0.0243) |
0.909 (1.00) |
0.335 (1.00) |
0.163 (1.00) |
0.0491 (1.00) |
0.116 (1.00) |
0.0823 (1.00) |
0.00361 (1.00) |
0.0214 (1.00) |
0.434 (1.00) |
| 3q loss |
0.0355 (1.00) |
0.121 (1.00) |
0.791 (1.00) |
0.0815 (1.00) |
4.51e-05 (0.0344) |
0.473 (1.00) |
0.835 (1.00) |
0.169 (1.00) |
0.152 (1.00) |
0.238 (1.00) |
| 4p loss |
0.028 (1.00) |
0.29 (1.00) |
0.304 (1.00) |
0.475 (1.00) |
0.0283 (1.00) |
0.765 (1.00) |
0.0079 (1.00) |
0.0151 (1.00) |
0.00673 (1.00) |
0.101 (1.00) |
| 4q loss |
0.417 (1.00) |
0.288 (1.00) |
0.00866 (1.00) |
0.674 (1.00) |
0.00174 (1.00) |
0.685 (1.00) |
0.08 (1.00) |
0.518 (1.00) |
0.153 (1.00) |
0.0795 (1.00) |
| 5p loss |
0.508 (1.00) |
0.66 (1.00) |
0.845 (1.00) |
0.481 (1.00) |
0.182 (1.00) |
0.649 (1.00) |
0.0677 (1.00) |
0.974 (1.00) |
0.0829 (1.00) |
0.0941 (1.00) |
| 5q loss |
0.533 (1.00) |
0.659 (1.00) |
0.0672 (1.00) |
0.891 (1.00) |
0.0666 (1.00) |
0.385 (1.00) |
0.0313 (1.00) |
0.769 (1.00) |
0.44 (1.00) |
0.00908 (1.00) |
| 6p loss |
0.401 (1.00) |
0.889 (1.00) |
1 (1.00) |
0.813 (1.00) |
0.0576 (1.00) |
0.871 (1.00) |
0.434 (1.00) |
0.605 (1.00) |
0.615 (1.00) |
1 (1.00) |
| 6q loss |
0.0672 (1.00) |
0.211 (1.00) |
0.543 (1.00) |
1 (1.00) |
0.0461 (1.00) |
0.49 (1.00) |
0.0607 (1.00) |
0.000881 (0.658) |
0.473 (1.00) |
1 (1.00) |
| 7q loss |
0.191 (1.00) |
0.0213 (1.00) |
0.6 (1.00) |
0.000748 (0.56) |
0.84 (1.00) |
0.327 (1.00) |
0.924 (1.00) |
0.483 (1.00) |
1 (1.00) |
|
| 8p loss |
0.948 (1.00) |
0.996 (1.00) |
0.00687 (1.00) |
0.0831 (1.00) |
0.00258 (1.00) |
0.759 (1.00) |
0.0353 (1.00) |
0.19 (1.00) |
0.268 (1.00) |
0.0493 (1.00) |
| 8q loss |
0.765 (1.00) |
0.117 (1.00) |
1 (1.00) |
0.154 (1.00) |
0.955 (1.00) |
0.906 (1.00) |
0.879 (1.00) |
0.2 (1.00) |
0.162 (1.00) |
1 (1.00) |
| 9p loss |
0.0253 (1.00) |
0.271 (1.00) |
0.712 (1.00) |
1 (1.00) |
0.796 (1.00) |
0.278 (1.00) |
0.809 (1.00) |
0.83 (1.00) |
0.528 (1.00) |
1 (1.00) |
| 9q loss |
0.287 (1.00) |
0.00981 (1.00) |
1 (1.00) |
0.395 (1.00) |
0.574 (1.00) |
0.123 (1.00) |
0.641 (1.00) |
0.925 (1.00) |
0.356 (1.00) |
1 (1.00) |
| 10p loss |
0.566 (1.00) |
0.0105 (1.00) |
0.043 (1.00) |
0.511 (1.00) |
0.00343 (1.00) |
0.552 (1.00) |
0.377 (1.00) |
0.595 (1.00) |
0.166 (1.00) |
0.48 (1.00) |
| 10q loss |
0.346 (1.00) |
0.0151 (1.00) |
0.00307 (1.00) |
1 (1.00) |
0.00126 (0.939) |
0.722 (1.00) |
0.77 (1.00) |
0.829 (1.00) |
0.537 (1.00) |
0.53 (1.00) |
| 11p loss |
0.377 (1.00) |
0.969 (1.00) |
0.00589 (1.00) |
0.743 (1.00) |
0.000446 (0.336) |
0.897 (1.00) |
0.253 (1.00) |
0.962 (1.00) |
0.0439 (1.00) |
0.48 (1.00) |
| 11q loss |
0.74 (1.00) |
0.821 (1.00) |
0.00745 (1.00) |
0.378 (1.00) |
0.000277 (0.21) |
0.556 (1.00) |
0.141 (1.00) |
0.981 (1.00) |
0.472 (1.00) |
0.0377 (1.00) |
| 12p loss |
0.0704 (1.00) |
0.986 (1.00) |
0.316 (1.00) |
0.0481 (1.00) |
0.119 (1.00) |
0.0718 (1.00) |
0.0219 (1.00) |
0.511 (1.00) |
0.171 (1.00) |
0.415 (1.00) |
| 12q loss |
0.103 (1.00) |
0.578 (1.00) |
1 (1.00) |
0.252 (1.00) |
0.266 (1.00) |
0.325 (1.00) |
0.032 (1.00) |
0.29 (1.00) |
0.139 (1.00) |
1 (1.00) |
| 13q loss |
0.874 (1.00) |
0.864 (1.00) |
0.329 (1.00) |
1 (1.00) |
0.457 (1.00) |
0.591 (1.00) |
0.0334 (1.00) |
0.426 (1.00) |
0.56 (1.00) |
1 (1.00) |
| 14q loss |
0.382 (1.00) |
0.696 (1.00) |
0.0658 (1.00) |
1 (1.00) |
0.000111 (0.0849) |
0.476 (1.00) |
0.011 (1.00) |
0.219 (1.00) |
0.594 (1.00) |
1 (1.00) |
| 15q loss |
0.531 (1.00) |
0.64 (1.00) |
0.0113 (1.00) |
0.851 (1.00) |
0.00156 (1.00) |
0.398 (1.00) |
0.305 (1.00) |
0.365 (1.00) |
0.204 (1.00) |
0.263 (1.00) |
| 16p loss |
0.993 (1.00) |
0.548 (1.00) |
0.379 (1.00) |
0.123 (1.00) |
0.522 (1.00) |
0.754 (1.00) |
0.592 (1.00) |
0.985 (1.00) |
0.817 (1.00) |
1 (1.00) |
| 16q loss |
0.455 (1.00) |
0.852 (1.00) |
0.00999 (1.00) |
0.628 (1.00) |
0.0485 (1.00) |
0.729 (1.00) |
0.192 (1.00) |
0.972 (1.00) |
0.701 (1.00) |
0.238 (1.00) |
| 17p loss |
0.429 (1.00) |
0.587 (1.00) |
0.0019 (1.00) |
0.614 (1.00) |
2.86e-06 (0.0022) |
0.631 (1.00) |
0.044 (1.00) |
0.000879 (0.658) |
0.019 (1.00) |
0.19 (1.00) |
| 17q loss |
0.52 (1.00) |
0.854 (1.00) |
0.39 (1.00) |
0.877 (1.00) |
0.331 (1.00) |
0.497 (1.00) |
0.0974 (1.00) |
0.922 (1.00) |
0.499 (1.00) |
0.152 (1.00) |
| 18p loss |
0.607 (1.00) |
0.351 (1.00) |
2.12e-05 (0.0163) |
0.933 (1.00) |
1.4e-13 (1.09e-10) |
0.668 (1.00) |
0.00128 (0.952) |
0.00874 (1.00) |
0.00152 (1.00) |
0.738 (1.00) |
| 18q loss |
0.422 (1.00) |
0.32 (1.00) |
1.89e-07 (0.000146) |
0.731 (1.00) |
1.58e-13 (1.22e-10) |
0.223 (1.00) |
0.00037 (0.279) |
0.0028 (1.00) |
0.000284 (0.214) |
0.494 (1.00) |
| 19p loss |
0.758 (1.00) |
0.538 (1.00) |
0.454 (1.00) |
0.111 (1.00) |
0.435 (1.00) |
0.804 (1.00) |
0.78 (1.00) |
0.56 (1.00) |
0.682 (1.00) |
1 (1.00) |
| 19q loss |
0.957 (1.00) |
0.166 (1.00) |
0.598 (1.00) |
0.235 (1.00) |
0.501 (1.00) |
0.895 (1.00) |
0.683 (1.00) |
0.404 (1.00) |
0.934 (1.00) |
1 (1.00) |
| 20p loss |
0.39 (1.00) |
0.814 (1.00) |
0.304 (1.00) |
0.761 (1.00) |
0.408 (1.00) |
0.4 (1.00) |
0.818 (1.00) |
0.731 (1.00) |
0.594 (1.00) |
1 (1.00) |
| 21q loss |
0.35 (1.00) |
0.956 (1.00) |
0.00967 (1.00) |
0.403 (1.00) |
0.0127 (1.00) |
0.641 (1.00) |
0.08 (1.00) |
0.843 (1.00) |
0.21 (1.00) |
0.695 (1.00) |
| 22q loss |
0.143 (1.00) |
0.0712 (1.00) |
0.17 (1.00) |
0.262 (1.00) |
0.0024 (1.00) |
0.528 (1.00) |
0.0134 (1.00) |
0.243 (1.00) |
0.0536 (1.00) |
0.101 (1.00) |
| Xq loss |
0.386 (1.00) |
0.251 (1.00) |
0.151 (1.00) |
1 (1.00) |
0.314 (1.00) |
0.776 (1.00) |
0.279 (1.00) |
0.402 (1.00) |
0.54 (1.00) |
1 (1.00) |
Table S1. Get Full Table Description of clustering approach #1: '1p gain mutation analysis'
| Cluster Labels | 1P GAIN MUTATED | 1P GAIN WILD-TYPE |
|---|---|---|
| Number of samples | 15 | 560 |
Table S2. Get Full Table Description of clustering approach #2: '1q gain mutation analysis'
| Cluster Labels | 1Q GAIN MUTATED | 1Q GAIN WILD-TYPE |
|---|---|---|
| Number of samples | 80 | 495 |
Table S3. Get Full Table Description of clustering approach #3: '2p gain mutation analysis'
| Cluster Labels | 2P GAIN MUTATED | 2P GAIN WILD-TYPE |
|---|---|---|
| Number of samples | 60 | 515 |
Table S4. Get Full Table Description of clustering approach #4: '2q gain mutation analysis'
| Cluster Labels | 2Q GAIN MUTATED | 2Q GAIN WILD-TYPE |
|---|---|---|
| Number of samples | 59 | 516 |
Table S5. Get Full Table Description of clustering approach #5: '3p gain mutation analysis'
| Cluster Labels | 3P GAIN MUTATED | 3P GAIN WILD-TYPE |
|---|---|---|
| Number of samples | 36 | 539 |
Table S6. Get Full Table Description of clustering approach #6: '3q gain mutation analysis'
| Cluster Labels | 3Q GAIN MUTATED | 3Q GAIN WILD-TYPE |
|---|---|---|
| Number of samples | 53 | 522 |
P value = 0.000218 (logrank test), Q value = 0.17
Table S7. Clustering Approach #6: '3q gain mutation analysis' versus Clinical Feature #1: 'Time to Death'
| nPatients | nDeath | Duration Range (Median), Month | |
|---|---|---|---|
| ALL | 444 | 60 | 0.1 - 135.5 (7.0) |
| 3Q GAIN MUTATED | 38 | 10 | 0.2 - 60.0 (5.7) |
| 3Q GAIN WILD-TYPE | 406 | 50 | 0.1 - 135.5 (7.6) |
Figure S1. Get High-res Image Clustering Approach #6: '3q gain mutation analysis' versus Clinical Feature #1: 'Time to Death'
P value = 0.000283 (Chi-square test), Q value = 0.21
Table S8. Clustering Approach #6: '3q gain mutation analysis' versus Clinical Feature #8: 'PATHOLOGICSPREAD(M)'
| nPatients | M0 | M1 | M1A | M1B | MX |
|---|---|---|---|---|---|
| ALL | 435 | 71 | 9 | 1 | 49 |
| 3Q GAIN MUTATED | 32 | 8 | 3 | 1 | 8 |
| 3Q GAIN WILD-TYPE | 403 | 63 | 6 | 0 | 41 |
Figure S2. Get High-res Image Clustering Approach #6: '3q gain mutation analysis' versus Clinical Feature #8: 'PATHOLOGICSPREAD(M)'
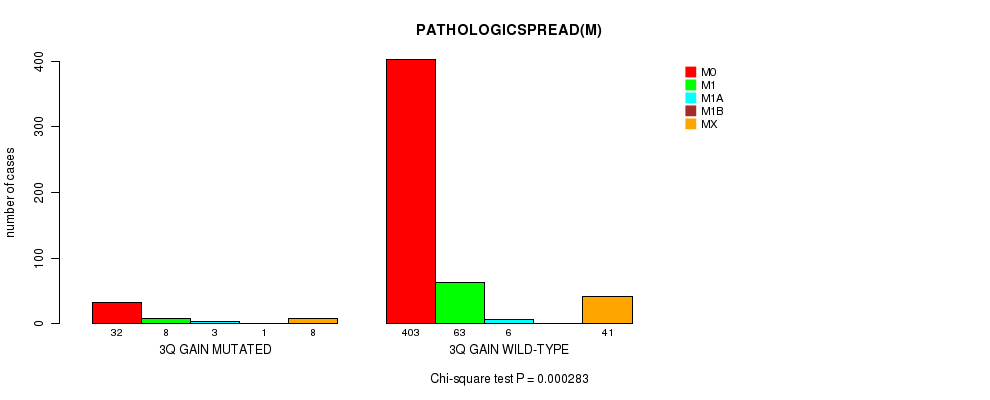
Table S9. Get Full Table Description of clustering approach #7: '4p gain mutation analysis'
| Cluster Labels | 4P GAIN MUTATED | 4P GAIN WILD-TYPE |
|---|---|---|
| Number of samples | 6 | 569 |
Table S10. Get Full Table Description of clustering approach #8: '4q gain mutation analysis'
| Cluster Labels | 4Q GAIN MUTATED | 4Q GAIN WILD-TYPE |
|---|---|---|
| Number of samples | 7 | 568 |
Table S11. Get Full Table Description of clustering approach #9: '5p gain mutation analysis'
| Cluster Labels | 5P GAIN MUTATED | 5P GAIN WILD-TYPE |
|---|---|---|
| Number of samples | 60 | 515 |
Table S12. Get Full Table Description of clustering approach #10: '5q gain mutation analysis'
| Cluster Labels | 5Q GAIN MUTATED | 5Q GAIN WILD-TYPE |
|---|---|---|
| Number of samples | 33 | 542 |
Table S13. Get Full Table Description of clustering approach #11: '6p gain mutation analysis'
| Cluster Labels | 6P GAIN MUTATED | 6P GAIN WILD-TYPE |
|---|---|---|
| Number of samples | 77 | 498 |
Table S14. Get Full Table Description of clustering approach #12: '6q gain mutation analysis'
| Cluster Labels | 6Q GAIN MUTATED | 6Q GAIN WILD-TYPE |
|---|---|---|
| Number of samples | 71 | 504 |
Table S15. Get Full Table Description of clustering approach #13: '7p gain mutation analysis'
| Cluster Labels | 7P GAIN MUTATED | 7P GAIN WILD-TYPE |
|---|---|---|
| Number of samples | 290 | 285 |
P value = 2.68e-05 (Chi-square test), Q value = 0.021
Table S16. Clustering Approach #13: '7p gain mutation analysis' versus Clinical Feature #5: 'HISTOLOGICAL.TYPE'
| nPatients | COLON ADENOCARCINOMA | COLON MUCINOUS ADENOCARCINOMA | RECTAL ADENOCARCINOMA | RECTAL MUCINOUS ADENOCARCINOMA |
|---|---|---|---|---|
| ALL | 356 | 54 | 143 | 13 |
| 7P GAIN MUTATED | 184 | 15 | 87 | 2 |
| 7P GAIN WILD-TYPE | 172 | 39 | 56 | 11 |
Figure S3. Get High-res Image Clustering Approach #13: '7p gain mutation analysis' versus Clinical Feature #5: 'HISTOLOGICAL.TYPE'
P value = 1.2e-05 (Chi-square test), Q value = 0.0093
Table S17. Clustering Approach #13: '7p gain mutation analysis' versus Clinical Feature #9: 'TUMOR.STAGE'
| nPatients | I | II | III | IV |
|---|---|---|---|---|
| ALL | 97 | 207 | 166 | 81 |
| 7P GAIN MUTATED | 46 | 78 | 99 | 52 |
| 7P GAIN WILD-TYPE | 51 | 129 | 67 | 29 |
Figure S4. Get High-res Image Clustering Approach #13: '7p gain mutation analysis' versus Clinical Feature #9: 'TUMOR.STAGE'
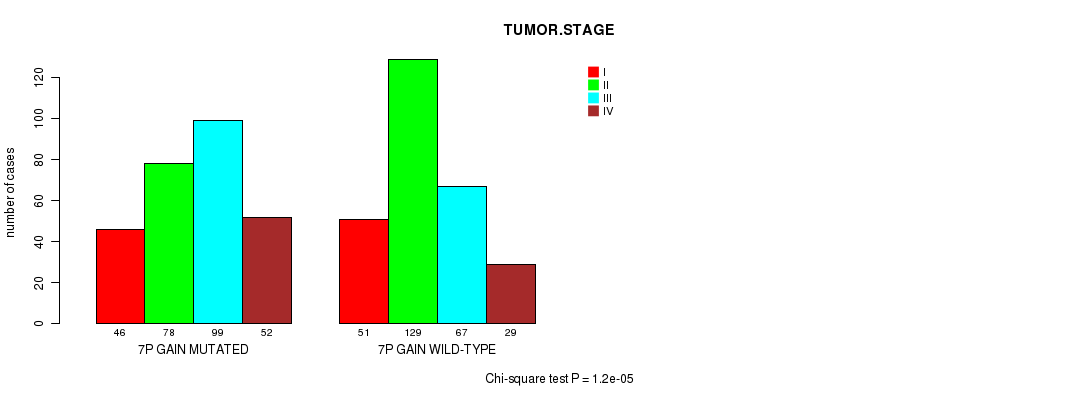
Table S18. Get Full Table Description of clustering approach #14: '7q gain mutation analysis'
| Cluster Labels | 7Q GAIN MUTATED | 7Q GAIN WILD-TYPE |
|---|---|---|
| Number of samples | 255 | 320 |
P value = 0.000188 (Chi-square test), Q value = 0.14
Table S19. Clustering Approach #14: '7q gain mutation analysis' versus Clinical Feature #5: 'HISTOLOGICAL.TYPE'
| nPatients | COLON ADENOCARCINOMA | COLON MUCINOUS ADENOCARCINOMA | RECTAL ADENOCARCINOMA | RECTAL MUCINOUS ADENOCARCINOMA |
|---|---|---|---|---|
| ALL | 356 | 54 | 143 | 13 |
| 7Q GAIN MUTATED | 161 | 14 | 77 | 1 |
| 7Q GAIN WILD-TYPE | 195 | 40 | 66 | 12 |
Figure S5. Get High-res Image Clustering Approach #14: '7q gain mutation analysis' versus Clinical Feature #5: 'HISTOLOGICAL.TYPE'
P value = 5.86e-05 (Chi-square test), Q value = 0.045
Table S20. Clustering Approach #14: '7q gain mutation analysis' versus Clinical Feature #9: 'TUMOR.STAGE'
| nPatients | I | II | III | IV |
|---|---|---|---|---|
| ALL | 97 | 207 | 166 | 81 |
| 7Q GAIN MUTATED | 42 | 67 | 88 | 46 |
| 7Q GAIN WILD-TYPE | 55 | 140 | 78 | 35 |
Figure S6. Get High-res Image Clustering Approach #14: '7q gain mutation analysis' versus Clinical Feature #9: 'TUMOR.STAGE'
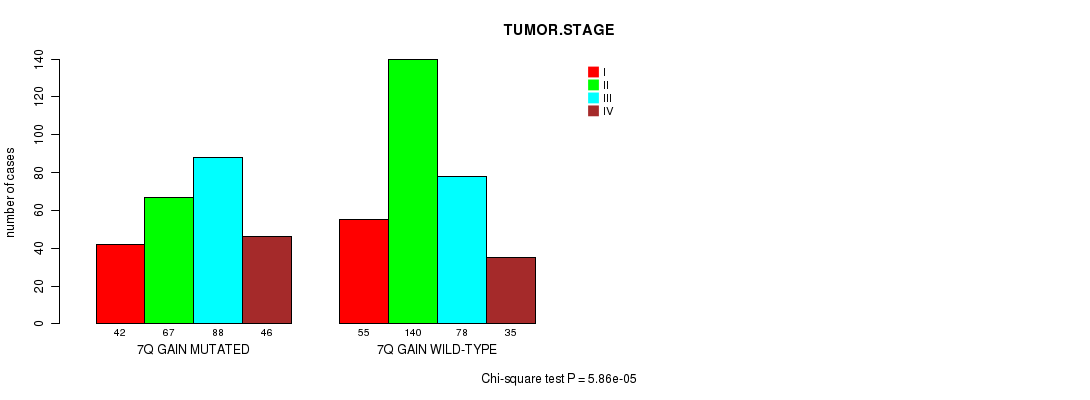
Table S21. Get Full Table Description of clustering approach #15: '8p gain mutation analysis'
| Cluster Labels | 8P GAIN MUTATED | 8P GAIN WILD-TYPE |
|---|---|---|
| Number of samples | 108 | 467 |
Table S22. Get Full Table Description of clustering approach #16: '8q gain mutation analysis'
| Cluster Labels | 8Q GAIN MUTATED | 8Q GAIN WILD-TYPE |
|---|---|---|
| Number of samples | 235 | 340 |
Table S23. Get Full Table Description of clustering approach #17: '9p gain mutation analysis'
| Cluster Labels | 9P GAIN MUTATED | 9P GAIN WILD-TYPE |
|---|---|---|
| Number of samples | 79 | 496 |
Table S24. Get Full Table Description of clustering approach #18: '9q gain mutation analysis'
| Cluster Labels | 9Q GAIN MUTATED | 9Q GAIN WILD-TYPE |
|---|---|---|
| Number of samples | 64 | 511 |
Table S25. Get Full Table Description of clustering approach #19: '10p gain mutation analysis'
| Cluster Labels | 10P GAIN MUTATED | 10P GAIN WILD-TYPE |
|---|---|---|
| Number of samples | 28 | 547 |
Table S26. Get Full Table Description of clustering approach #20: '10q gain mutation analysis'
| Cluster Labels | 10Q GAIN MUTATED | 10Q GAIN WILD-TYPE |
|---|---|---|
| Number of samples | 13 | 562 |
Table S27. Get Full Table Description of clustering approach #21: '11p gain mutation analysis'
| Cluster Labels | 11P GAIN MUTATED | 11P GAIN WILD-TYPE |
|---|---|---|
| Number of samples | 39 | 536 |
P value = 0.000142 (Chi-square test), Q value = 0.11
Table S28. Clustering Approach #21: '11p gain mutation analysis' versus Clinical Feature #5: 'HISTOLOGICAL.TYPE'
| nPatients | COLON ADENOCARCINOMA | COLON MUCINOUS ADENOCARCINOMA | RECTAL ADENOCARCINOMA | RECTAL MUCINOUS ADENOCARCINOMA |
|---|---|---|---|---|
| ALL | 356 | 54 | 143 | 13 |
| 11P GAIN MUTATED | 18 | 0 | 21 | 0 |
| 11P GAIN WILD-TYPE | 338 | 54 | 122 | 13 |
Figure S7. Get High-res Image Clustering Approach #21: '11p gain mutation analysis' versus Clinical Feature #5: 'HISTOLOGICAL.TYPE'
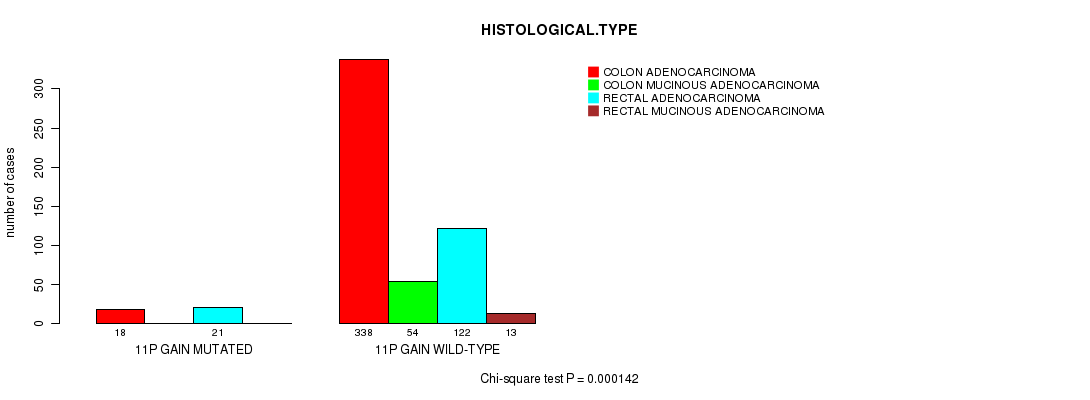
Table S29. Get Full Table Description of clustering approach #22: '11q gain mutation analysis'
| Cluster Labels | 11Q GAIN MUTATED | 11Q GAIN WILD-TYPE |
|---|---|---|
| Number of samples | 39 | 536 |
Table S30. Get Full Table Description of clustering approach #23: '12p gain mutation analysis'
| Cluster Labels | 12P GAIN MUTATED | 12P GAIN WILD-TYPE |
|---|---|---|
| Number of samples | 93 | 482 |
Table S31. Get Full Table Description of clustering approach #24: '12q gain mutation analysis'
| Cluster Labels | 12Q GAIN MUTATED | 12Q GAIN WILD-TYPE |
|---|---|---|
| Number of samples | 78 | 497 |
Table S32. Get Full Table Description of clustering approach #25: '13q gain mutation analysis'
| Cluster Labels | 13Q GAIN MUTATED | 13Q GAIN WILD-TYPE |
|---|---|---|
| Number of samples | 314 | 261 |
P value = 9.64e-09 (Chi-square test), Q value = 7.5e-06
Table S33. Clustering Approach #25: '13q gain mutation analysis' versus Clinical Feature #5: 'HISTOLOGICAL.TYPE'
| nPatients | COLON ADENOCARCINOMA | COLON MUCINOUS ADENOCARCINOMA | RECTAL ADENOCARCINOMA | RECTAL MUCINOUS ADENOCARCINOMA |
|---|---|---|---|---|
| ALL | 356 | 54 | 143 | 13 |
| 13Q GAIN MUTATED | 199 | 12 | 96 | 2 |
| 13Q GAIN WILD-TYPE | 157 | 42 | 47 | 11 |
Figure S8. Get High-res Image Clustering Approach #25: '13q gain mutation analysis' versus Clinical Feature #5: 'HISTOLOGICAL.TYPE'
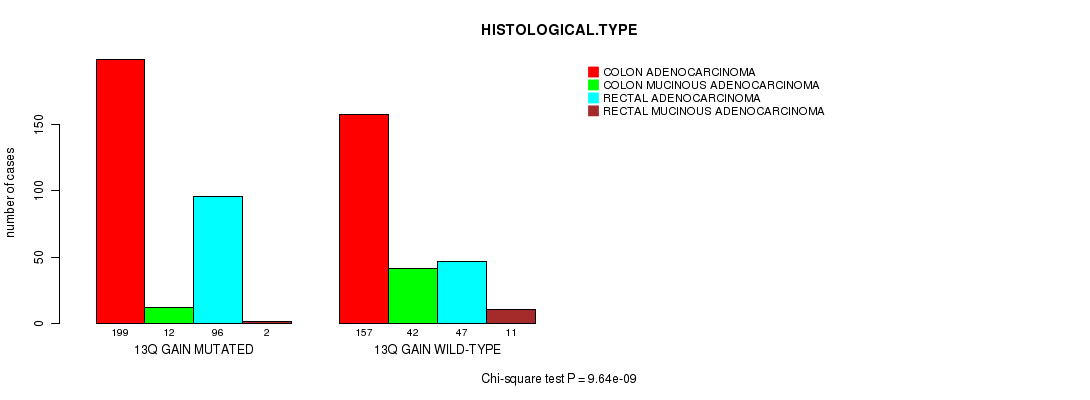
Table S34. Get Full Table Description of clustering approach #26: '14q gain mutation analysis'
| Cluster Labels | 14Q GAIN MUTATED | 14Q GAIN WILD-TYPE |
|---|---|---|
| Number of samples | 19 | 556 |
Table S35. Get Full Table Description of clustering approach #27: '15q gain mutation analysis'
| Cluster Labels | 15Q GAIN MUTATED | 15Q GAIN WILD-TYPE |
|---|---|---|
| Number of samples | 7 | 568 |
Table S36. Get Full Table Description of clustering approach #28: '16p gain mutation analysis'
| Cluster Labels | 16P GAIN MUTATED | 16P GAIN WILD-TYPE |
|---|---|---|
| Number of samples | 96 | 479 |
Table S37. Get Full Table Description of clustering approach #29: '16q gain mutation analysis'
| Cluster Labels | 16Q GAIN MUTATED | 16Q GAIN WILD-TYPE |
|---|---|---|
| Number of samples | 96 | 479 |
P value = 0.000263 (Chi-square test), Q value = 0.2
Table S38. Clustering Approach #29: '16q gain mutation analysis' versus Clinical Feature #9: 'TUMOR.STAGE'
| nPatients | I | II | III | IV |
|---|---|---|---|---|
| ALL | 97 | 207 | 166 | 81 |
| 16Q GAIN MUTATED | 9 | 23 | 43 | 13 |
| 16Q GAIN WILD-TYPE | 88 | 184 | 123 | 68 |
Figure S9. Get High-res Image Clustering Approach #29: '16q gain mutation analysis' versus Clinical Feature #9: 'TUMOR.STAGE'
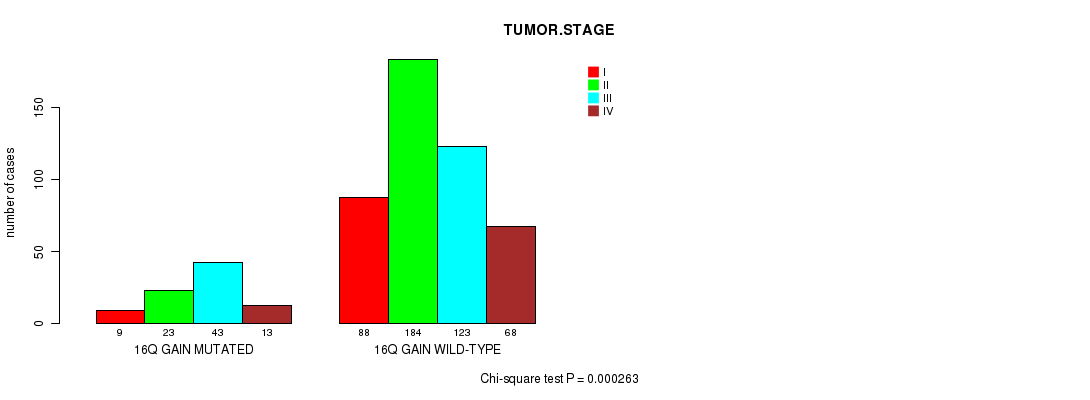
Table S39. Get Full Table Description of clustering approach #30: '17p gain mutation analysis'
| Cluster Labels | 17P GAIN MUTATED | 17P GAIN WILD-TYPE |
|---|---|---|
| Number of samples | 13 | 562 |
Table S40. Get Full Table Description of clustering approach #31: '17q gain mutation analysis'
| Cluster Labels | 17Q GAIN MUTATED | 17Q GAIN WILD-TYPE |
|---|---|---|
| Number of samples | 67 | 508 |
Table S41. Get Full Table Description of clustering approach #32: '18p gain mutation analysis'
| Cluster Labels | 18P GAIN MUTATED | 18P GAIN WILD-TYPE |
|---|---|---|
| Number of samples | 21 | 554 |
P value = 1.41e-05 (Chi-square test), Q value = 0.011
Table S42. Clustering Approach #32: '18p gain mutation analysis' versus Clinical Feature #8: 'PATHOLOGICSPREAD(M)'
| nPatients | M0 | M1 | M1A | M1B | MX |
|---|---|---|---|---|---|
| ALL | 435 | 71 | 9 | 1 | 49 |
| 18P GAIN MUTATED | 15 | 2 | 0 | 1 | 2 |
| 18P GAIN WILD-TYPE | 420 | 69 | 9 | 0 | 47 |
Figure S10. Get High-res Image Clustering Approach #32: '18p gain mutation analysis' versus Clinical Feature #8: 'PATHOLOGICSPREAD(M)'
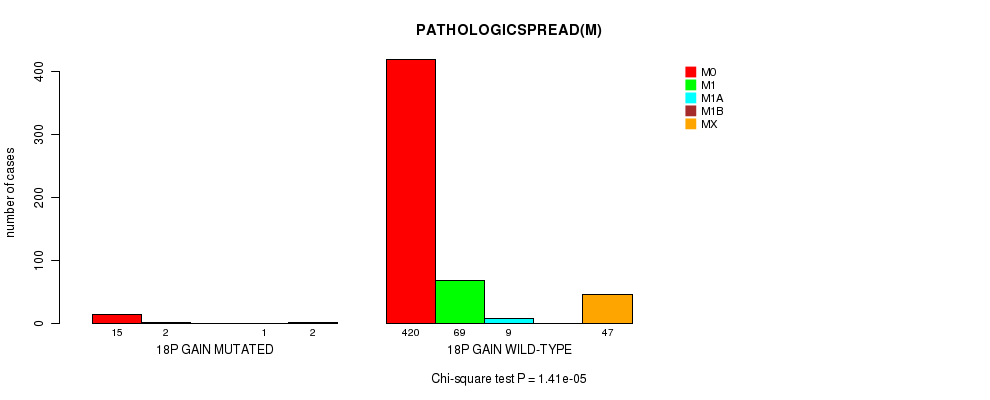
Table S43. Get Full Table Description of clustering approach #33: '18q gain mutation analysis'
| Cluster Labels | 18Q GAIN MUTATED | 18Q GAIN WILD-TYPE |
|---|---|---|
| Number of samples | 12 | 563 |
Table S44. Get Full Table Description of clustering approach #34: '19p gain mutation analysis'
| Cluster Labels | 19P GAIN MUTATED | 19P GAIN WILD-TYPE |
|---|---|---|
| Number of samples | 52 | 523 |
Table S45. Get Full Table Description of clustering approach #35: '19q gain mutation analysis'
| Cluster Labels | 19Q GAIN MUTATED | 19Q GAIN WILD-TYPE |
|---|---|---|
| Number of samples | 61 | 514 |
Table S46. Get Full Table Description of clustering approach #36: '20p gain mutation analysis'
| Cluster Labels | 20P GAIN MUTATED | 20P GAIN WILD-TYPE |
|---|---|---|
| Number of samples | 288 | 287 |
P value = 2.61e-08 (Chi-square test), Q value = 2e-05
Table S47. Clustering Approach #36: '20p gain mutation analysis' versus Clinical Feature #5: 'HISTOLOGICAL.TYPE'
| nPatients | COLON ADENOCARCINOMA | COLON MUCINOUS ADENOCARCINOMA | RECTAL ADENOCARCINOMA | RECTAL MUCINOUS ADENOCARCINOMA |
|---|---|---|---|---|
| ALL | 356 | 54 | 143 | 13 |
| 20P GAIN MUTATED | 176 | 11 | 93 | 2 |
| 20P GAIN WILD-TYPE | 180 | 43 | 50 | 11 |
Figure S11. Get High-res Image Clustering Approach #36: '20p gain mutation analysis' versus Clinical Feature #5: 'HISTOLOGICAL.TYPE'
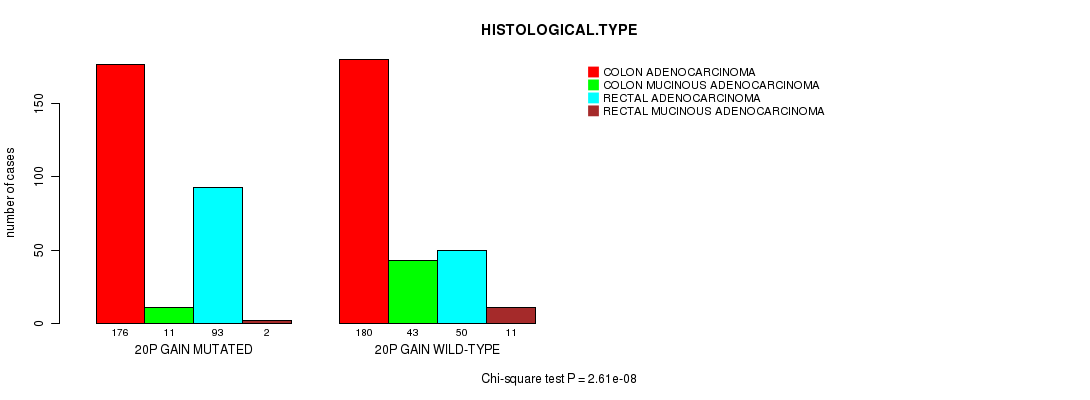
Table S48. Get Full Table Description of clustering approach #37: '20q gain mutation analysis'
| Cluster Labels | 20Q GAIN MUTATED | 20Q GAIN WILD-TYPE |
|---|---|---|
| Number of samples | 403 | 172 |
P value = 4.38e-05 (Fisher's exact test), Q value = 0.034
Table S49. Clustering Approach #37: '20q gain mutation analysis' versus Clinical Feature #3: 'PRIMARY.SITE.OF.DISEASE'
| nPatients | COLON | RECTUM |
|---|---|---|
| ALL | 412 | 159 |
| 20Q GAIN MUTATED | 269 | 131 |
| 20Q GAIN WILD-TYPE | 143 | 28 |
Figure S12. Get High-res Image Clustering Approach #37: '20q gain mutation analysis' versus Clinical Feature #3: 'PRIMARY.SITE.OF.DISEASE'
P value = 1.53e-15 (Chi-square test), Q value = 1.2e-12
Table S50. Clustering Approach #37: '20q gain mutation analysis' versus Clinical Feature #5: 'HISTOLOGICAL.TYPE'
| nPatients | COLON ADENOCARCINOMA | COLON MUCINOUS ADENOCARCINOMA | RECTAL ADENOCARCINOMA | RECTAL MUCINOUS ADENOCARCINOMA |
|---|---|---|---|---|
| ALL | 356 | 54 | 143 | 13 |
| 20Q GAIN MUTATED | 251 | 16 | 125 | 4 |
| 20Q GAIN WILD-TYPE | 105 | 38 | 18 | 9 |
Figure S13. Get High-res Image Clustering Approach #37: '20q gain mutation analysis' versus Clinical Feature #5: 'HISTOLOGICAL.TYPE'
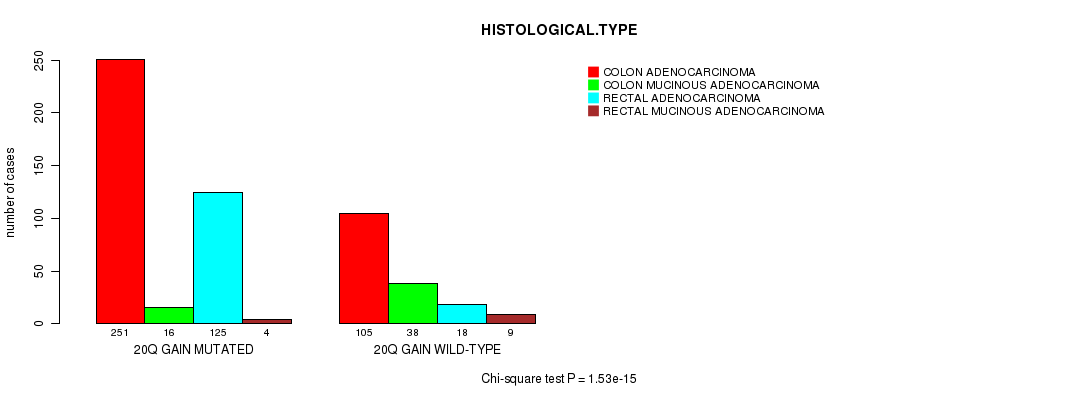
Table S51. Get Full Table Description of clustering approach #38: '21q gain mutation analysis'
| Cluster Labels | 21Q GAIN MUTATED | 21Q GAIN WILD-TYPE |
|---|---|---|
| Number of samples | 19 | 556 |
Table S52. Get Full Table Description of clustering approach #39: '22q gain mutation analysis'
| Cluster Labels | 22Q GAIN MUTATED | 22Q GAIN WILD-TYPE |
|---|---|---|
| Number of samples | 7 | 568 |
Table S53. Get Full Table Description of clustering approach #40: 'Xq gain mutation analysis'
| Cluster Labels | XQ GAIN MUTATED | XQ GAIN WILD-TYPE |
|---|---|---|
| Number of samples | 17 | 558 |
P value = 1.67e-07 (Chi-square test), Q value = 0.00013
Table S54. Clustering Approach #40: 'Xq gain mutation analysis' versus Clinical Feature #8: 'PATHOLOGICSPREAD(M)'
| nPatients | M0 | M1 | M1A | M1B | MX |
|---|---|---|---|---|---|
| ALL | 435 | 71 | 9 | 1 | 49 |
| XQ GAIN MUTATED | 10 | 4 | 0 | 1 | 1 |
| XQ GAIN WILD-TYPE | 425 | 67 | 9 | 0 | 48 |
Figure S14. Get High-res Image Clustering Approach #40: 'Xq gain mutation analysis' versus Clinical Feature #8: 'PATHOLOGICSPREAD(M)'
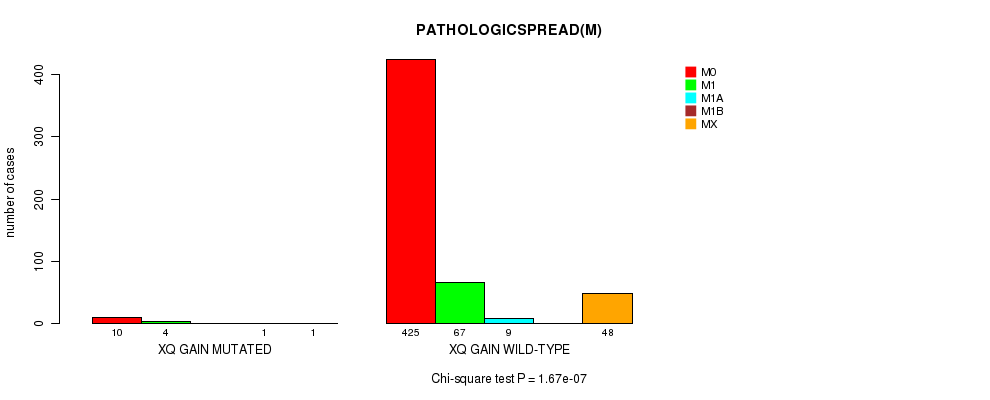
Table S55. Get Full Table Description of clustering approach #41: '1p loss mutation analysis'
| Cluster Labels | 1P LOSS MUTATED | 1P LOSS WILD-TYPE |
|---|---|---|
| Number of samples | 68 | 507 |
Table S56. Get Full Table Description of clustering approach #42: '1q loss mutation analysis'
| Cluster Labels | 1Q LOSS MUTATED | 1Q LOSS WILD-TYPE |
|---|---|---|
| Number of samples | 25 | 550 |
Table S57. Get Full Table Description of clustering approach #43: '2p loss mutation analysis'
| Cluster Labels | 2P LOSS MUTATED | 2P LOSS WILD-TYPE |
|---|---|---|
| Number of samples | 10 | 565 |
Table S58. Get Full Table Description of clustering approach #44: '2q loss mutation analysis'
| Cluster Labels | 2Q LOSS MUTATED | 2Q LOSS WILD-TYPE |
|---|---|---|
| Number of samples | 8 | 567 |
P value = 3.78e-07 (logrank test), Q value = 0.00029
Table S59. Clustering Approach #44: '2q loss mutation analysis' versus Clinical Feature #1: 'Time to Death'
| nPatients | nDeath | Duration Range (Median), Month | |
|---|---|---|---|
| ALL | 444 | 60 | 0.1 - 135.5 (7.0) |
| 2Q LOSS MUTATED | 5 | 1 | 0.3 - 1.0 (1.0) |
| 2Q LOSS WILD-TYPE | 439 | 59 | 0.1 - 135.5 (7.3) |
Figure S15. Get High-res Image Clustering Approach #44: '2q loss mutation analysis' versus Clinical Feature #1: 'Time to Death'
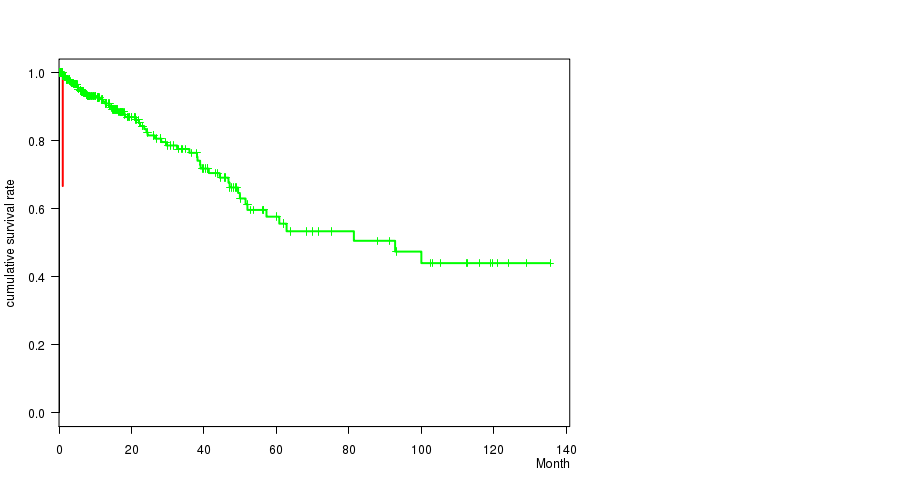
Table S60. Get Full Table Description of clustering approach #45: '3p loss mutation analysis'
| Cluster Labels | 3P LOSS MUTATED | 3P LOSS WILD-TYPE |
|---|---|---|
| Number of samples | 35 | 540 |
P value = 3.17e-05 (logrank test), Q value = 0.024
Table S61. Clustering Approach #45: '3p loss mutation analysis' versus Clinical Feature #1: 'Time to Death'
| nPatients | nDeath | Duration Range (Median), Month | |
|---|---|---|---|
| ALL | 444 | 60 | 0.1 - 135.5 (7.0) |
| 3P LOSS MUTATED | 21 | 5 | 0.3 - 14.5 (4.0) |
| 3P LOSS WILD-TYPE | 423 | 55 | 0.1 - 135.5 (7.3) |
Figure S16. Get High-res Image Clustering Approach #45: '3p loss mutation analysis' versus Clinical Feature #1: 'Time to Death'
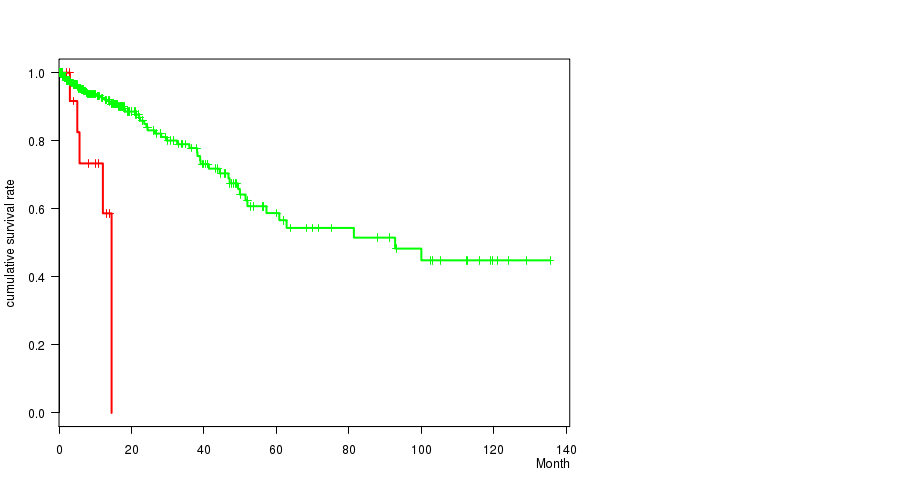
Table S62. Get Full Table Description of clustering approach #46: '3q loss mutation analysis'
| Cluster Labels | 3Q LOSS MUTATED | 3Q LOSS WILD-TYPE |
|---|---|---|
| Number of samples | 17 | 558 |
P value = 4.51e-05 (Chi-square test), Q value = 0.034
Table S63. Clustering Approach #46: '3q loss mutation analysis' versus Clinical Feature #5: 'HISTOLOGICAL.TYPE'
| nPatients | COLON ADENOCARCINOMA | COLON MUCINOUS ADENOCARCINOMA | RECTAL ADENOCARCINOMA | RECTAL MUCINOUS ADENOCARCINOMA |
|---|---|---|---|---|
| ALL | 356 | 54 | 143 | 13 |
| 3Q LOSS MUTATED | 13 | 0 | 1 | 3 |
| 3Q LOSS WILD-TYPE | 343 | 54 | 142 | 10 |
Figure S17. Get High-res Image Clustering Approach #46: '3q loss mutation analysis' versus Clinical Feature #5: 'HISTOLOGICAL.TYPE'
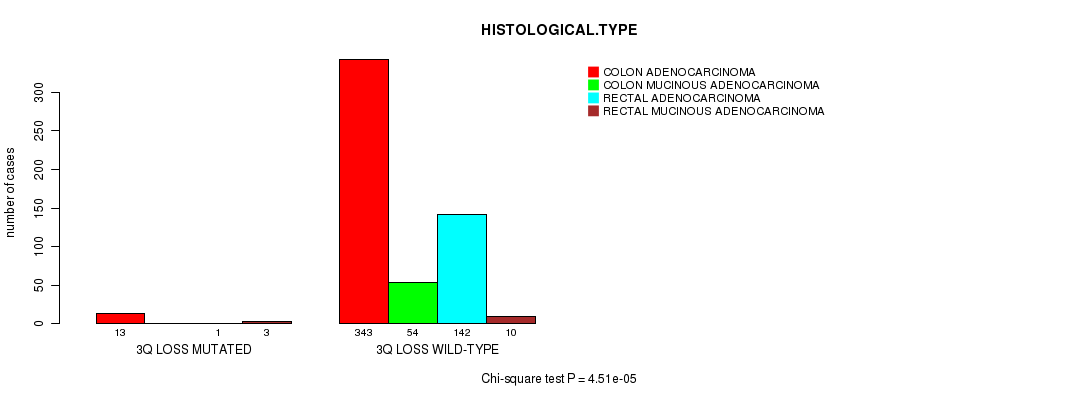
Table S64. Get Full Table Description of clustering approach #47: '4p loss mutation analysis'
| Cluster Labels | 4P LOSS MUTATED | 4P LOSS WILD-TYPE |
|---|---|---|
| Number of samples | 122 | 453 |
Table S65. Get Full Table Description of clustering approach #48: '4q loss mutation analysis'
| Cluster Labels | 4Q LOSS MUTATED | 4Q LOSS WILD-TYPE |
|---|---|---|
| Number of samples | 113 | 462 |
Table S66. Get Full Table Description of clustering approach #49: '5p loss mutation analysis'
| Cluster Labels | 5P LOSS MUTATED | 5P LOSS WILD-TYPE |
|---|---|---|
| Number of samples | 34 | 541 |
Table S67. Get Full Table Description of clustering approach #50: '5q loss mutation analysis'
| Cluster Labels | 5Q LOSS MUTATED | 5Q LOSS WILD-TYPE |
|---|---|---|
| Number of samples | 60 | 515 |
Table S68. Get Full Table Description of clustering approach #51: '6p loss mutation analysis'
| Cluster Labels | 6P LOSS MUTATED | 6P LOSS WILD-TYPE |
|---|---|---|
| Number of samples | 18 | 557 |
Table S69. Get Full Table Description of clustering approach #52: '6q loss mutation analysis'
| Cluster Labels | 6Q LOSS MUTATED | 6Q LOSS WILD-TYPE |
|---|---|---|
| Number of samples | 33 | 542 |
Table S70. Get Full Table Description of clustering approach #53: '7q loss mutation analysis'
| Cluster Labels | 7Q LOSS MUTATED | 7Q LOSS WILD-TYPE |
|---|---|---|
| Number of samples | 3 | 572 |
Table S71. Get Full Table Description of clustering approach #54: '8p loss mutation analysis'
| Cluster Labels | 8P LOSS MUTATED | 8P LOSS WILD-TYPE |
|---|---|---|
| Number of samples | 145 | 430 |
Table S72. Get Full Table Description of clustering approach #55: '8q loss mutation analysis'
| Cluster Labels | 8Q LOSS MUTATED | 8Q LOSS WILD-TYPE |
|---|---|---|
| Number of samples | 12 | 563 |
Table S73. Get Full Table Description of clustering approach #56: '9p loss mutation analysis'
| Cluster Labels | 9P LOSS MUTATED | 9P LOSS WILD-TYPE |
|---|---|---|
| Number of samples | 39 | 536 |
Table S74. Get Full Table Description of clustering approach #57: '9q loss mutation analysis'
| Cluster Labels | 9Q LOSS MUTATED | 9Q LOSS WILD-TYPE |
|---|---|---|
| Number of samples | 37 | 538 |
Table S75. Get Full Table Description of clustering approach #58: '10p loss mutation analysis'
| Cluster Labels | 10P LOSS MUTATED | 10P LOSS WILD-TYPE |
|---|---|---|
| Number of samples | 40 | 535 |
Table S76. Get Full Table Description of clustering approach #59: '10q loss mutation analysis'
| Cluster Labels | 10Q LOSS MUTATED | 10Q LOSS WILD-TYPE |
|---|---|---|
| Number of samples | 46 | 529 |
Table S77. Get Full Table Description of clustering approach #60: '11p loss mutation analysis'
| Cluster Labels | 11P LOSS MUTATED | 11P LOSS WILD-TYPE |
|---|---|---|
| Number of samples | 40 | 535 |
Table S78. Get Full Table Description of clustering approach #61: '11q loss mutation analysis'
| Cluster Labels | 11Q LOSS MUTATED | 11Q LOSS WILD-TYPE |
|---|---|---|
| Number of samples | 51 | 524 |
P value = 0.000277 (Chi-square test), Q value = 0.21
Table S79. Clustering Approach #61: '11q loss mutation analysis' versus Clinical Feature #5: 'HISTOLOGICAL.TYPE'
| nPatients | COLON ADENOCARCINOMA | COLON MUCINOUS ADENOCARCINOMA | RECTAL ADENOCARCINOMA | RECTAL MUCINOUS ADENOCARCINOMA |
|---|---|---|---|---|
| ALL | 356 | 54 | 143 | 13 |
| 11Q LOSS MUTATED | 25 | 2 | 16 | 5 |
| 11Q LOSS WILD-TYPE | 331 | 52 | 127 | 8 |
Figure S18. Get High-res Image Clustering Approach #61: '11q loss mutation analysis' versus Clinical Feature #5: 'HISTOLOGICAL.TYPE'
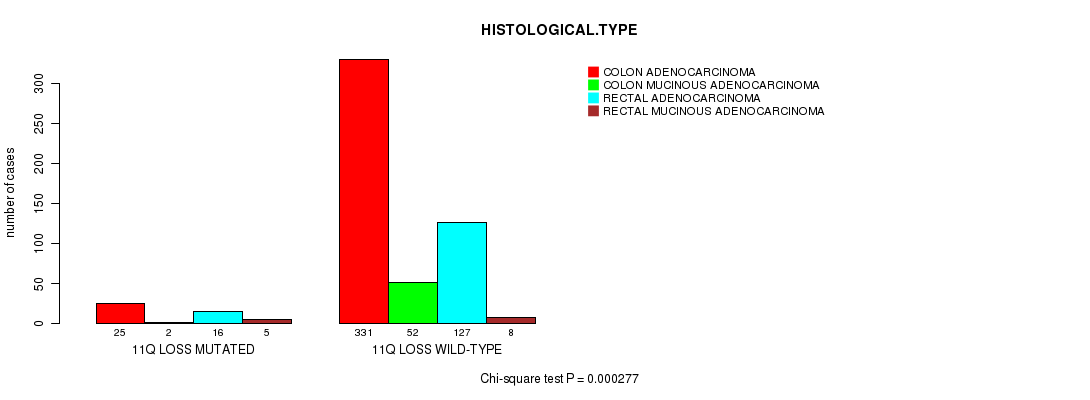
Table S80. Get Full Table Description of clustering approach #62: '12p loss mutation analysis'
| Cluster Labels | 12P LOSS MUTATED | 12P LOSS WILD-TYPE |
|---|---|---|
| Number of samples | 33 | 542 |
Table S81. Get Full Table Description of clustering approach #63: '12q loss mutation analysis'
| Cluster Labels | 12Q LOSS MUTATED | 12Q LOSS WILD-TYPE |
|---|---|---|
| Number of samples | 28 | 547 |
Table S82. Get Full Table Description of clustering approach #64: '13q loss mutation analysis'
| Cluster Labels | 13Q LOSS MUTATED | 13Q LOSS WILD-TYPE |
|---|---|---|
| Number of samples | 12 | 563 |
Table S83. Get Full Table Description of clustering approach #65: '14q loss mutation analysis'
| Cluster Labels | 14Q LOSS MUTATED | 14Q LOSS WILD-TYPE |
|---|---|---|
| Number of samples | 143 | 432 |
P value = 0.000111 (Chi-square test), Q value = 0.085
Table S84. Clustering Approach #65: '14q loss mutation analysis' versus Clinical Feature #5: 'HISTOLOGICAL.TYPE'
| nPatients | COLON ADENOCARCINOMA | COLON MUCINOUS ADENOCARCINOMA | RECTAL ADENOCARCINOMA | RECTAL MUCINOUS ADENOCARCINOMA |
|---|---|---|---|---|
| ALL | 356 | 54 | 143 | 13 |
| 14Q LOSS MUTATED | 90 | 3 | 48 | 0 |
| 14Q LOSS WILD-TYPE | 266 | 51 | 95 | 13 |
Figure S19. Get High-res Image Clustering Approach #65: '14q loss mutation analysis' versus Clinical Feature #5: 'HISTOLOGICAL.TYPE'
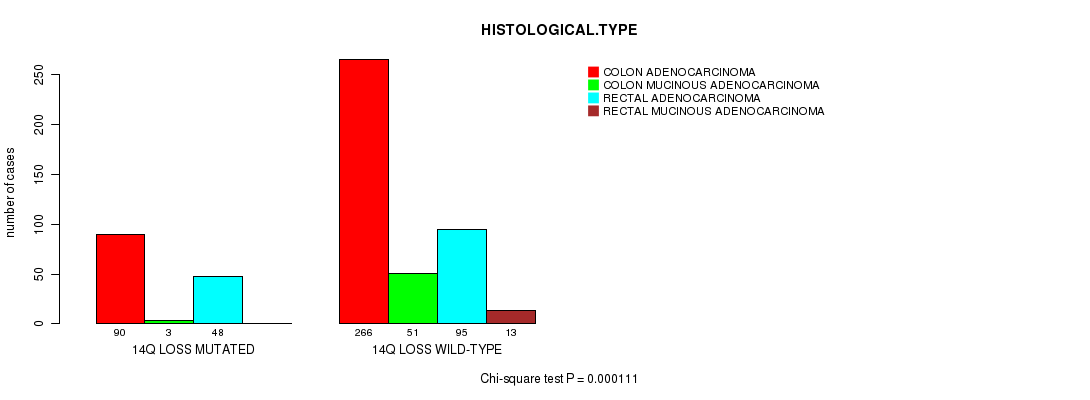
Table S85. Get Full Table Description of clustering approach #66: '15q loss mutation analysis'
| Cluster Labels | 15Q LOSS MUTATED | 15Q LOSS WILD-TYPE |
|---|---|---|
| Number of samples | 156 | 419 |
Table S86. Get Full Table Description of clustering approach #67: '16p loss mutation analysis'
| Cluster Labels | 16P LOSS MUTATED | 16P LOSS WILD-TYPE |
|---|---|---|
| Number of samples | 15 | 560 |
Table S87. Get Full Table Description of clustering approach #68: '16q loss mutation analysis'
| Cluster Labels | 16Q LOSS MUTATED | 16Q LOSS WILD-TYPE |
|---|---|---|
| Number of samples | 17 | 558 |
Table S88. Get Full Table Description of clustering approach #69: '17p loss mutation analysis'
| Cluster Labels | 17P LOSS MUTATED | 17P LOSS WILD-TYPE |
|---|---|---|
| Number of samples | 252 | 323 |
P value = 2.86e-06 (Chi-square test), Q value = 0.0022
Table S89. Clustering Approach #69: '17p loss mutation analysis' versus Clinical Feature #5: 'HISTOLOGICAL.TYPE'
| nPatients | COLON ADENOCARCINOMA | COLON MUCINOUS ADENOCARCINOMA | RECTAL ADENOCARCINOMA | RECTAL MUCINOUS ADENOCARCINOMA |
|---|---|---|---|---|
| ALL | 356 | 54 | 143 | 13 |
| 17P LOSS MUTATED | 156 | 7 | 79 | 6 |
| 17P LOSS WILD-TYPE | 200 | 47 | 64 | 7 |
Figure S20. Get High-res Image Clustering Approach #69: '17p loss mutation analysis' versus Clinical Feature #5: 'HISTOLOGICAL.TYPE'
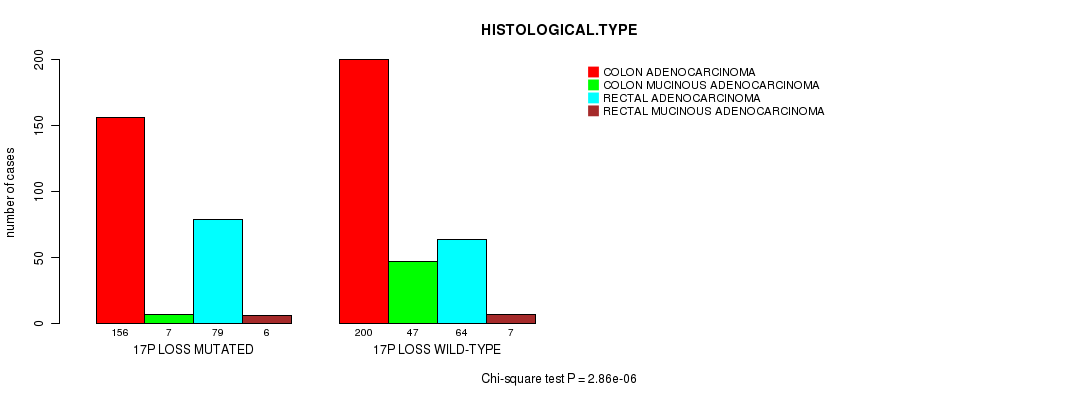
Table S90. Get Full Table Description of clustering approach #70: '17q loss mutation analysis'
| Cluster Labels | 17Q LOSS MUTATED | 17Q LOSS WILD-TYPE |
|---|---|---|
| Number of samples | 45 | 530 |
Table S91. Get Full Table Description of clustering approach #71: '18p loss mutation analysis'
| Cluster Labels | 18P LOSS MUTATED | 18P LOSS WILD-TYPE |
|---|---|---|
| Number of samples | 324 | 251 |
P value = 2.12e-05 (Fisher's exact test), Q value = 0.016
Table S92. Clustering Approach #71: '18p loss mutation analysis' versus Clinical Feature #3: 'PRIMARY.SITE.OF.DISEASE'
| nPatients | COLON | RECTUM |
|---|---|---|
| ALL | 412 | 159 |
| 18P LOSS MUTATED | 209 | 112 |
| 18P LOSS WILD-TYPE | 203 | 47 |
Figure S21. Get High-res Image Clustering Approach #71: '18p loss mutation analysis' versus Clinical Feature #3: 'PRIMARY.SITE.OF.DISEASE'
P value = 1.4e-13 (Chi-square test), Q value = 1.1e-10
Table S93. Clustering Approach #71: '18p loss mutation analysis' versus Clinical Feature #5: 'HISTOLOGICAL.TYPE'
| nPatients | COLON ADENOCARCINOMA | COLON MUCINOUS ADENOCARCINOMA | RECTAL ADENOCARCINOMA | RECTAL MUCINOUS ADENOCARCINOMA |
|---|---|---|---|---|
| ALL | 356 | 54 | 143 | 13 |
| 18P LOSS MUTATED | 201 | 7 | 107 | 5 |
| 18P LOSS WILD-TYPE | 155 | 47 | 36 | 8 |
Figure S22. Get High-res Image Clustering Approach #71: '18p loss mutation analysis' versus Clinical Feature #5: 'HISTOLOGICAL.TYPE'
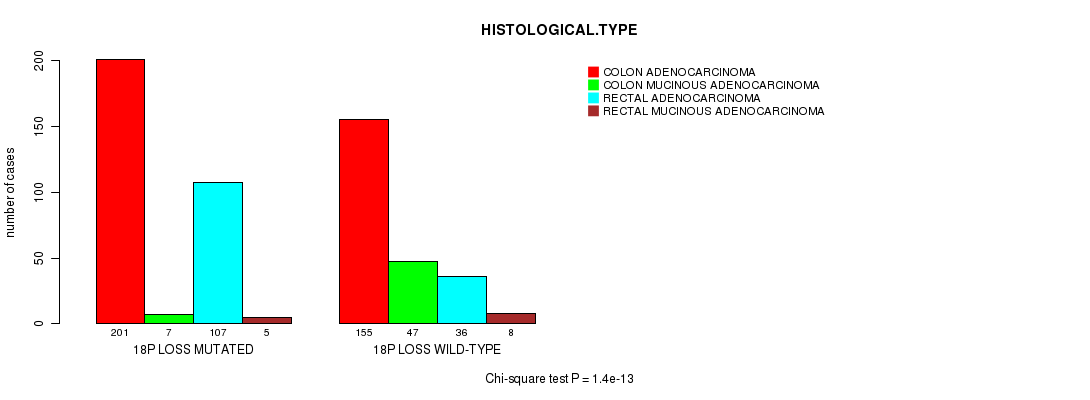
Table S94. Get Full Table Description of clustering approach #72: '18q loss mutation analysis'
| Cluster Labels | 18Q LOSS MUTATED | 18Q LOSS WILD-TYPE |
|---|---|---|
| Number of samples | 352 | 223 |
P value = 1.89e-07 (Fisher's exact test), Q value = 0.00015
Table S95. Clustering Approach #72: '18q loss mutation analysis' versus Clinical Feature #3: 'PRIMARY.SITE.OF.DISEASE'
| nPatients | COLON | RECTUM |
|---|---|---|
| ALL | 412 | 159 |
| 18Q LOSS MUTATED | 225 | 124 |
| 18Q LOSS WILD-TYPE | 187 | 35 |
Figure S23. Get High-res Image Clustering Approach #72: '18q loss mutation analysis' versus Clinical Feature #3: 'PRIMARY.SITE.OF.DISEASE'
P value = 1.58e-13 (Chi-square test), Q value = 1.2e-10
Table S96. Clustering Approach #72: '18q loss mutation analysis' versus Clinical Feature #5: 'HISTOLOGICAL.TYPE'
| nPatients | COLON ADENOCARCINOMA | COLON MUCINOUS ADENOCARCINOMA | RECTAL ADENOCARCINOMA | RECTAL MUCINOUS ADENOCARCINOMA |
|---|---|---|---|---|
| ALL | 356 | 54 | 143 | 13 |
| 18Q LOSS MUTATED | 214 | 10 | 114 | 9 |
| 18Q LOSS WILD-TYPE | 142 | 44 | 29 | 4 |
Figure S24. Get High-res Image Clustering Approach #72: '18q loss mutation analysis' versus Clinical Feature #5: 'HISTOLOGICAL.TYPE'
P value = 0.000284 (Chi-square test), Q value = 0.21
Table S97. Clustering Approach #72: '18q loss mutation analysis' versus Clinical Feature #9: 'TUMOR.STAGE'
| nPatients | I | II | III | IV |
|---|---|---|---|---|
| ALL | 97 | 207 | 166 | 81 |
| 18Q LOSS MUTATED | 50 | 112 | 112 | 62 |
| 18Q LOSS WILD-TYPE | 47 | 95 | 54 | 19 |
Figure S25. Get High-res Image Clustering Approach #72: '18q loss mutation analysis' versus Clinical Feature #9: 'TUMOR.STAGE'
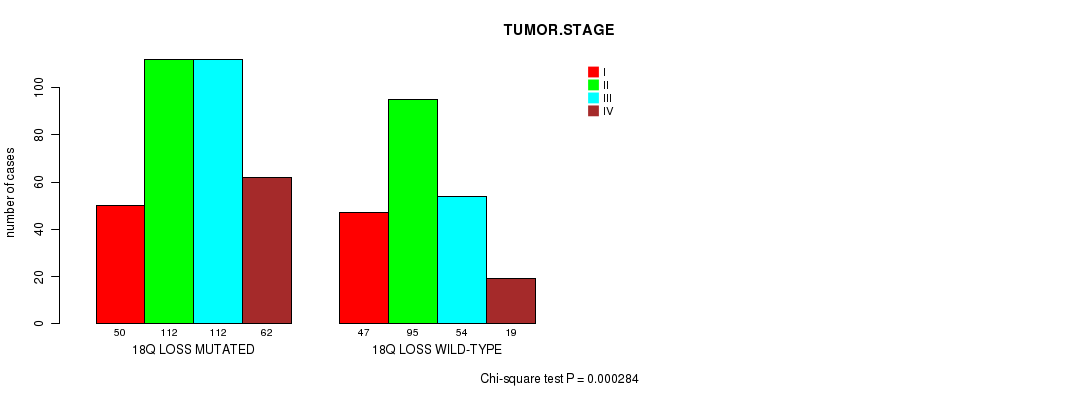
Table S98. Get Full Table Description of clustering approach #73: '19p loss mutation analysis'
| Cluster Labels | 19P LOSS MUTATED | 19P LOSS WILD-TYPE |
|---|---|---|
| Number of samples | 20 | 555 |
Table S99. Get Full Table Description of clustering approach #74: '19q loss mutation analysis'
| Cluster Labels | 19Q LOSS MUTATED | 19Q LOSS WILD-TYPE |
|---|---|---|
| Number of samples | 18 | 557 |
Table S100. Get Full Table Description of clustering approach #75: '20p loss mutation analysis'
| Cluster Labels | 20P LOSS MUTATED | 20P LOSS WILD-TYPE |
|---|---|---|
| Number of samples | 47 | 528 |
Table S101. Get Full Table Description of clustering approach #76: '21q loss mutation analysis'
| Cluster Labels | 21Q LOSS MUTATED | 21Q LOSS WILD-TYPE |
|---|---|---|
| Number of samples | 114 | 461 |
Table S102. Get Full Table Description of clustering approach #77: '22q loss mutation analysis'
| Cluster Labels | 22Q LOSS MUTATED | 22Q LOSS WILD-TYPE |
|---|---|---|
| Number of samples | 122 | 453 |
Table S103. Get Full Table Description of clustering approach #78: 'Xq loss mutation analysis'
| Cluster Labels | XQ LOSS MUTATED | XQ LOSS WILD-TYPE |
|---|---|---|
| Number of samples | 11 | 564 |
-
Cluster data file = broad_values_by_arm.mutsig.cluster.txt
-
Clinical data file = COADREAD-TP.clin.merged.picked.txt
-
Number of patients = 575
-
Number of clustering approaches = 78
-
Number of selected clinical features = 10
-
Exclude small clusters that include fewer than K patients, K = 3
For survival clinical features, the Kaplan-Meier survival curves of tumors with and without gene mutations were plotted and the statistical significance P values were estimated by logrank test (Bland and Altman 2004) using the 'survdiff' function in R
For continuous numerical clinical features, two-tailed Student's t test with unequal variance (Lehmann and Romano 2005) was applied to compare the clinical values between two tumor subtypes using 't.test' function in R
For binary clinical features, two-tailed Fisher's exact tests (Fisher 1922) were used to estimate the P values using the 'fisher.test' function in R
For multi-class clinical features (nominal or ordinal), Chi-square tests (Greenwood and Nikulin 1996) were used to estimate the P values using the 'chisq.test' function in R
For multiple hypothesis correction, Q value is the False Discovery Rate (FDR) analogue of the P value (Benjamini and Hochberg 1995), defined as the minimum FDR at which the test may be called significant. We used the 'Benjamini and Hochberg' method of 'p.adjust' function in R to convert P values into Q values.
This is an experimental feature. The full results of the analysis summarized in this report can be downloaded from the TCGA Data Coordination Center.