This pipeline computes the correlation between significant copy number variation (cnv) genes and molecular subtypes.
Testing the association between copy number variation of 30 peak regions and 10 molecular subtypes across 493 patients, 118 significant findings detected with Q value < 0.25.
-
Amp Peak 1(1q24.1) cnvs correlated to 'CN_CNMF', 'MRNASEQ_CNMF', 'MRNASEQ_CHIERARCHICAL', and 'MIRSEQ_CNMF'.
-
Amp Peak 2(1q32.1) cnvs correlated to 'CN_CNMF', 'RPPA_CNMF', 'MRNASEQ_CNMF', 'MRNASEQ_CHIERARCHICAL', and 'MIRSEQ_CNMF'.
-
Amp Peak 3(3q26.32) cnvs correlated to 'CN_CNMF', 'METHLYATION_CNMF', 'RPPA_CNMF', 'RPPA_CHIERARCHICAL', 'MRNASEQ_CNMF', 'MRNASEQ_CHIERARCHICAL', and 'MIRSEQ_CNMF'.
-
Amp Peak 5(5q35.1) cnvs correlated to 'CN_CNMF' and 'MRNASEQ_CHIERARCHICAL'.
-
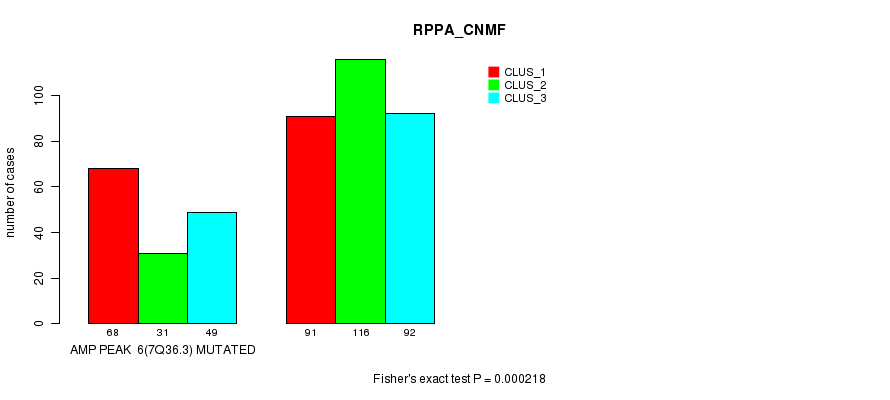
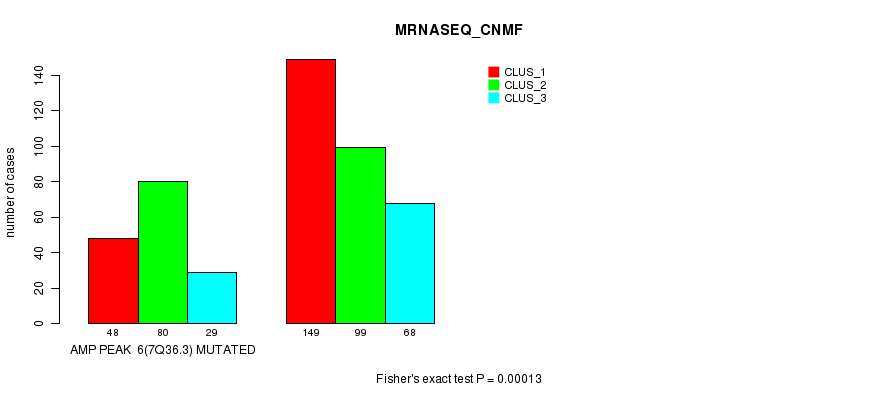
Amp Peak 6(7q36.3) cnvs correlated to 'CN_CNMF', 'RPPA_CNMF', and 'MRNASEQ_CNMF'.
-
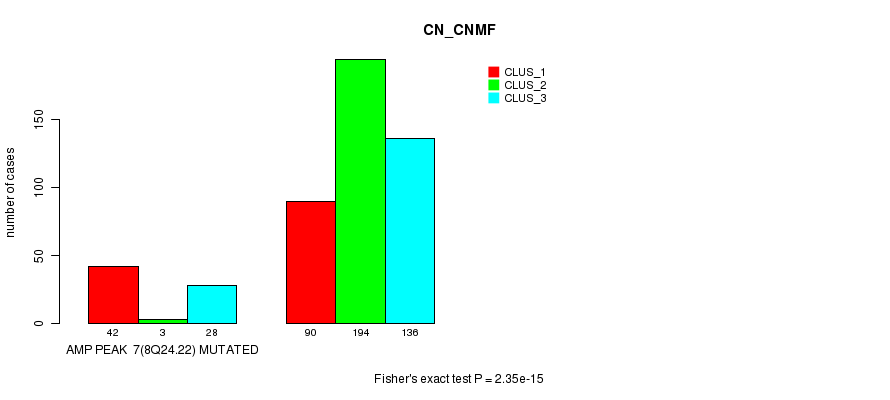
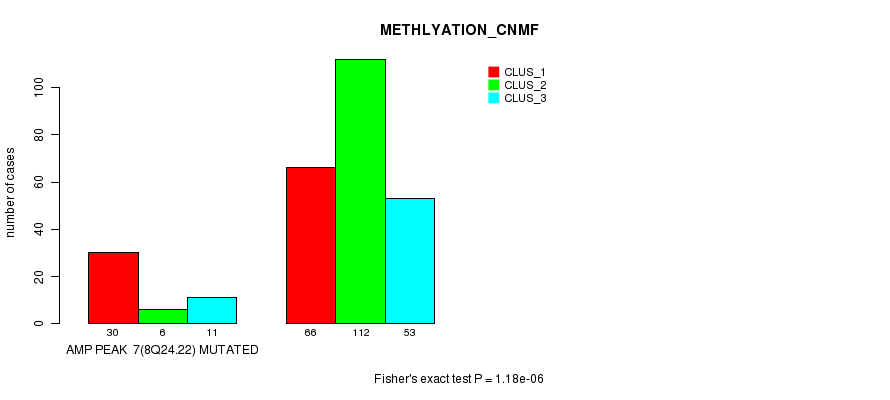
Amp Peak 7(8q24.22) cnvs correlated to 'CN_CNMF', 'METHLYATION_CNMF', 'RPPA_CNMF', 'RPPA_CHIERARCHICAL', 'MRNASEQ_CNMF', 'MRNASEQ_CHIERARCHICAL', 'MIRSEQ_CNMF', and 'MIRSEQ_CHIERARCHICAL'.
-
Del Peak 1(1p36.23) cnvs correlated to 'MRNA_CNMF', 'MRNA_CHIERARCHICAL', 'CN_CNMF', 'RPPA_CNMF', 'RPPA_CHIERARCHICAL', 'MRNASEQ_CNMF', 'MRNASEQ_CHIERARCHICAL', 'MIRSEQ_CNMF', and 'MIRSEQ_CHIERARCHICAL'.
-
Del Peak 2(1p31.1) cnvs correlated to 'MRNA_CHIERARCHICAL', 'CN_CNMF', 'MIRSEQ_CNMF', and 'MIRSEQ_CHIERARCHICAL'.
-
Del Peak 3(1q43) cnvs correlated to 'MIRSEQ_CHIERARCHICAL'.
-
Del Peak 4(2q37.3) cnvs correlated to 'MRNASEQ_CNMF', 'MRNASEQ_CHIERARCHICAL', and 'MIRSEQ_CHIERARCHICAL'.
-
Del Peak 5(3p25.3) cnvs correlated to 'MRNA_CNMF', 'MRNA_CHIERARCHICAL', 'CN_CNMF', 'METHLYATION_CNMF', 'MRNASEQ_CNMF', 'MRNASEQ_CHIERARCHICAL', 'MIRSEQ_CNMF', and 'MIRSEQ_CHIERARCHICAL'.
-
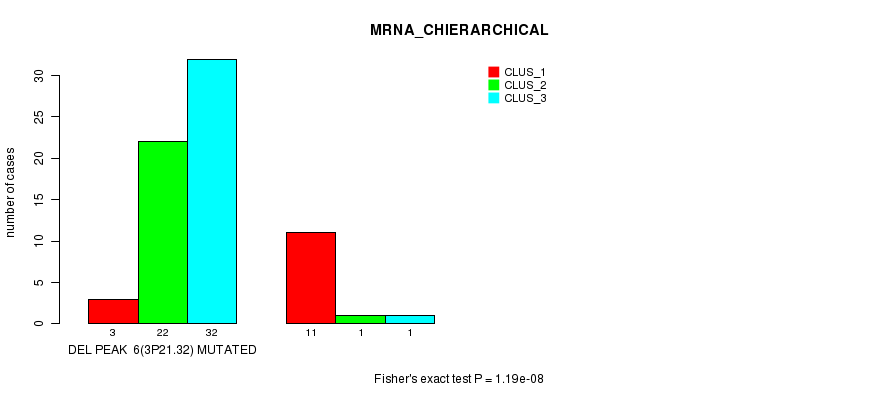
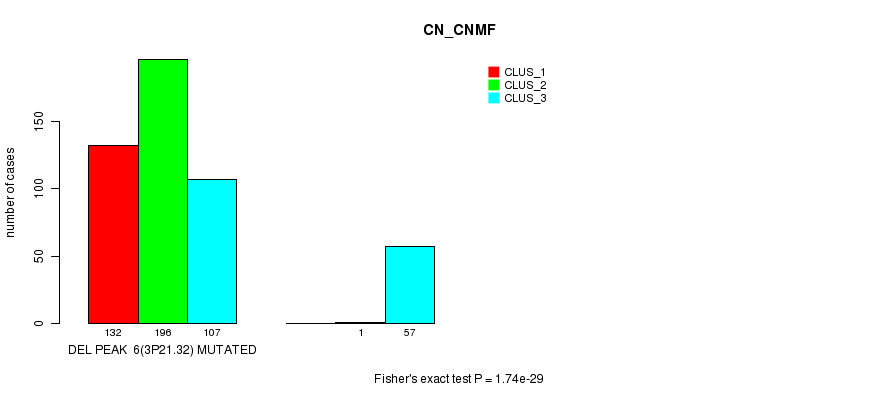
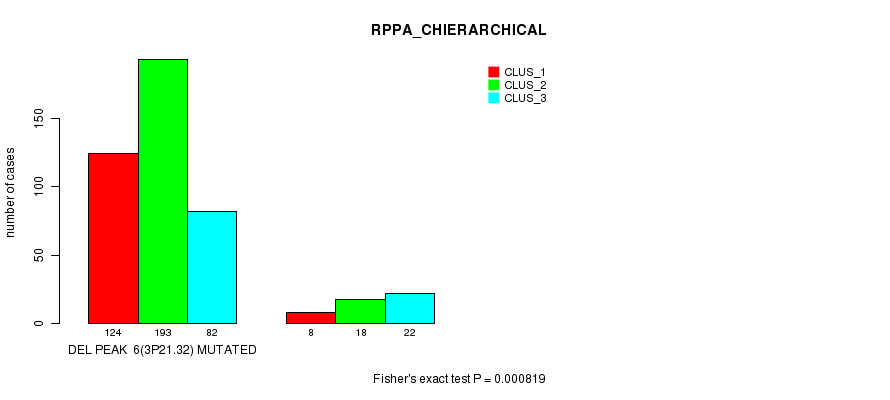
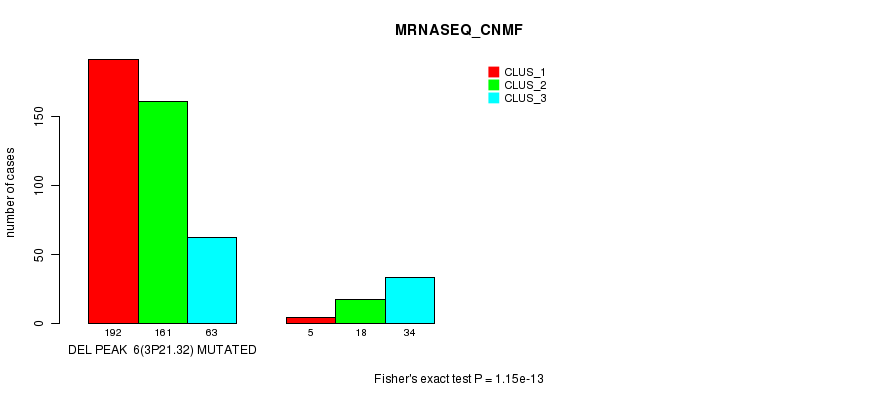
Del Peak 6(3p21.32) cnvs correlated to 'MRNA_CNMF', 'MRNA_CHIERARCHICAL', 'CN_CNMF', 'RPPA_CHIERARCHICAL', 'MRNASEQ_CNMF', 'MRNASEQ_CHIERARCHICAL', 'MIRSEQ_CNMF', and 'MIRSEQ_CHIERARCHICAL'.
-
Del Peak 7(3p12.2) cnvs correlated to 'CN_CNMF' and 'MRNASEQ_CHIERARCHICAL'.
-
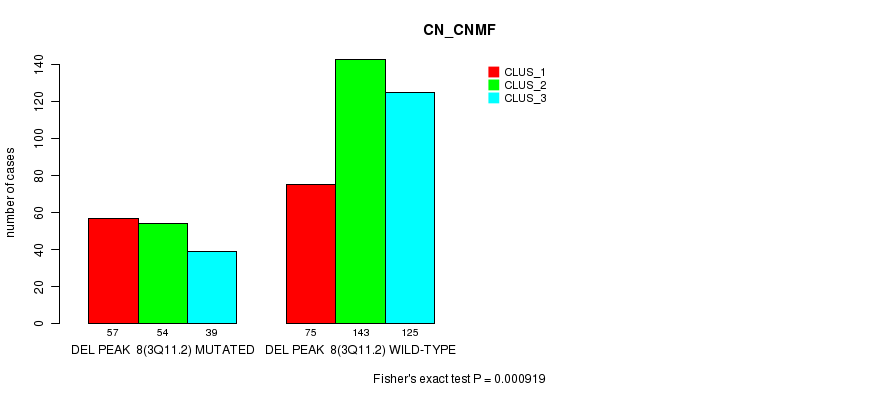
Del Peak 8(3q11.2) cnvs correlated to 'CN_CNMF'.
-
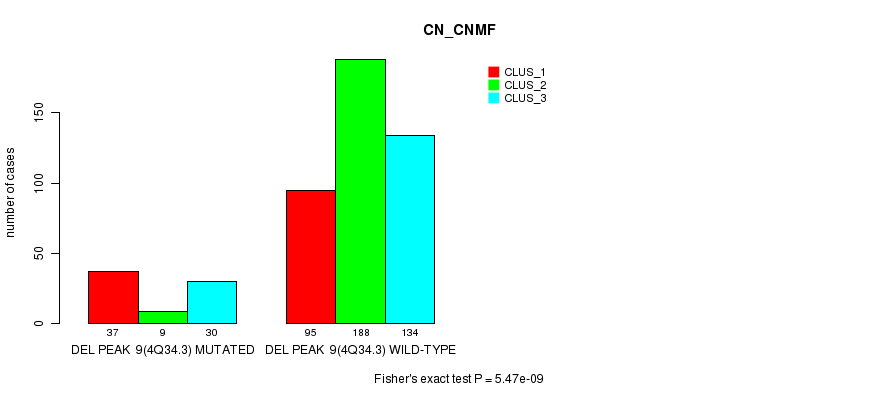
Del Peak 9(4q34.3) cnvs correlated to 'CN_CNMF', 'METHLYATION_CNMF', 'MRNASEQ_CNMF', and 'MRNASEQ_CHIERARCHICAL'.
-
Del Peak 10(6q26) cnvs correlated to 'CN_CNMF', 'RPPA_CNMF', 'RPPA_CHIERARCHICAL', 'MRNASEQ_CNMF', and 'MIRSEQ_CNMF'.
-
Del Peak 11(6q26) cnvs correlated to 'CN_CNMF', 'RPPA_CNMF', 'RPPA_CHIERARCHICAL', 'MRNASEQ_CNMF', and 'MIRSEQ_CNMF'.
-
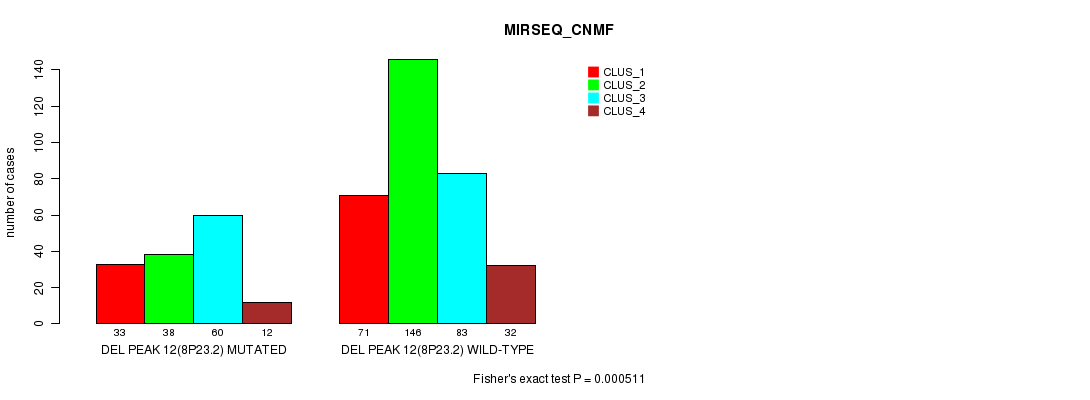
Del Peak 12(8p23.2) cnvs correlated to 'CN_CNMF' and 'MIRSEQ_CNMF'.
-
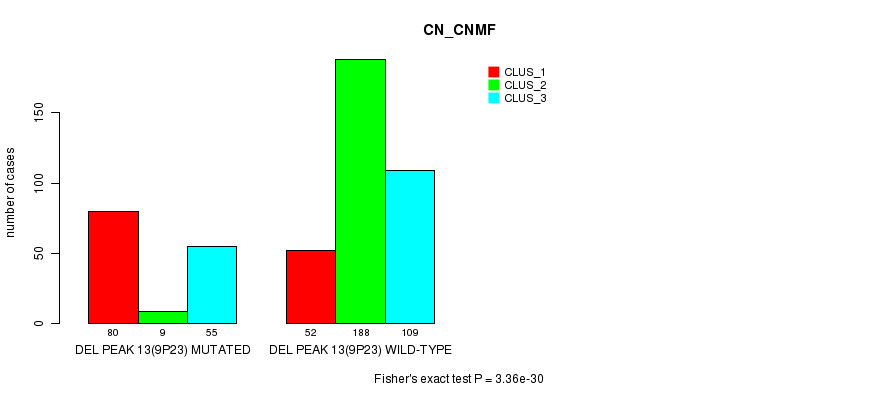
Del Peak 13(9p23) cnvs correlated to 'CN_CNMF', 'METHLYATION_CNMF', 'RPPA_CNMF', 'MRNASEQ_CNMF', 'MRNASEQ_CHIERARCHICAL', 'MIRSEQ_CNMF', and 'MIRSEQ_CHIERARCHICAL'.
-
Del Peak 14(9p21.3) cnvs correlated to 'MRNA_CNMF', 'MRNA_CHIERARCHICAL', 'CN_CNMF', 'METHLYATION_CNMF', 'RPPA_CNMF', 'MRNASEQ_CNMF', 'MRNASEQ_CHIERARCHICAL', 'MIRSEQ_CNMF', and 'MIRSEQ_CHIERARCHICAL'.
-
Del Peak 15(10q23.31) cnvs correlated to 'CN_CNMF'.
-
Del Peak 16(13q13.3) cnvs correlated to 'CN_CNMF', 'METHLYATION_CNMF', 'RPPA_CNMF', 'MRNASEQ_CNMF', 'MRNASEQ_CHIERARCHICAL', 'MIRSEQ_CNMF', and 'MIRSEQ_CHIERARCHICAL'.
-
Del Peak 17(14q31.1) cnvs correlated to 'MRNA_CNMF', 'MRNA_CHIERARCHICAL', 'CN_CNMF', 'METHLYATION_CNMF', 'RPPA_CNMF', 'RPPA_CHIERARCHICAL', 'MRNASEQ_CNMF', 'MRNASEQ_CHIERARCHICAL', and 'MIRSEQ_CNMF'.
-
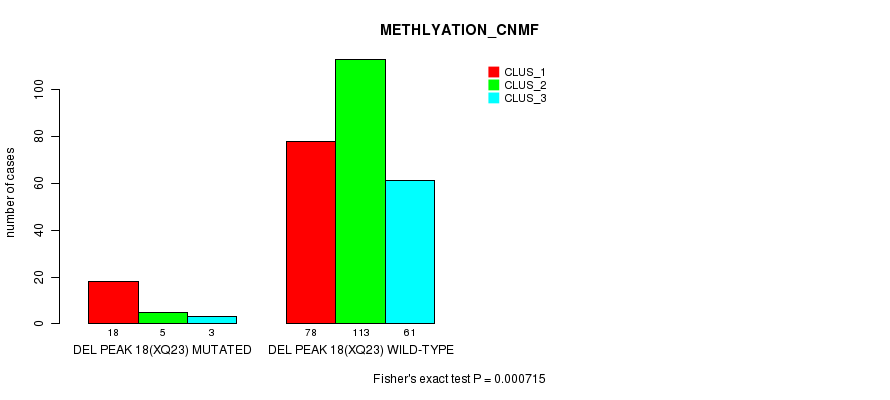
Del Peak 18(Xq23) cnvs correlated to 'CN_CNMF', 'METHLYATION_CNMF', 'RPPA_CHIERARCHICAL', and 'MIRSEQ_CHIERARCHICAL'.
Table 1. Get Full Table Overview of the association between significant copy number variation of 30 regions and 10 molecular subtypes. Shown in the table are P values (Q values). Thresholded by Q value < 0.25, 118 significant findings detected.
|
Molecular subtypes |
MRNA CNMF |
MRNA CHIERARCHICAL |
CN CNMF |
METHLYATION CNMF |
RPPA CNMF |
RPPA CHIERARCHICAL |
MRNASEQ CNMF |
MRNASEQ CHIERARCHICAL |
MIRSEQ CNMF |
MIRSEQ CHIERARCHICAL |
||
| nCNV (%) | nWild-Type | Fisher's exact test | Fisher's exact test | Fisher's exact test | Fisher's exact test | Fisher's exact test | Fisher's exact test | Fisher's exact test | Fisher's exact test | Fisher's exact test | Fisher's exact test | |
| Del Peak 1(1p36 23) | 98 (20%) | 395 |
0.000181 (0.0378) |
7.87e-05 (0.0171) |
1.28e-09 (3.44e-07) |
0.0201 (1.00) |
4.28e-05 (0.00949) |
0.000753 (0.143) |
0.000118 (0.0251) |
0.000449 (0.0903) |
1.09e-07 (2.82e-05) |
2.73e-08 (7.19e-06) |
| Del Peak 14(9p21 3) | 152 (31%) | 341 |
0.00125 (0.23) |
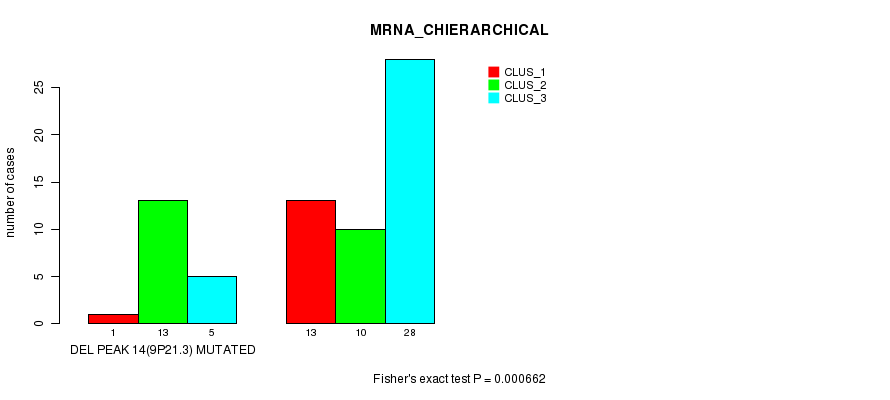
0.000662 (0.128) |
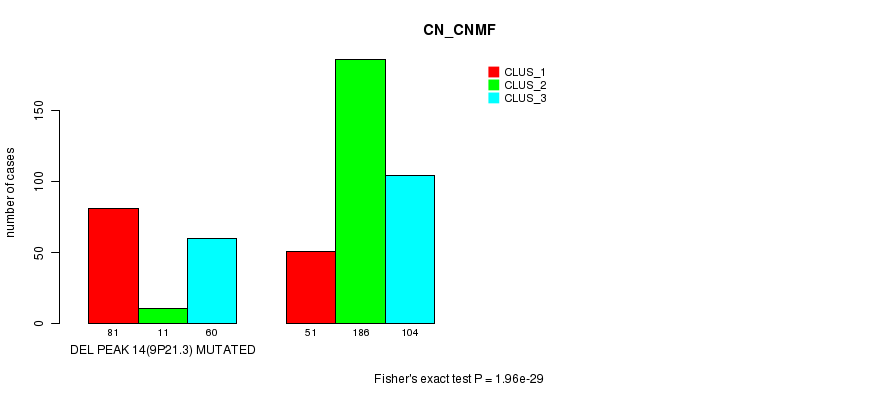
1.96e-29 (5.78e-27) |
2.24e-21 (6.46e-19) |
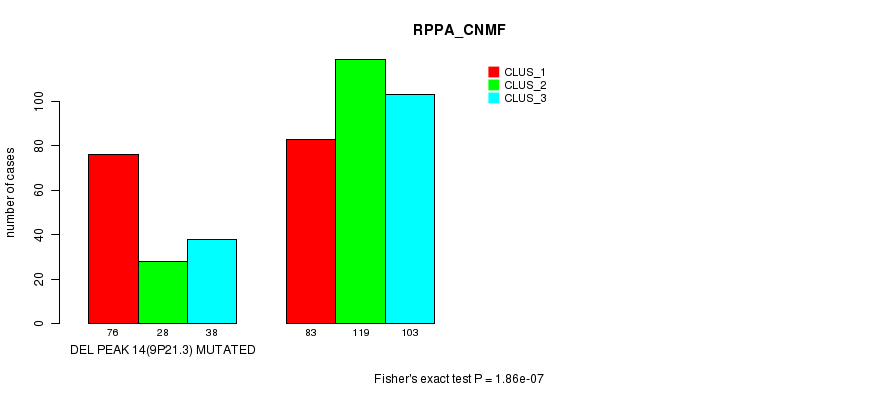
1.86e-07 (4.74e-05) |
0.00673 (1.00) |
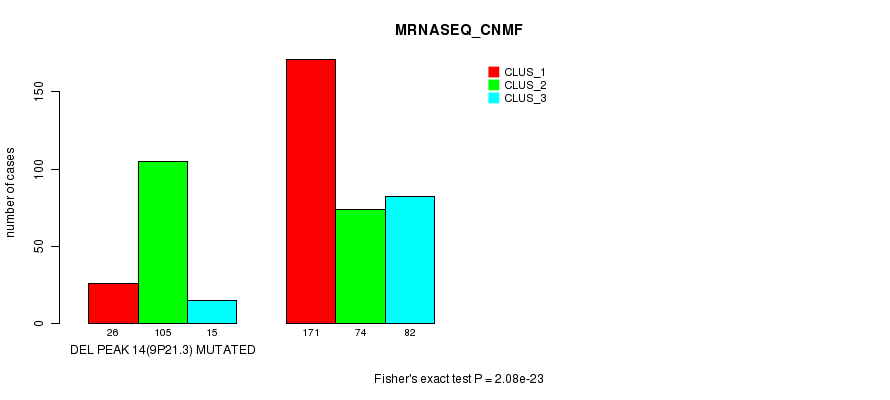
2.08e-23 (6.02e-21) |
1.15e-27 (3.37e-25) |
5.17e-15 (1.45e-12) |
2.78e-07 (7.06e-05) |
| Del Peak 17(14q31 1) | 218 (44%) | 275 |
5.92e-05 (0.0129) |
2.77e-05 (0.00627) |
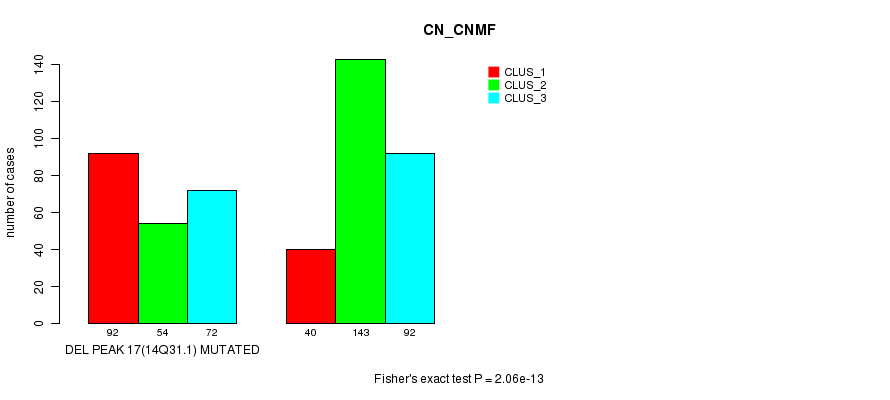
2.06e-13 (5.7e-11) |
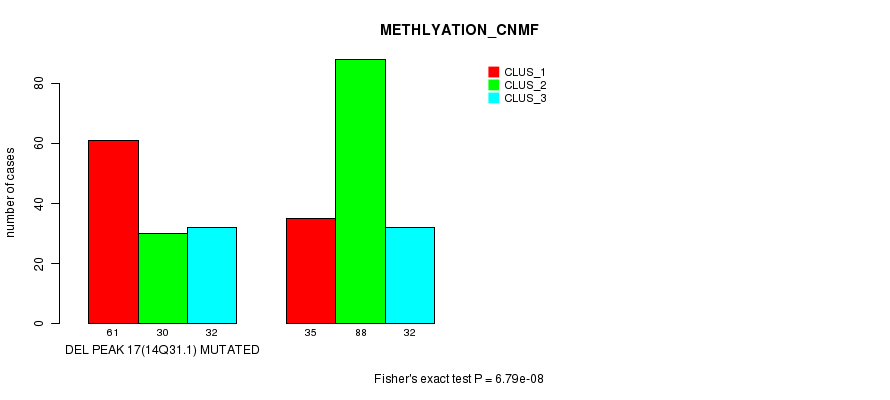
6.79e-08 (1.78e-05) |
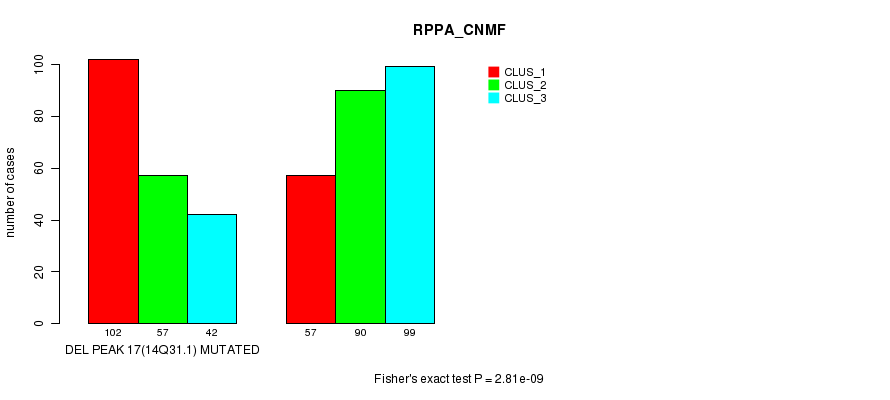
2.81e-09 (7.52e-07) |
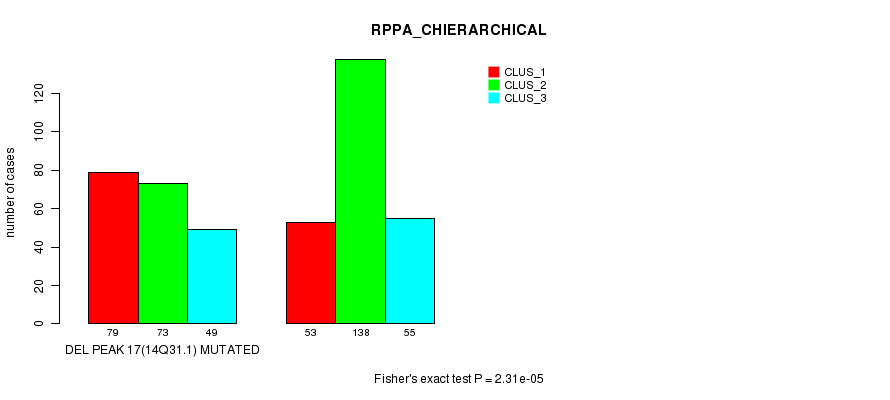
2.31e-05 (0.00527) |
6.67e-20 (1.91e-17) |
6.4e-15 (1.79e-12) |
2.51e-09 (6.74e-07) |
0.0712 (1.00) |
| Amp Peak 7(8q24 22) | 73 (15%) | 420 |
0.226 (1.00) |
0.278 (1.00) |
2.35e-15 (6.61e-13) |
1.18e-06 (0.00029) |
4.06e-07 (0.000102) |
0.000883 (0.166) |
2.78e-12 (7.68e-10) |
2.89e-11 (7.92e-09) |
6.2e-09 (1.65e-06) |
0.000181 (0.0378) |
| Del Peak 5(3p25 3) | 432 (88%) | 61 |
1.55e-07 (3.99e-05) |
1.19e-08 (3.16e-06) |
5.54e-30 (1.65e-27) |
0.000657 (0.128) |
0.00265 (0.443) |
0.00232 (0.399) |
2.88e-12 (7.91e-10) |
7.52e-16 (2.13e-13) |
8.36e-07 (0.000209) |
1.13e-09 (3.07e-07) |
| Del Peak 6(3p21 32) | 435 (88%) | 58 |
1.55e-07 (3.99e-05) |
1.19e-08 (3.16e-06) |
1.74e-29 (5.14e-27) |
0.00169 (0.301) |
0.0114 (1.00) |
0.000819 (0.155) |
1.15e-13 (3.21e-11) |
3.21e-16 (9.12e-14) |
2.3e-06 (0.000551) |
1.02e-09 (2.77e-07) |
| Amp Peak 3(3q26 32) | 80 (16%) | 413 |
0.0484 (1.00) |
0.0372 (1.00) |
1.5e-06 (0.000363) |
6.37e-06 (0.00151) |
0.00103 (0.191) |
0.000218 (0.0447) |
1.41e-06 (0.000342) |
9.53e-08 (2.48e-05) |
1.35e-06 (0.000328) |
0.0086 (1.00) |
| Del Peak 13(9p23) | 144 (29%) | 349 |
0.00362 (0.598) |
0.0023 (0.399) |
3.36e-30 (1e-27) |
3.43e-20 (9.85e-18) |
3.33e-07 (8.42e-05) |
0.0164 (1.00) |
3.59e-23 (1.04e-20) |
9.21e-24 (2.68e-21) |
1.81e-14 (5.05e-12) |
1.15e-05 (0.00266) |
| Del Peak 16(13q13 3) | 76 (15%) | 417 |
0.0144 (1.00) |
0.0117 (1.00) |
4.05e-06 (0.000963) |
0.000675 (0.13) |
3.61e-05 (0.00809) |
0.0618 (1.00) |
1.24e-06 (0.000303) |
9.39e-08 (2.45e-05) |
3.56e-07 (8.97e-05) |
4.74e-05 (0.0105) |
| Amp Peak 2(1q32 1) | 59 (12%) | 434 |
0.41 (1.00) |
0.724 (1.00) |
7.5e-10 (2.05e-07) |
0.172 (1.00) |
0.00062 (0.122) |
0.245 (1.00) |
7.94e-06 (0.00186) |
0.000588 (0.116) |
2.13e-05 (0.00488) |
1 (1.00) |
| Del Peak 10(6q26) | 142 (29%) | 351 |
0.015 (1.00) |
0.00364 (0.598) |
1.84e-25 (5.4e-23) |
0.0171 (1.00) |
1.07e-06 (0.000264) |
0.000939 (0.175) |
0.000478 (0.0956) |
0.0191 (1.00) |
2.1e-05 (0.00484) |
0.0216 (1.00) |
| Del Peak 11(6q26) | 142 (29%) | 351 |
0.015 (1.00) |
0.00364 (0.598) |
1.84e-25 (5.4e-23) |
0.0171 (1.00) |
1.07e-06 (0.000264) |
0.00135 (0.244) |
0.000159 (0.0336) |
0.0191 (1.00) |
6.59e-06 (0.00155) |
0.0257 (1.00) |
| Amp Peak 1(1q24 1) | 60 (12%) | 433 |
0.259 (1.00) |
0.491 (1.00) |
1.06e-07 (2.75e-05) |
0.359 (1.00) |
0.00247 (0.42) |
0.382 (1.00) |
3.88e-05 (0.00865) |
0.00128 (0.235) |
2.39e-05 (0.00543) |
0.978 (1.00) |
| Del Peak 2(1p31 1) | 72 (15%) | 421 |
0.00167 (0.299) |
0.000542 (0.107) |
2.84e-05 (0.00639) |
0.0474 (1.00) |
0.00253 (0.427) |
0.00763 (1.00) |
0.0596 (1.00) |
0.00727 (1.00) |
4.74e-05 (0.0105) |
3.38e-06 (0.000808) |
| Del Peak 9(4q34 3) | 76 (15%) | 417 |
0.314 (1.00) |
0.292 (1.00) |
5.47e-09 (1.46e-06) |
0.000408 (0.0825) |
0.0109 (1.00) |
0.136 (1.00) |
0.000344 (0.0698) |
1.18e-05 (0.00272) |
0.845 (1.00) |
0.0122 (1.00) |
| Del Peak 18(Xq23) | 55 (11%) | 438 |
0.109 (1.00) |
0.0776 (1.00) |
6.53e-06 (0.00154) |
0.000715 (0.136) |
0.00215 (0.376) |
0.00131 (0.239) |
0.208 (1.00) |
0.0183 (1.00) |
0.00173 (0.307) |
0.000111 (0.0237) |
| Amp Peak 6(7q36 3) | 163 (33%) | 330 |
0.667 (1.00) |
0.639 (1.00) |
1.25e-06 (0.000305) |
0.0283 (1.00) |
0.000218 (0.0447) |
0.0198 (1.00) |
0.00013 (0.0275) |
0.00373 (0.604) |
0.0305 (1.00) |
0.0817 (1.00) |
| Del Peak 4(2q37 3) | 48 (10%) | 445 |
0.00156 (0.281) |
0.00222 (0.386) |
0.396 (1.00) |
0.757 (1.00) |
0.282 (1.00) |
0.356 (1.00) |
0.000109 (0.0234) |
0.00019 (0.0393) |
0.276 (1.00) |
0.000161 (0.0338) |
| Amp Peak 5(5q35 1) | 311 (63%) | 182 |
0.0174 (1.00) |
0.00729 (1.00) |
5.53e-05 (0.0121) |
0.888 (1.00) |
0.0536 (1.00) |
0.00237 (0.406) |
0.0134 (1.00) |
0.000701 (0.135) |
0.0256 (1.00) |
0.00393 (0.633) |
| Del Peak 7(3p12 2) | 283 (57%) | 210 |
0.0404 (1.00) |
0.0145 (1.00) |
2.28e-17 (6.51e-15) |
0.349 (1.00) |
0.316 (1.00) |
0.0864 (1.00) |
0.00398 (0.637) |
0.000211 (0.0435) |
0.0304 (1.00) |
0.159 (1.00) |
| Del Peak 12(8p23 2) | 146 (30%) | 347 |
0.502 (1.00) |
0.475 (1.00) |
9.42e-06 (0.0022) |
0.0223 (1.00) |
0.0872 (1.00) |
0.316 (1.00) |
0.00256 (0.43) |
0.00869 (1.00) |
0.000511 (0.102) |
0.00696 (1.00) |
| Del Peak 3(1q43) | 38 (8%) | 455 |
0.0107 (1.00) |
0.0123 (1.00) |
0.00529 (0.835) |
0.697 (1.00) |
0.879 (1.00) |
0.0168 (1.00) |
0.00846 (1.00) |
0.00476 (0.757) |
0.0748 (1.00) |
0.000102 (0.022) |
| Del Peak 8(3q11 2) | 150 (30%) | 343 |
0.183 (1.00) |
0.0989 (1.00) |
0.000919 (0.172) |
0.687 (1.00) |
0.808 (1.00) |
0.17 (1.00) |
0.523 (1.00) |
0.106 (1.00) |
0.00914 (1.00) |
0.0412 (1.00) |
| Del Peak 15(10q23 31) | 90 (18%) | 403 |
0.441 (1.00) |
0.643 (1.00) |
9.29e-07 (0.000231) |
0.00202 (0.355) |
0.16 (1.00) |
0.192 (1.00) |
0.0578 (1.00) |
0.0344 (1.00) |
0.047 (1.00) |
0.0922 (1.00) |
| Amp Peak 4(4q32 1) | 14 (3%) | 479 |
0.698 (1.00) |
1 (1.00) |
0.0366 (1.00) |
0.385 (1.00) |
0.0813 (1.00) |
0.466 (1.00) |
0.0206 (1.00) |
0.0805 (1.00) |
||
| Amp Peak 8(10p14) | 16 (3%) | 477 |
0.189 (1.00) |
0.197 (1.00) |
0.00753 (1.00) |
0.342 (1.00) |
0.0436 (1.00) |
0.0264 (1.00) |
0.0321 (1.00) |
0.00295 (0.49) |
0.199 (1.00) |
0.0611 (1.00) |
| Amp Peak 9(17q24 3) | 37 (8%) | 456 |
0.0692 (1.00) |
0.0971 (1.00) |
0.00541 (0.85) |
0.163 (1.00) |
0.0779 (1.00) |
0.424 (1.00) |
0.197 (1.00) |
0.0204 (1.00) |
0.042 (1.00) |
0.0198 (1.00) |
| Amp Peak 10(Xp22 2) | 35 (7%) | 458 |
1 (1.00) |
1 (1.00) |
0.00655 (1.00) |
0.137 (1.00) |
0.0167 (1.00) |
0.0767 (1.00) |
0.1 (1.00) |
0.166 (1.00) |
0.0205 (1.00) |
0.17 (1.00) |
| Amp Peak 11(Xp11 4) | 36 (7%) | 457 |
0.843 (1.00) |
0.845 (1.00) |
0.0113 (1.00) |
0.0575 (1.00) |
0.0526 (1.00) |
0.0226 (1.00) |
0.0321 (1.00) |
0.0469 (1.00) |
0.0205 (1.00) |
0.17 (1.00) |
| Amp Peak 12(Xq11 2) | 32 (6%) | 461 |
0.172 (1.00) |
0.182 (1.00) |
0.253 (1.00) |
0.233 (1.00) |
0.462 (1.00) |
0.0883 (1.00) |
0.104 (1.00) |
0.391 (1.00) |
0.372 (1.00) |
0.116 (1.00) |
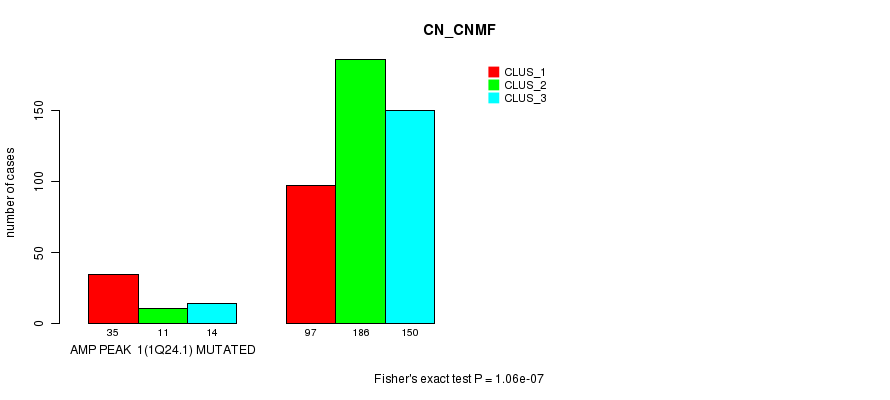
P value = 1.06e-07 (Fisher's exact test), Q value = 2.7e-05
Table S1. Gene #1: 'Amp Peak 1(1q24.1) mutation analysis' versus Clinical Feature #3: 'CN_CNMF'
| nPatients | CLUS_1 | CLUS_2 | CLUS_3 |
|---|---|---|---|
| ALL | 132 | 197 | 164 |
| AMP PEAK 1(1Q24.1) MUTATED | 35 | 11 | 14 |
| AMP PEAK 1(1Q24.1) WILD-TYPE | 97 | 186 | 150 |
Figure S1. Get High-res Image Gene #1: 'Amp Peak 1(1q24.1) mutation analysis' versus Clinical Feature #3: 'CN_CNMF'
P value = 3.88e-05 (Fisher's exact test), Q value = 0.0086
Table S2. Gene #1: 'Amp Peak 1(1q24.1) mutation analysis' versus Clinical Feature #7: 'MRNASEQ_CNMF'
| nPatients | CLUS_1 | CLUS_2 | CLUS_3 |
|---|---|---|---|
| ALL | 197 | 179 | 97 |
| AMP PEAK 1(1Q24.1) MUTATED | 18 | 36 | 3 |
| AMP PEAK 1(1Q24.1) WILD-TYPE | 179 | 143 | 94 |
Figure S2. Get High-res Image Gene #1: 'Amp Peak 1(1q24.1) mutation analysis' versus Clinical Feature #7: 'MRNASEQ_CNMF'

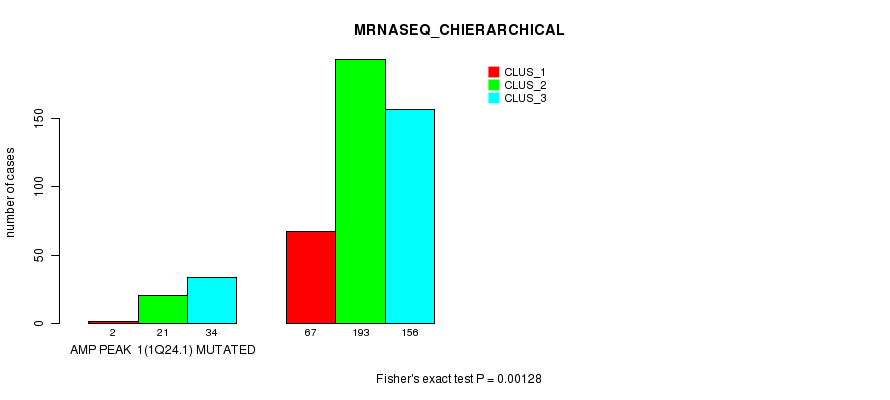
P value = 0.00128 (Fisher's exact test), Q value = 0.24
Table S3. Gene #1: 'Amp Peak 1(1q24.1) mutation analysis' versus Clinical Feature #8: 'MRNASEQ_CHIERARCHICAL'
| nPatients | CLUS_1 | CLUS_2 | CLUS_3 |
|---|---|---|---|
| ALL | 69 | 214 | 190 |
| AMP PEAK 1(1Q24.1) MUTATED | 2 | 21 | 34 |
| AMP PEAK 1(1Q24.1) WILD-TYPE | 67 | 193 | 156 |
Figure S3. Get High-res Image Gene #1: 'Amp Peak 1(1q24.1) mutation analysis' versus Clinical Feature #8: 'MRNASEQ_CHIERARCHICAL'
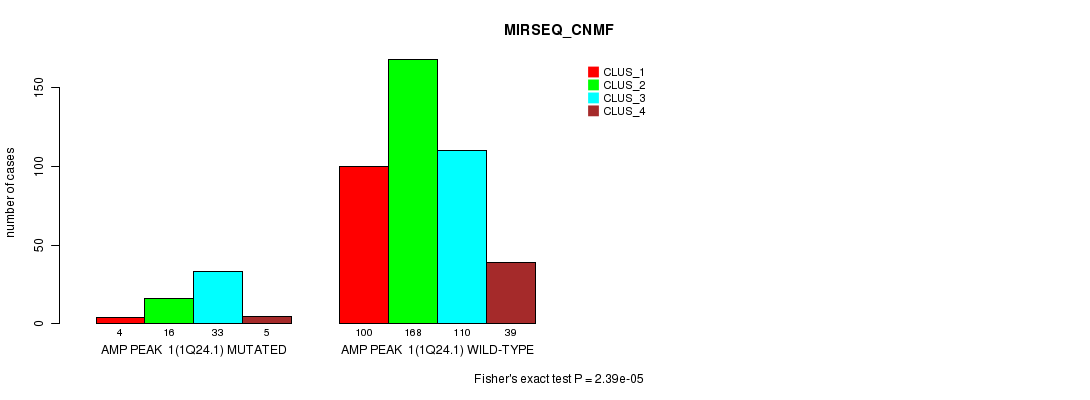
P value = 2.39e-05 (Fisher's exact test), Q value = 0.0054
Table S4. Gene #1: 'Amp Peak 1(1q24.1) mutation analysis' versus Clinical Feature #9: 'MIRSEQ_CNMF'
| nPatients | CLUS_1 | CLUS_2 | CLUS_3 | CLUS_4 |
|---|---|---|---|---|
| ALL | 104 | 184 | 143 | 44 |
| AMP PEAK 1(1Q24.1) MUTATED | 4 | 16 | 33 | 5 |
| AMP PEAK 1(1Q24.1) WILD-TYPE | 100 | 168 | 110 | 39 |
Figure S4. Get High-res Image Gene #1: 'Amp Peak 1(1q24.1) mutation analysis' versus Clinical Feature #9: 'MIRSEQ_CNMF'
P value = 7.5e-10 (Fisher's exact test), Q value = 2e-07
Table S5. Gene #2: 'Amp Peak 2(1q32.1) mutation analysis' versus Clinical Feature #3: 'CN_CNMF'
| nPatients | CLUS_1 | CLUS_2 | CLUS_3 |
|---|---|---|---|
| ALL | 132 | 197 | 164 |
| AMP PEAK 2(1Q32.1) MUTATED | 37 | 8 | 14 |
| AMP PEAK 2(1Q32.1) WILD-TYPE | 95 | 189 | 150 |
Figure S5. Get High-res Image Gene #2: 'Amp Peak 2(1q32.1) mutation analysis' versus Clinical Feature #3: 'CN_CNMF'

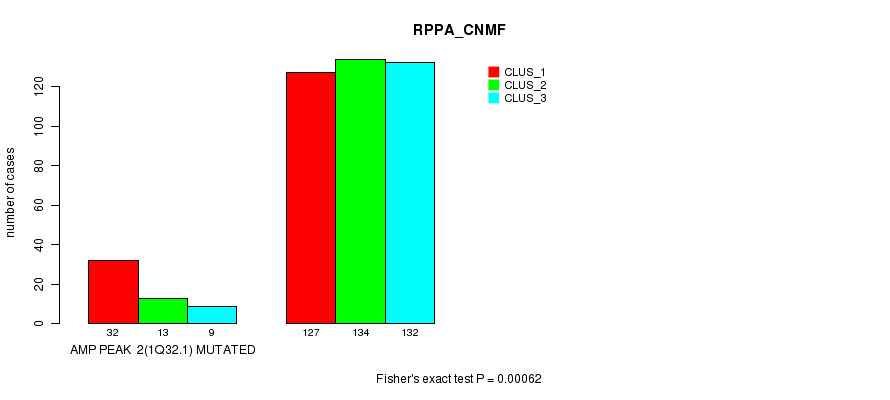
P value = 0.00062 (Fisher's exact test), Q value = 0.12
Table S6. Gene #2: 'Amp Peak 2(1q32.1) mutation analysis' versus Clinical Feature #5: 'RPPA_CNMF'
| nPatients | CLUS_1 | CLUS_2 | CLUS_3 |
|---|---|---|---|
| ALL | 159 | 147 | 141 |
| AMP PEAK 2(1Q32.1) MUTATED | 32 | 13 | 9 |
| AMP PEAK 2(1Q32.1) WILD-TYPE | 127 | 134 | 132 |
Figure S6. Get High-res Image Gene #2: 'Amp Peak 2(1q32.1) mutation analysis' versus Clinical Feature #5: 'RPPA_CNMF'
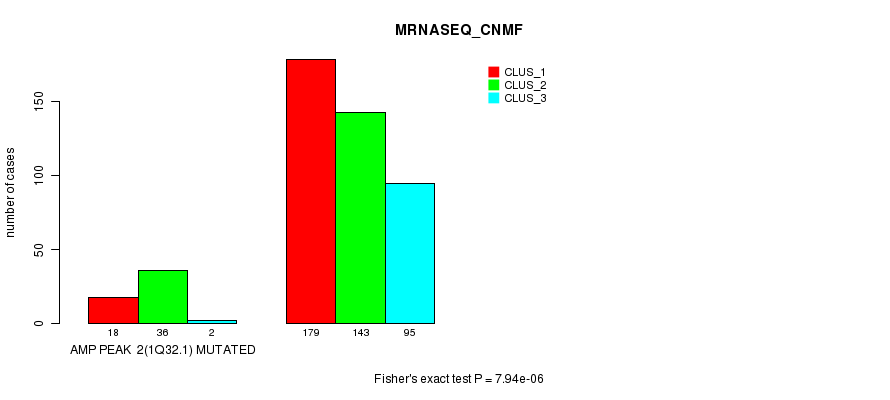
P value = 7.94e-06 (Fisher's exact test), Q value = 0.0019
Table S7. Gene #2: 'Amp Peak 2(1q32.1) mutation analysis' versus Clinical Feature #7: 'MRNASEQ_CNMF'
| nPatients | CLUS_1 | CLUS_2 | CLUS_3 |
|---|---|---|---|
| ALL | 197 | 179 | 97 |
| AMP PEAK 2(1Q32.1) MUTATED | 18 | 36 | 2 |
| AMP PEAK 2(1Q32.1) WILD-TYPE | 179 | 143 | 95 |
Figure S7. Get High-res Image Gene #2: 'Amp Peak 2(1q32.1) mutation analysis' versus Clinical Feature #7: 'MRNASEQ_CNMF'
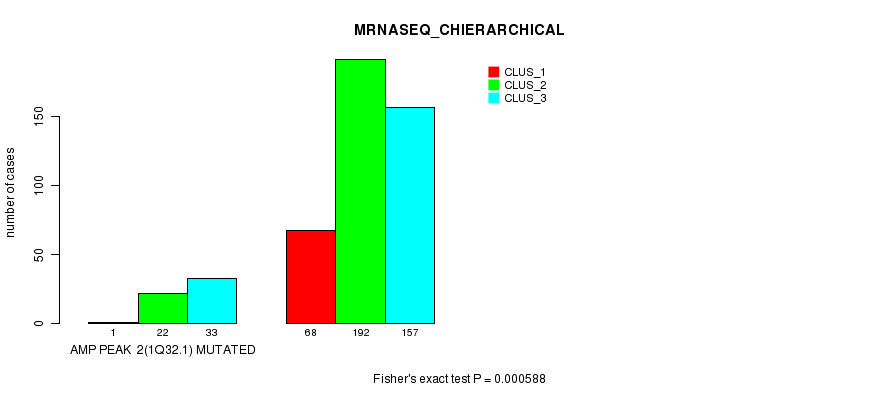
P value = 0.000588 (Fisher's exact test), Q value = 0.12
Table S8. Gene #2: 'Amp Peak 2(1q32.1) mutation analysis' versus Clinical Feature #8: 'MRNASEQ_CHIERARCHICAL'
| nPatients | CLUS_1 | CLUS_2 | CLUS_3 |
|---|---|---|---|
| ALL | 69 | 214 | 190 |
| AMP PEAK 2(1Q32.1) MUTATED | 1 | 22 | 33 |
| AMP PEAK 2(1Q32.1) WILD-TYPE | 68 | 192 | 157 |
Figure S8. Get High-res Image Gene #2: 'Amp Peak 2(1q32.1) mutation analysis' versus Clinical Feature #8: 'MRNASEQ_CHIERARCHICAL'
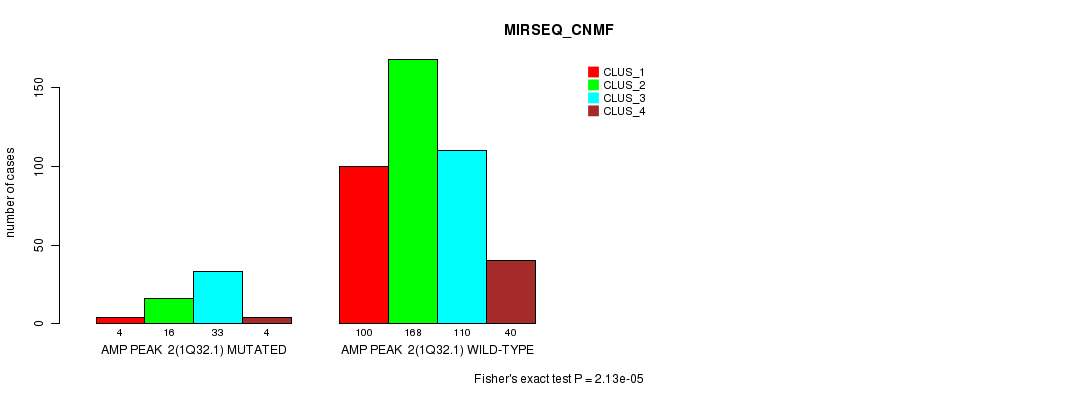
P value = 2.13e-05 (Fisher's exact test), Q value = 0.0049
Table S9. Gene #2: 'Amp Peak 2(1q32.1) mutation analysis' versus Clinical Feature #9: 'MIRSEQ_CNMF'
| nPatients | CLUS_1 | CLUS_2 | CLUS_3 | CLUS_4 |
|---|---|---|---|---|
| ALL | 104 | 184 | 143 | 44 |
| AMP PEAK 2(1Q32.1) MUTATED | 4 | 16 | 33 | 4 |
| AMP PEAK 2(1Q32.1) WILD-TYPE | 100 | 168 | 110 | 40 |
Figure S9. Get High-res Image Gene #2: 'Amp Peak 2(1q32.1) mutation analysis' versus Clinical Feature #9: 'MIRSEQ_CNMF'
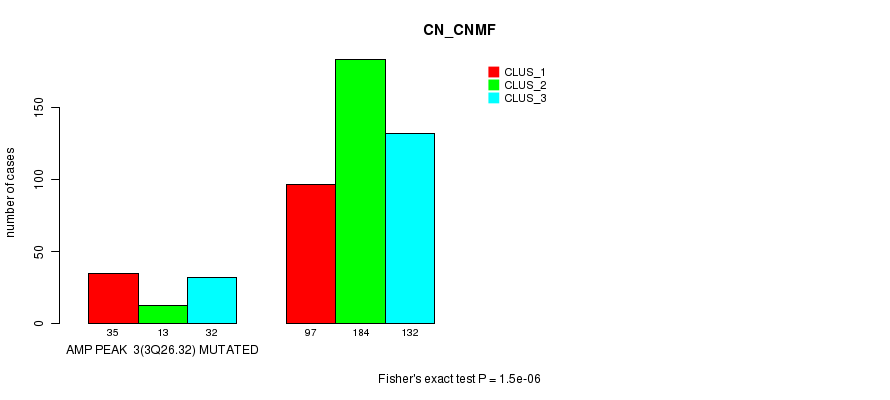
P value = 1.5e-06 (Fisher's exact test), Q value = 0.00036
Table S10. Gene #3: 'Amp Peak 3(3q26.32) mutation analysis' versus Clinical Feature #3: 'CN_CNMF'
| nPatients | CLUS_1 | CLUS_2 | CLUS_3 |
|---|---|---|---|
| ALL | 132 | 197 | 164 |
| AMP PEAK 3(3Q26.32) MUTATED | 35 | 13 | 32 |
| AMP PEAK 3(3Q26.32) WILD-TYPE | 97 | 184 | 132 |
Figure S10. Get High-res Image Gene #3: 'Amp Peak 3(3q26.32) mutation analysis' versus Clinical Feature #3: 'CN_CNMF'
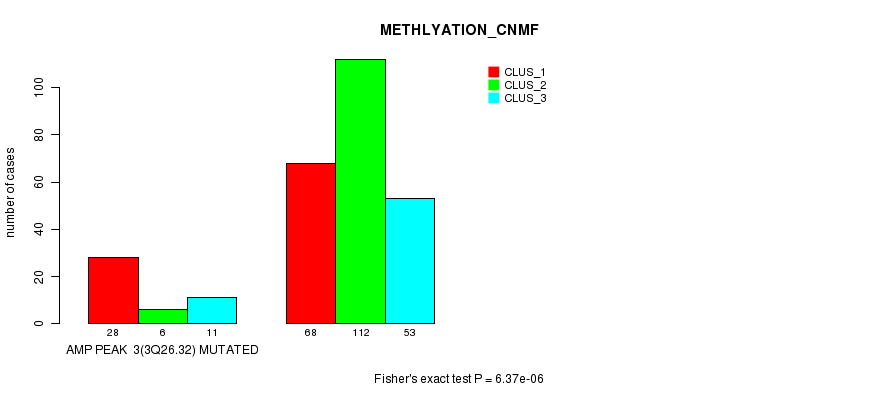
P value = 6.37e-06 (Fisher's exact test), Q value = 0.0015
Table S11. Gene #3: 'Amp Peak 3(3q26.32) mutation analysis' versus Clinical Feature #4: 'METHLYATION_CNMF'
| nPatients | CLUS_1 | CLUS_2 | CLUS_3 |
|---|---|---|---|
| ALL | 96 | 118 | 64 |
| AMP PEAK 3(3Q26.32) MUTATED | 28 | 6 | 11 |
| AMP PEAK 3(3Q26.32) WILD-TYPE | 68 | 112 | 53 |
Figure S11. Get High-res Image Gene #3: 'Amp Peak 3(3q26.32) mutation analysis' versus Clinical Feature #4: 'METHLYATION_CNMF'
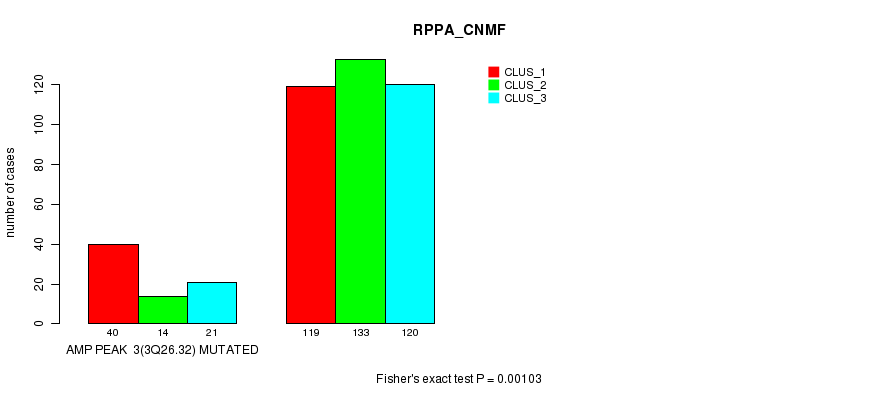
P value = 0.00103 (Fisher's exact test), Q value = 0.19
Table S12. Gene #3: 'Amp Peak 3(3q26.32) mutation analysis' versus Clinical Feature #5: 'RPPA_CNMF'
| nPatients | CLUS_1 | CLUS_2 | CLUS_3 |
|---|---|---|---|
| ALL | 159 | 147 | 141 |
| AMP PEAK 3(3Q26.32) MUTATED | 40 | 14 | 21 |
| AMP PEAK 3(3Q26.32) WILD-TYPE | 119 | 133 | 120 |
Figure S12. Get High-res Image Gene #3: 'Amp Peak 3(3q26.32) mutation analysis' versus Clinical Feature #5: 'RPPA_CNMF'
P value = 0.000218 (Fisher's exact test), Q value = 0.045
Table S13. Gene #3: 'Amp Peak 3(3q26.32) mutation analysis' versus Clinical Feature #6: 'RPPA_CHIERARCHICAL'
| nPatients | CLUS_1 | CLUS_2 | CLUS_3 |
|---|---|---|---|
| ALL | 132 | 211 | 104 |
| AMP PEAK 3(3Q26.32) MUTATED | 21 | 23 | 31 |
| AMP PEAK 3(3Q26.32) WILD-TYPE | 111 | 188 | 73 |
Figure S13. Get High-res Image Gene #3: 'Amp Peak 3(3q26.32) mutation analysis' versus Clinical Feature #6: 'RPPA_CHIERARCHICAL'

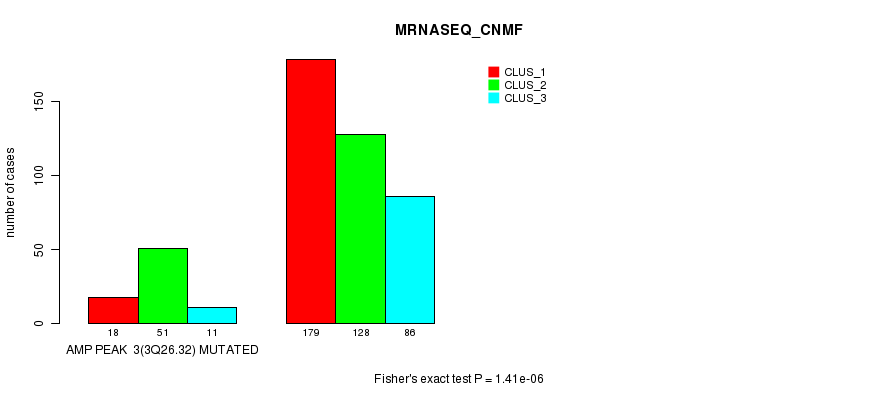
P value = 1.41e-06 (Fisher's exact test), Q value = 0.00034
Table S14. Gene #3: 'Amp Peak 3(3q26.32) mutation analysis' versus Clinical Feature #7: 'MRNASEQ_CNMF'
| nPatients | CLUS_1 | CLUS_2 | CLUS_3 |
|---|---|---|---|
| ALL | 197 | 179 | 97 |
| AMP PEAK 3(3Q26.32) MUTATED | 18 | 51 | 11 |
| AMP PEAK 3(3Q26.32) WILD-TYPE | 179 | 128 | 86 |
Figure S14. Get High-res Image Gene #3: 'Amp Peak 3(3q26.32) mutation analysis' versus Clinical Feature #7: 'MRNASEQ_CNMF'
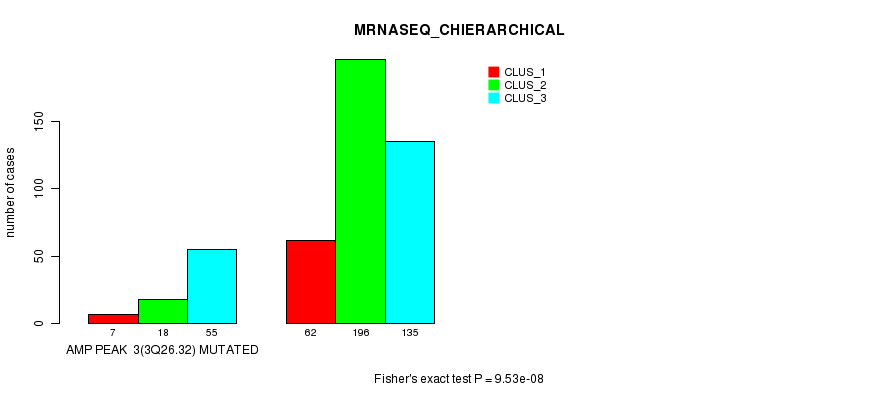
P value = 9.53e-08 (Fisher's exact test), Q value = 2.5e-05
Table S15. Gene #3: 'Amp Peak 3(3q26.32) mutation analysis' versus Clinical Feature #8: 'MRNASEQ_CHIERARCHICAL'
| nPatients | CLUS_1 | CLUS_2 | CLUS_3 |
|---|---|---|---|
| ALL | 69 | 214 | 190 |
| AMP PEAK 3(3Q26.32) MUTATED | 7 | 18 | 55 |
| AMP PEAK 3(3Q26.32) WILD-TYPE | 62 | 196 | 135 |
Figure S15. Get High-res Image Gene #3: 'Amp Peak 3(3q26.32) mutation analysis' versus Clinical Feature #8: 'MRNASEQ_CHIERARCHICAL'
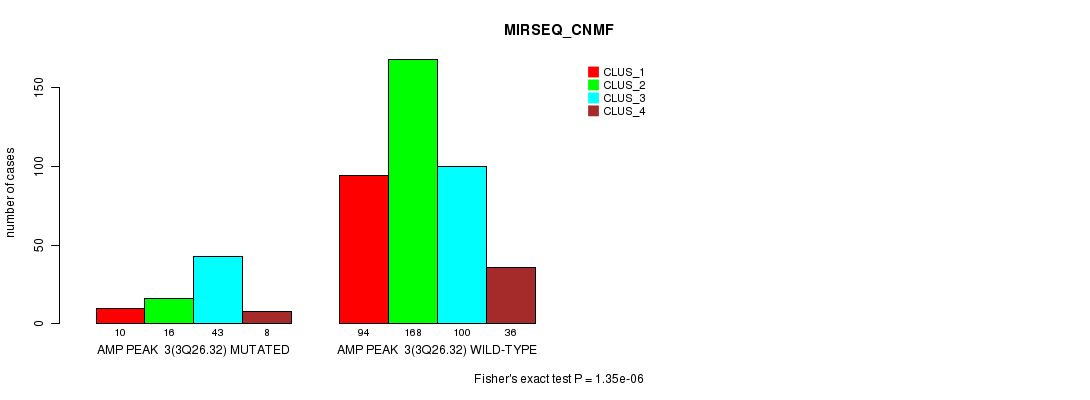
P value = 1.35e-06 (Fisher's exact test), Q value = 0.00033
Table S16. Gene #3: 'Amp Peak 3(3q26.32) mutation analysis' versus Clinical Feature #9: 'MIRSEQ_CNMF'
| nPatients | CLUS_1 | CLUS_2 | CLUS_3 | CLUS_4 |
|---|---|---|---|---|
| ALL | 104 | 184 | 143 | 44 |
| AMP PEAK 3(3Q26.32) MUTATED | 10 | 16 | 43 | 8 |
| AMP PEAK 3(3Q26.32) WILD-TYPE | 94 | 168 | 100 | 36 |
Figure S16. Get High-res Image Gene #3: 'Amp Peak 3(3q26.32) mutation analysis' versus Clinical Feature #9: 'MIRSEQ_CNMF'
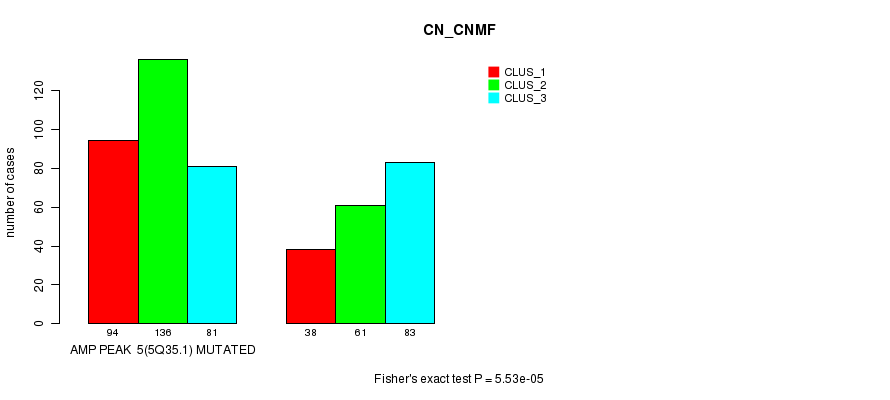
P value = 5.53e-05 (Fisher's exact test), Q value = 0.012
Table S17. Gene #5: 'Amp Peak 5(5q35.1) mutation analysis' versus Clinical Feature #3: 'CN_CNMF'
| nPatients | CLUS_1 | CLUS_2 | CLUS_3 |
|---|---|---|---|
| ALL | 132 | 197 | 164 |
| AMP PEAK 5(5Q35.1) MUTATED | 94 | 136 | 81 |
| AMP PEAK 5(5Q35.1) WILD-TYPE | 38 | 61 | 83 |
Figure S17. Get High-res Image Gene #5: 'Amp Peak 5(5q35.1) mutation analysis' versus Clinical Feature #3: 'CN_CNMF'
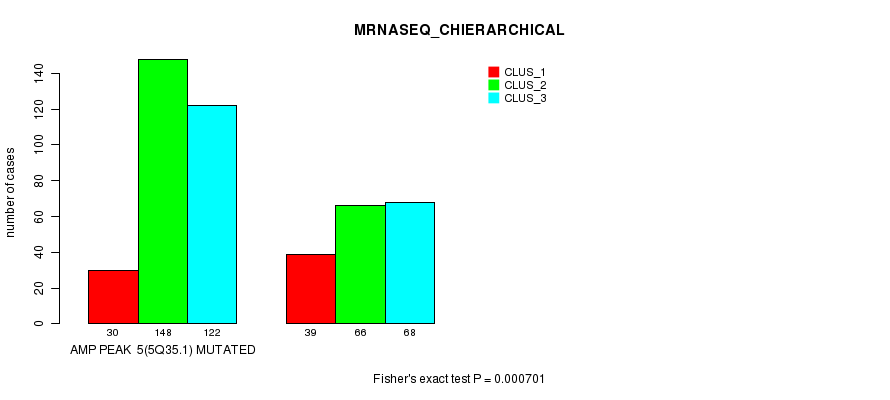
P value = 0.000701 (Fisher's exact test), Q value = 0.13
Table S18. Gene #5: 'Amp Peak 5(5q35.1) mutation analysis' versus Clinical Feature #8: 'MRNASEQ_CHIERARCHICAL'
| nPatients | CLUS_1 | CLUS_2 | CLUS_3 |
|---|---|---|---|
| ALL | 69 | 214 | 190 |
| AMP PEAK 5(5Q35.1) MUTATED | 30 | 148 | 122 |
| AMP PEAK 5(5Q35.1) WILD-TYPE | 39 | 66 | 68 |
Figure S18. Get High-res Image Gene #5: 'Amp Peak 5(5q35.1) mutation analysis' versus Clinical Feature #8: 'MRNASEQ_CHIERARCHICAL'
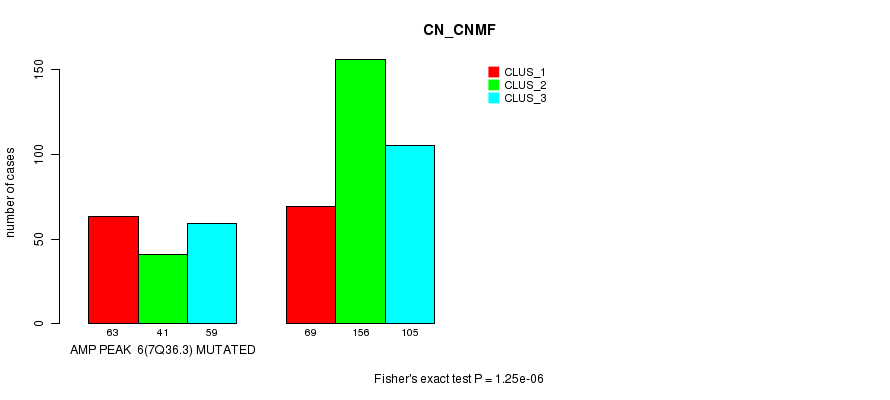
P value = 1.25e-06 (Fisher's exact test), Q value = 3e-04
Table S19. Gene #6: 'Amp Peak 6(7q36.3) mutation analysis' versus Clinical Feature #3: 'CN_CNMF'
| nPatients | CLUS_1 | CLUS_2 | CLUS_3 |
|---|---|---|---|
| ALL | 132 | 197 | 164 |
| AMP PEAK 6(7Q36.3) MUTATED | 63 | 41 | 59 |
| AMP PEAK 6(7Q36.3) WILD-TYPE | 69 | 156 | 105 |
Figure S19. Get High-res Image Gene #6: 'Amp Peak 6(7q36.3) mutation analysis' versus Clinical Feature #3: 'CN_CNMF'
P value = 0.000218 (Fisher's exact test), Q value = 0.045
Table S20. Gene #6: 'Amp Peak 6(7q36.3) mutation analysis' versus Clinical Feature #5: 'RPPA_CNMF'
| nPatients | CLUS_1 | CLUS_2 | CLUS_3 |
|---|---|---|---|
| ALL | 159 | 147 | 141 |
| AMP PEAK 6(7Q36.3) MUTATED | 68 | 31 | 49 |
| AMP PEAK 6(7Q36.3) WILD-TYPE | 91 | 116 | 92 |
Figure S20. Get High-res Image Gene #6: 'Amp Peak 6(7q36.3) mutation analysis' versus Clinical Feature #5: 'RPPA_CNMF'
P value = 0.00013 (Fisher's exact test), Q value = 0.027
Table S21. Gene #6: 'Amp Peak 6(7q36.3) mutation analysis' versus Clinical Feature #7: 'MRNASEQ_CNMF'
| nPatients | CLUS_1 | CLUS_2 | CLUS_3 |
|---|---|---|---|
| ALL | 197 | 179 | 97 |
| AMP PEAK 6(7Q36.3) MUTATED | 48 | 80 | 29 |
| AMP PEAK 6(7Q36.3) WILD-TYPE | 149 | 99 | 68 |
Figure S21. Get High-res Image Gene #6: 'Amp Peak 6(7q36.3) mutation analysis' versus Clinical Feature #7: 'MRNASEQ_CNMF'
P value = 2.35e-15 (Fisher's exact test), Q value = 6.6e-13
Table S22. Gene #7: 'Amp Peak 7(8q24.22) mutation analysis' versus Clinical Feature #3: 'CN_CNMF'
| nPatients | CLUS_1 | CLUS_2 | CLUS_3 |
|---|---|---|---|
| ALL | 132 | 197 | 164 |
| AMP PEAK 7(8Q24.22) MUTATED | 42 | 3 | 28 |
| AMP PEAK 7(8Q24.22) WILD-TYPE | 90 | 194 | 136 |
Figure S22. Get High-res Image Gene #7: 'Amp Peak 7(8q24.22) mutation analysis' versus Clinical Feature #3: 'CN_CNMF'
P value = 1.18e-06 (Fisher's exact test), Q value = 0.00029
Table S23. Gene #7: 'Amp Peak 7(8q24.22) mutation analysis' versus Clinical Feature #4: 'METHLYATION_CNMF'
| nPatients | CLUS_1 | CLUS_2 | CLUS_3 |
|---|---|---|---|
| ALL | 96 | 118 | 64 |
| AMP PEAK 7(8Q24.22) MUTATED | 30 | 6 | 11 |
| AMP PEAK 7(8Q24.22) WILD-TYPE | 66 | 112 | 53 |
Figure S23. Get High-res Image Gene #7: 'Amp Peak 7(8q24.22) mutation analysis' versus Clinical Feature #4: 'METHLYATION_CNMF'
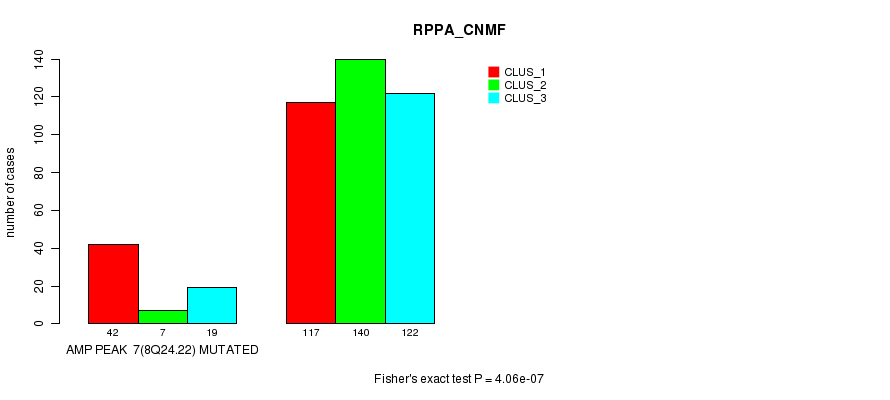
P value = 4.06e-07 (Fisher's exact test), Q value = 1e-04
Table S24. Gene #7: 'Amp Peak 7(8q24.22) mutation analysis' versus Clinical Feature #5: 'RPPA_CNMF'
| nPatients | CLUS_1 | CLUS_2 | CLUS_3 |
|---|---|---|---|
| ALL | 159 | 147 | 141 |
| AMP PEAK 7(8Q24.22) MUTATED | 42 | 7 | 19 |
| AMP PEAK 7(8Q24.22) WILD-TYPE | 117 | 140 | 122 |
Figure S24. Get High-res Image Gene #7: 'Amp Peak 7(8q24.22) mutation analysis' versus Clinical Feature #5: 'RPPA_CNMF'
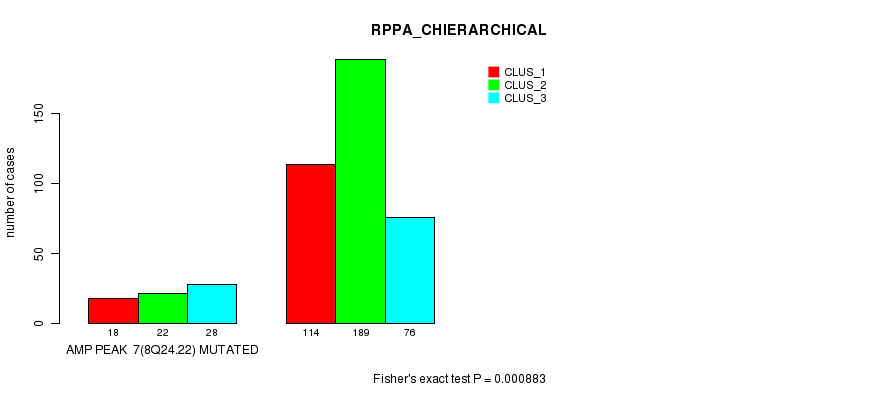
P value = 0.000883 (Fisher's exact test), Q value = 0.17
Table S25. Gene #7: 'Amp Peak 7(8q24.22) mutation analysis' versus Clinical Feature #6: 'RPPA_CHIERARCHICAL'
| nPatients | CLUS_1 | CLUS_2 | CLUS_3 |
|---|---|---|---|
| ALL | 132 | 211 | 104 |
| AMP PEAK 7(8Q24.22) MUTATED | 18 | 22 | 28 |
| AMP PEAK 7(8Q24.22) WILD-TYPE | 114 | 189 | 76 |
Figure S25. Get High-res Image Gene #7: 'Amp Peak 7(8q24.22) mutation analysis' versus Clinical Feature #6: 'RPPA_CHIERARCHICAL'
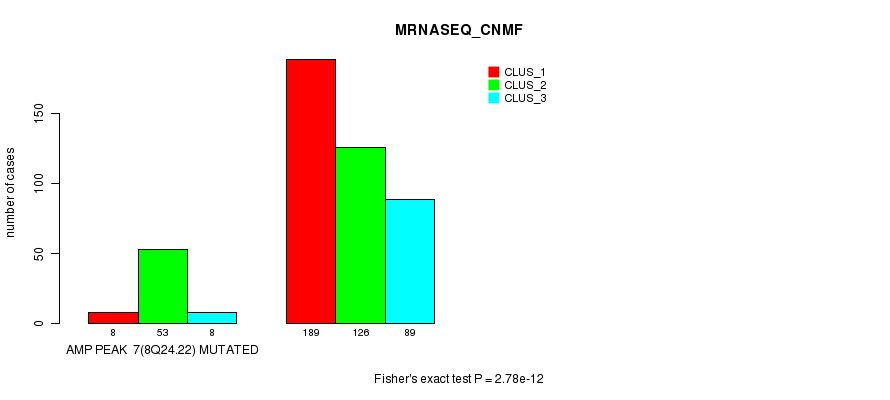
P value = 2.78e-12 (Fisher's exact test), Q value = 7.7e-10
Table S26. Gene #7: 'Amp Peak 7(8q24.22) mutation analysis' versus Clinical Feature #7: 'MRNASEQ_CNMF'
| nPatients | CLUS_1 | CLUS_2 | CLUS_3 |
|---|---|---|---|
| ALL | 197 | 179 | 97 |
| AMP PEAK 7(8Q24.22) MUTATED | 8 | 53 | 8 |
| AMP PEAK 7(8Q24.22) WILD-TYPE | 189 | 126 | 89 |
Figure S26. Get High-res Image Gene #7: 'Amp Peak 7(8q24.22) mutation analysis' versus Clinical Feature #7: 'MRNASEQ_CNMF'
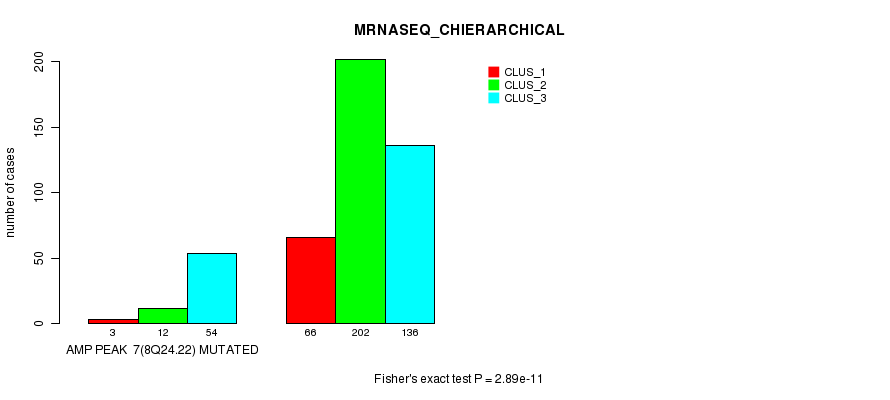
P value = 2.89e-11 (Fisher's exact test), Q value = 7.9e-09
Table S27. Gene #7: 'Amp Peak 7(8q24.22) mutation analysis' versus Clinical Feature #8: 'MRNASEQ_CHIERARCHICAL'
| nPatients | CLUS_1 | CLUS_2 | CLUS_3 |
|---|---|---|---|
| ALL | 69 | 214 | 190 |
| AMP PEAK 7(8Q24.22) MUTATED | 3 | 12 | 54 |
| AMP PEAK 7(8Q24.22) WILD-TYPE | 66 | 202 | 136 |
Figure S27. Get High-res Image Gene #7: 'Amp Peak 7(8q24.22) mutation analysis' versus Clinical Feature #8: 'MRNASEQ_CHIERARCHICAL'
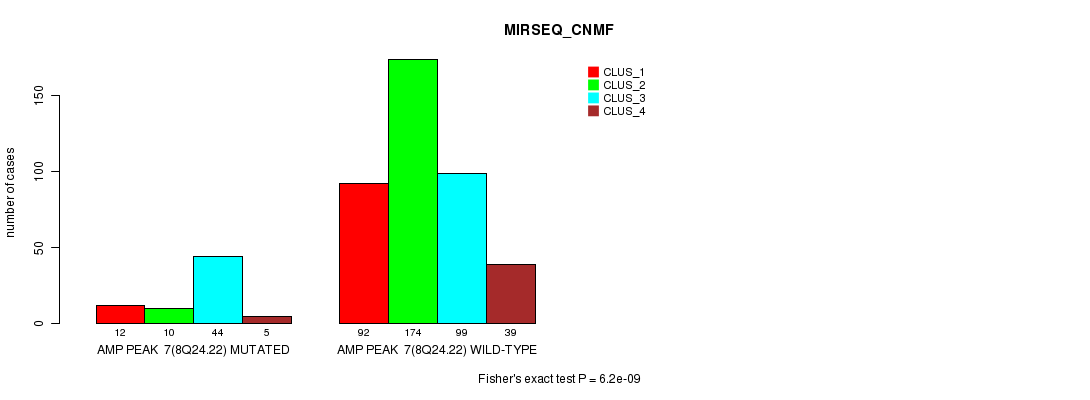
P value = 6.2e-09 (Fisher's exact test), Q value = 1.6e-06
Table S28. Gene #7: 'Amp Peak 7(8q24.22) mutation analysis' versus Clinical Feature #9: 'MIRSEQ_CNMF'
| nPatients | CLUS_1 | CLUS_2 | CLUS_3 | CLUS_4 |
|---|---|---|---|---|
| ALL | 104 | 184 | 143 | 44 |
| AMP PEAK 7(8Q24.22) MUTATED | 12 | 10 | 44 | 5 |
| AMP PEAK 7(8Q24.22) WILD-TYPE | 92 | 174 | 99 | 39 |
Figure S28. Get High-res Image Gene #7: 'Amp Peak 7(8q24.22) mutation analysis' versus Clinical Feature #9: 'MIRSEQ_CNMF'
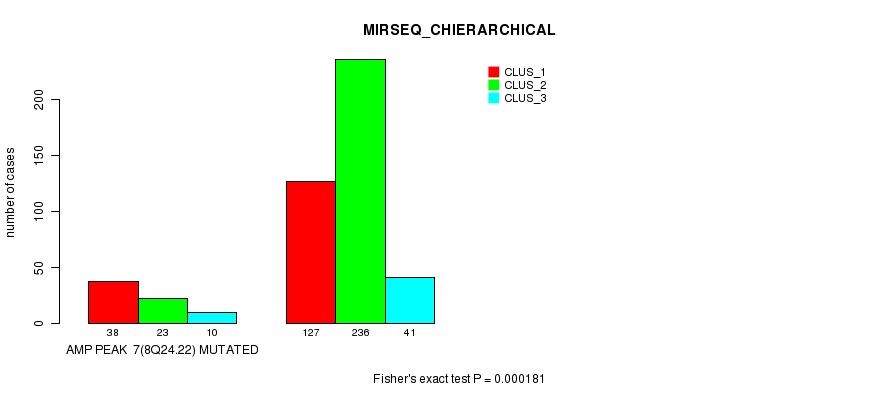
P value = 0.000181 (Fisher's exact test), Q value = 0.038
Table S29. Gene #7: 'Amp Peak 7(8q24.22) mutation analysis' versus Clinical Feature #10: 'MIRSEQ_CHIERARCHICAL'
| nPatients | CLUS_1 | CLUS_2 | CLUS_3 |
|---|---|---|---|
| ALL | 165 | 259 | 51 |
| AMP PEAK 7(8Q24.22) MUTATED | 38 | 23 | 10 |
| AMP PEAK 7(8Q24.22) WILD-TYPE | 127 | 236 | 41 |
Figure S29. Get High-res Image Gene #7: 'Amp Peak 7(8q24.22) mutation analysis' versus Clinical Feature #10: 'MIRSEQ_CHIERARCHICAL'
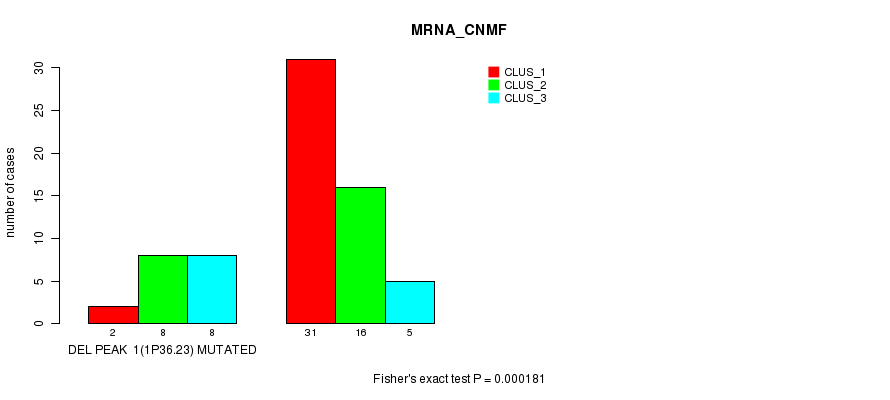
P value = 0.000181 (Fisher's exact test), Q value = 0.038
Table S30. Gene #13: 'Del Peak 1(1p36.23) mutation analysis' versus Clinical Feature #1: 'MRNA_CNMF'
| nPatients | CLUS_1 | CLUS_2 | CLUS_3 |
|---|---|---|---|
| ALL | 33 | 24 | 13 |
| DEL PEAK 1(1P36.23) MUTATED | 2 | 8 | 8 |
| DEL PEAK 1(1P36.23) WILD-TYPE | 31 | 16 | 5 |
Figure S30. Get High-res Image Gene #13: 'Del Peak 1(1p36.23) mutation analysis' versus Clinical Feature #1: 'MRNA_CNMF'
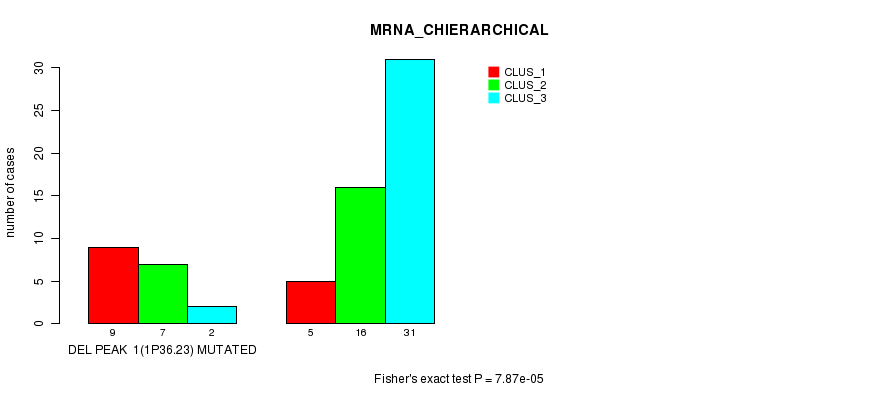
P value = 7.87e-05 (Fisher's exact test), Q value = 0.017
Table S31. Gene #13: 'Del Peak 1(1p36.23) mutation analysis' versus Clinical Feature #2: 'MRNA_CHIERARCHICAL'
| nPatients | CLUS_1 | CLUS_2 | CLUS_3 |
|---|---|---|---|
| ALL | 14 | 23 | 33 |
| DEL PEAK 1(1P36.23) MUTATED | 9 | 7 | 2 |
| DEL PEAK 1(1P36.23) WILD-TYPE | 5 | 16 | 31 |
Figure S31. Get High-res Image Gene #13: 'Del Peak 1(1p36.23) mutation analysis' versus Clinical Feature #2: 'MRNA_CHIERARCHICAL'
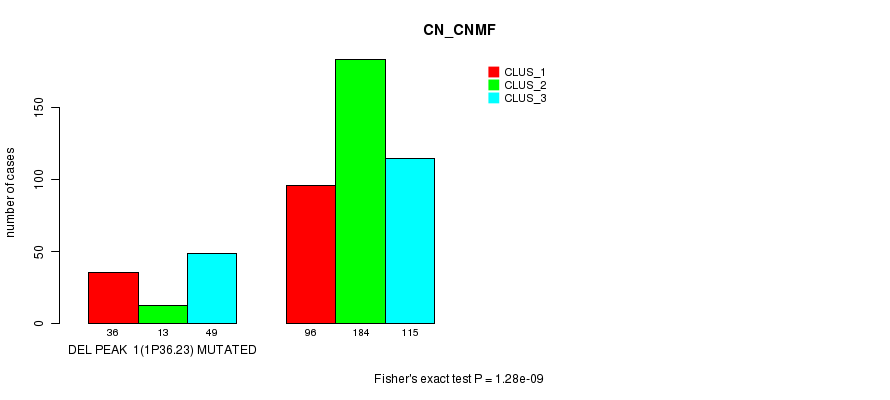
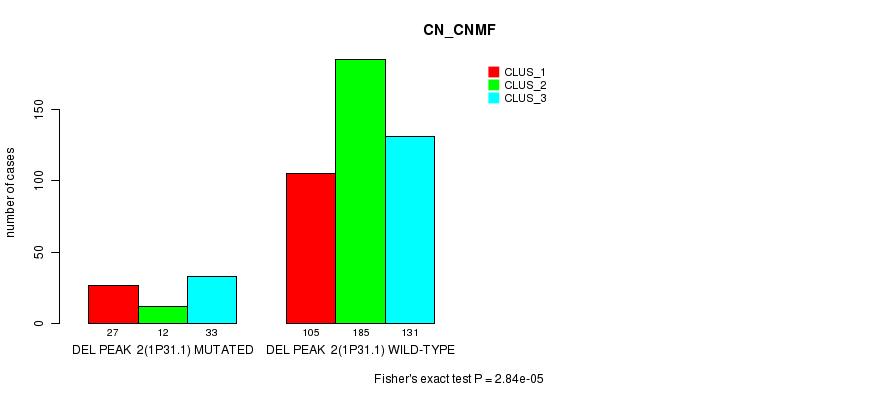
P value = 1.28e-09 (Fisher's exact test), Q value = 3.4e-07
Table S32. Gene #13: 'Del Peak 1(1p36.23) mutation analysis' versus Clinical Feature #3: 'CN_CNMF'
| nPatients | CLUS_1 | CLUS_2 | CLUS_3 |
|---|---|---|---|
| ALL | 132 | 197 | 164 |
| DEL PEAK 1(1P36.23) MUTATED | 36 | 13 | 49 |
| DEL PEAK 1(1P36.23) WILD-TYPE | 96 | 184 | 115 |
Figure S32. Get High-res Image Gene #13: 'Del Peak 1(1p36.23) mutation analysis' versus Clinical Feature #3: 'CN_CNMF'
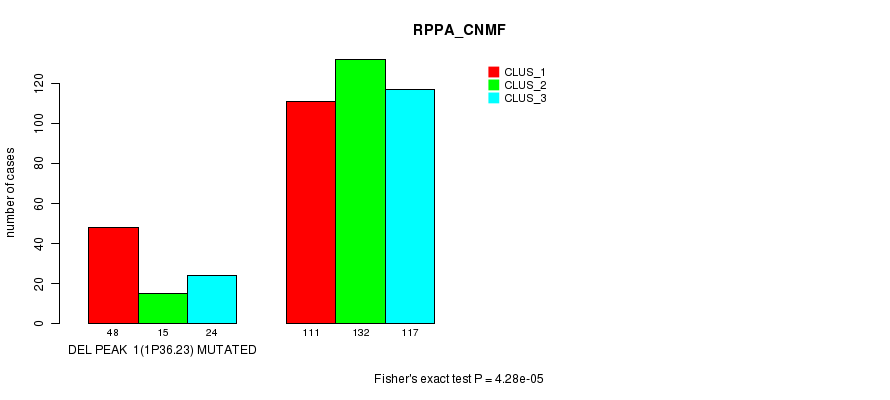
P value = 4.28e-05 (Fisher's exact test), Q value = 0.0095
Table S33. Gene #13: 'Del Peak 1(1p36.23) mutation analysis' versus Clinical Feature #5: 'RPPA_CNMF'
| nPatients | CLUS_1 | CLUS_2 | CLUS_3 |
|---|---|---|---|
| ALL | 159 | 147 | 141 |
| DEL PEAK 1(1P36.23) MUTATED | 48 | 15 | 24 |
| DEL PEAK 1(1P36.23) WILD-TYPE | 111 | 132 | 117 |
Figure S33. Get High-res Image Gene #13: 'Del Peak 1(1p36.23) mutation analysis' versus Clinical Feature #5: 'RPPA_CNMF'
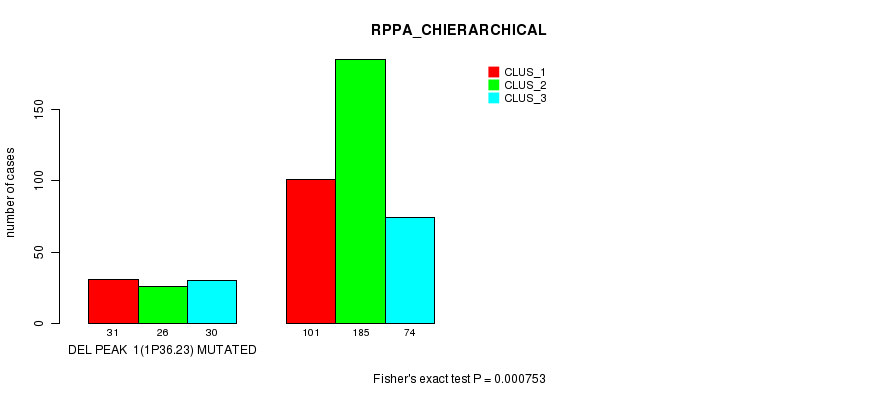
P value = 0.000753 (Fisher's exact test), Q value = 0.14
Table S34. Gene #13: 'Del Peak 1(1p36.23) mutation analysis' versus Clinical Feature #6: 'RPPA_CHIERARCHICAL'
| nPatients | CLUS_1 | CLUS_2 | CLUS_3 |
|---|---|---|---|
| ALL | 132 | 211 | 104 |
| DEL PEAK 1(1P36.23) MUTATED | 31 | 26 | 30 |
| DEL PEAK 1(1P36.23) WILD-TYPE | 101 | 185 | 74 |
Figure S34. Get High-res Image Gene #13: 'Del Peak 1(1p36.23) mutation analysis' versus Clinical Feature #6: 'RPPA_CHIERARCHICAL'
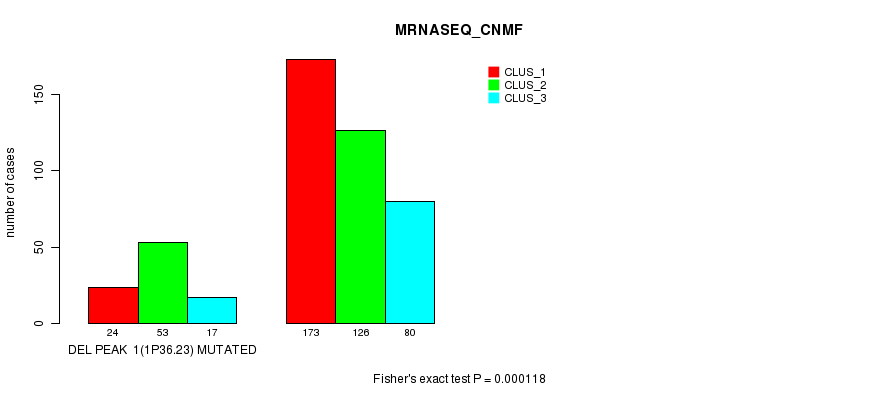
P value = 0.000118 (Fisher's exact test), Q value = 0.025
Table S35. Gene #13: 'Del Peak 1(1p36.23) mutation analysis' versus Clinical Feature #7: 'MRNASEQ_CNMF'
| nPatients | CLUS_1 | CLUS_2 | CLUS_3 |
|---|---|---|---|
| ALL | 197 | 179 | 97 |
| DEL PEAK 1(1P36.23) MUTATED | 24 | 53 | 17 |
| DEL PEAK 1(1P36.23) WILD-TYPE | 173 | 126 | 80 |
Figure S35. Get High-res Image Gene #13: 'Del Peak 1(1p36.23) mutation analysis' versus Clinical Feature #7: 'MRNASEQ_CNMF'
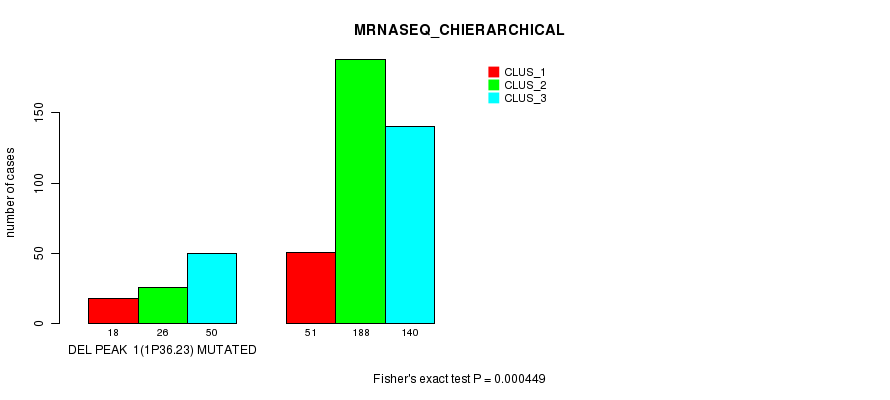
P value = 0.000449 (Fisher's exact test), Q value = 0.09
Table S36. Gene #13: 'Del Peak 1(1p36.23) mutation analysis' versus Clinical Feature #8: 'MRNASEQ_CHIERARCHICAL'
| nPatients | CLUS_1 | CLUS_2 | CLUS_3 |
|---|---|---|---|
| ALL | 69 | 214 | 190 |
| DEL PEAK 1(1P36.23) MUTATED | 18 | 26 | 50 |
| DEL PEAK 1(1P36.23) WILD-TYPE | 51 | 188 | 140 |
Figure S36. Get High-res Image Gene #13: 'Del Peak 1(1p36.23) mutation analysis' versus Clinical Feature #8: 'MRNASEQ_CHIERARCHICAL'
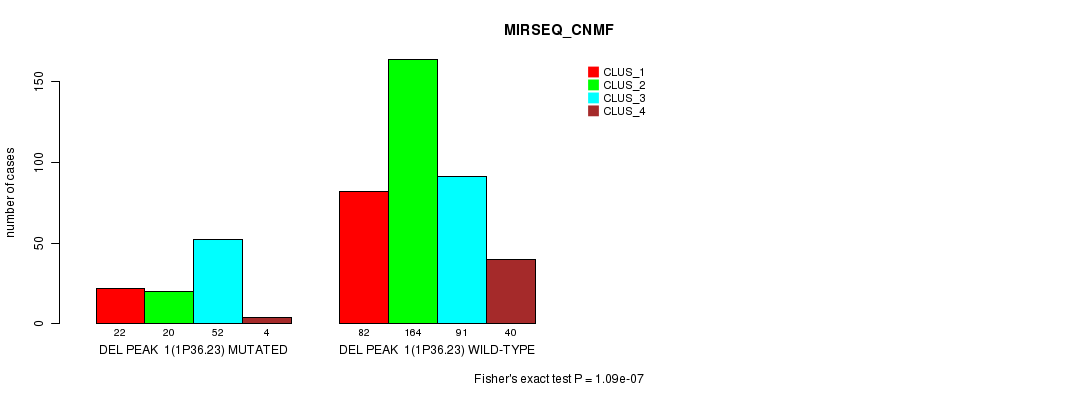
P value = 1.09e-07 (Fisher's exact test), Q value = 2.8e-05
Table S37. Gene #13: 'Del Peak 1(1p36.23) mutation analysis' versus Clinical Feature #9: 'MIRSEQ_CNMF'
| nPatients | CLUS_1 | CLUS_2 | CLUS_3 | CLUS_4 |
|---|---|---|---|---|
| ALL | 104 | 184 | 143 | 44 |
| DEL PEAK 1(1P36.23) MUTATED | 22 | 20 | 52 | 4 |
| DEL PEAK 1(1P36.23) WILD-TYPE | 82 | 164 | 91 | 40 |
Figure S37. Get High-res Image Gene #13: 'Del Peak 1(1p36.23) mutation analysis' versus Clinical Feature #9: 'MIRSEQ_CNMF'
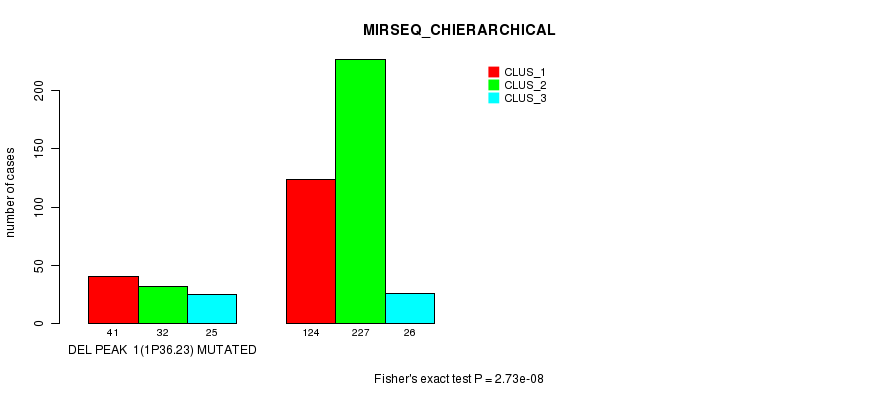
P value = 2.73e-08 (Fisher's exact test), Q value = 7.2e-06
Table S38. Gene #13: 'Del Peak 1(1p36.23) mutation analysis' versus Clinical Feature #10: 'MIRSEQ_CHIERARCHICAL'
| nPatients | CLUS_1 | CLUS_2 | CLUS_3 |
|---|---|---|---|
| ALL | 165 | 259 | 51 |
| DEL PEAK 1(1P36.23) MUTATED | 41 | 32 | 25 |
| DEL PEAK 1(1P36.23) WILD-TYPE | 124 | 227 | 26 |
Figure S38. Get High-res Image Gene #13: 'Del Peak 1(1p36.23) mutation analysis' versus Clinical Feature #10: 'MIRSEQ_CHIERARCHICAL'
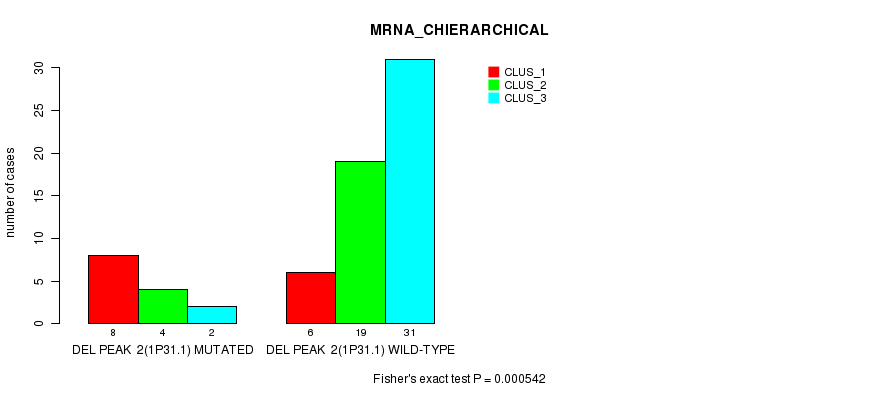
P value = 0.000542 (Fisher's exact test), Q value = 0.11
Table S39. Gene #14: 'Del Peak 2(1p31.1) mutation analysis' versus Clinical Feature #2: 'MRNA_CHIERARCHICAL'
| nPatients | CLUS_1 | CLUS_2 | CLUS_3 |
|---|---|---|---|
| ALL | 14 | 23 | 33 |
| DEL PEAK 2(1P31.1) MUTATED | 8 | 4 | 2 |
| DEL PEAK 2(1P31.1) WILD-TYPE | 6 | 19 | 31 |
Figure S39. Get High-res Image Gene #14: 'Del Peak 2(1p31.1) mutation analysis' versus Clinical Feature #2: 'MRNA_CHIERARCHICAL'
P value = 2.84e-05 (Fisher's exact test), Q value = 0.0064
Table S40. Gene #14: 'Del Peak 2(1p31.1) mutation analysis' versus Clinical Feature #3: 'CN_CNMF'
| nPatients | CLUS_1 | CLUS_2 | CLUS_3 |
|---|---|---|---|
| ALL | 132 | 197 | 164 |
| DEL PEAK 2(1P31.1) MUTATED | 27 | 12 | 33 |
| DEL PEAK 2(1P31.1) WILD-TYPE | 105 | 185 | 131 |
Figure S40. Get High-res Image Gene #14: 'Del Peak 2(1p31.1) mutation analysis' versus Clinical Feature #3: 'CN_CNMF'
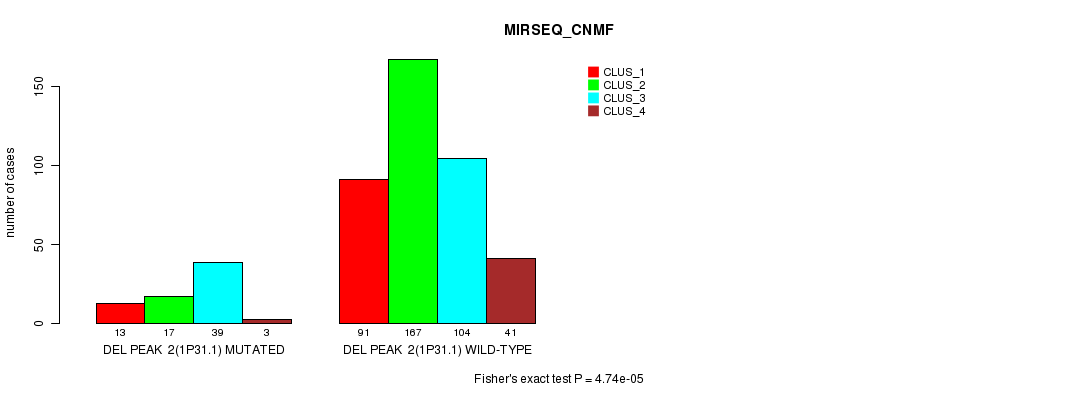
P value = 4.74e-05 (Fisher's exact test), Q value = 0.01
Table S41. Gene #14: 'Del Peak 2(1p31.1) mutation analysis' versus Clinical Feature #9: 'MIRSEQ_CNMF'
| nPatients | CLUS_1 | CLUS_2 | CLUS_3 | CLUS_4 |
|---|---|---|---|---|
| ALL | 104 | 184 | 143 | 44 |
| DEL PEAK 2(1P31.1) MUTATED | 13 | 17 | 39 | 3 |
| DEL PEAK 2(1P31.1) WILD-TYPE | 91 | 167 | 104 | 41 |
Figure S41. Get High-res Image Gene #14: 'Del Peak 2(1p31.1) mutation analysis' versus Clinical Feature #9: 'MIRSEQ_CNMF'
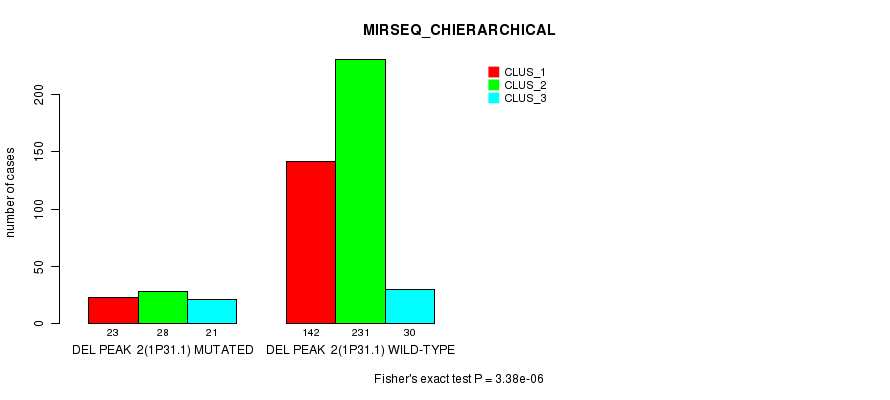
P value = 3.38e-06 (Fisher's exact test), Q value = 0.00081
Table S42. Gene #14: 'Del Peak 2(1p31.1) mutation analysis' versus Clinical Feature #10: 'MIRSEQ_CHIERARCHICAL'
| nPatients | CLUS_1 | CLUS_2 | CLUS_3 |
|---|---|---|---|
| ALL | 165 | 259 | 51 |
| DEL PEAK 2(1P31.1) MUTATED | 23 | 28 | 21 |
| DEL PEAK 2(1P31.1) WILD-TYPE | 142 | 231 | 30 |
Figure S42. Get High-res Image Gene #14: 'Del Peak 2(1p31.1) mutation analysis' versus Clinical Feature #10: 'MIRSEQ_CHIERARCHICAL'
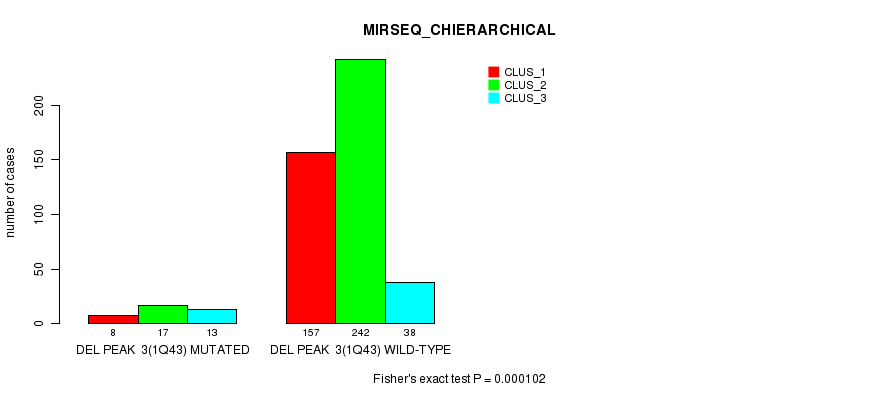
P value = 0.000102 (Fisher's exact test), Q value = 0.022
Table S43. Gene #15: 'Del Peak 3(1q43) mutation analysis' versus Clinical Feature #10: 'MIRSEQ_CHIERARCHICAL'
| nPatients | CLUS_1 | CLUS_2 | CLUS_3 |
|---|---|---|---|
| ALL | 165 | 259 | 51 |
| DEL PEAK 3(1Q43) MUTATED | 8 | 17 | 13 |
| DEL PEAK 3(1Q43) WILD-TYPE | 157 | 242 | 38 |
Figure S43. Get High-res Image Gene #15: 'Del Peak 3(1q43) mutation analysis' versus Clinical Feature #10: 'MIRSEQ_CHIERARCHICAL'
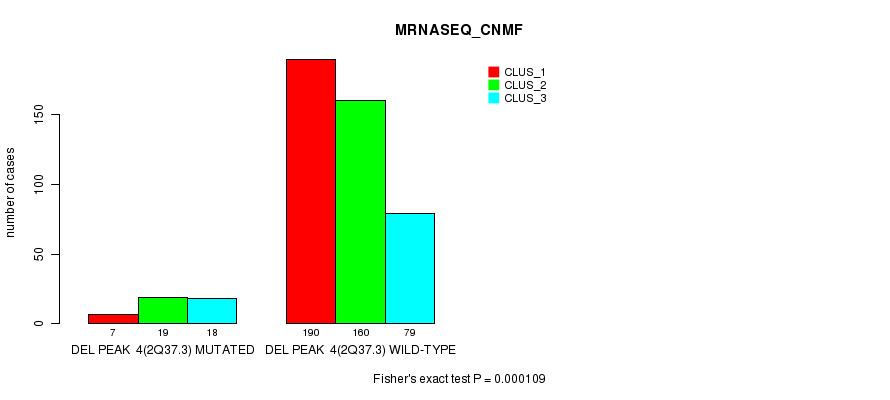
P value = 0.000109 (Fisher's exact test), Q value = 0.023
Table S44. Gene #16: 'Del Peak 4(2q37.3) mutation analysis' versus Clinical Feature #7: 'MRNASEQ_CNMF'
| nPatients | CLUS_1 | CLUS_2 | CLUS_3 |
|---|---|---|---|
| ALL | 197 | 179 | 97 |
| DEL PEAK 4(2Q37.3) MUTATED | 7 | 19 | 18 |
| DEL PEAK 4(2Q37.3) WILD-TYPE | 190 | 160 | 79 |
Figure S44. Get High-res Image Gene #16: 'Del Peak 4(2q37.3) mutation analysis' versus Clinical Feature #7: 'MRNASEQ_CNMF'
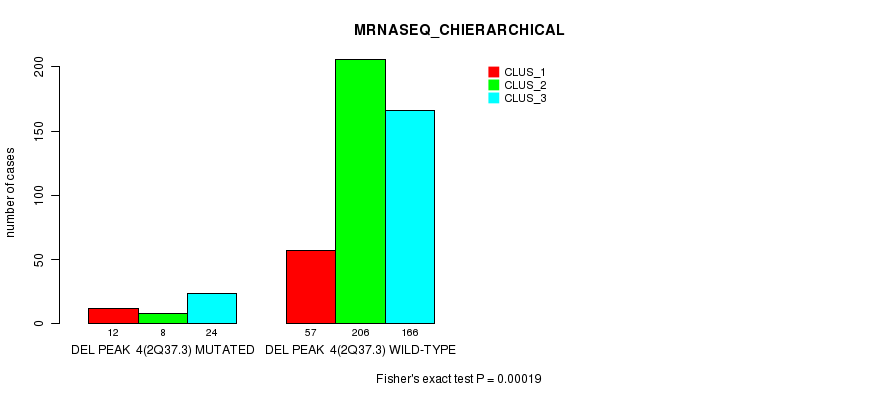
P value = 0.00019 (Fisher's exact test), Q value = 0.039
Table S45. Gene #16: 'Del Peak 4(2q37.3) mutation analysis' versus Clinical Feature #8: 'MRNASEQ_CHIERARCHICAL'
| nPatients | CLUS_1 | CLUS_2 | CLUS_3 |
|---|---|---|---|
| ALL | 69 | 214 | 190 |
| DEL PEAK 4(2Q37.3) MUTATED | 12 | 8 | 24 |
| DEL PEAK 4(2Q37.3) WILD-TYPE | 57 | 206 | 166 |
Figure S45. Get High-res Image Gene #16: 'Del Peak 4(2q37.3) mutation analysis' versus Clinical Feature #8: 'MRNASEQ_CHIERARCHICAL'
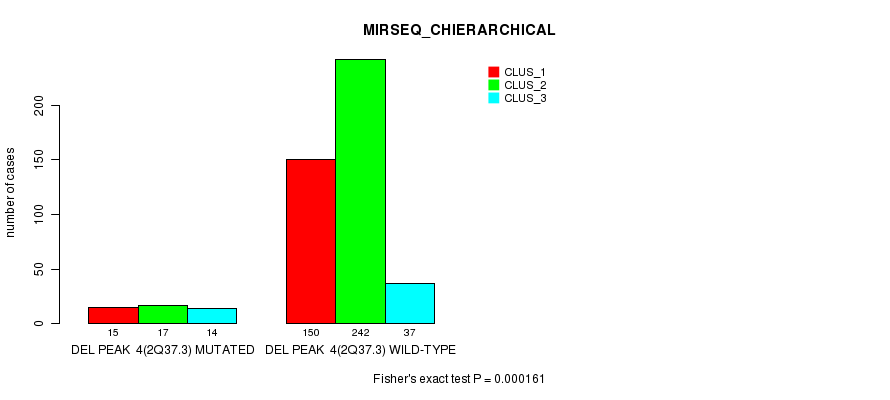
P value = 0.000161 (Fisher's exact test), Q value = 0.034
Table S46. Gene #16: 'Del Peak 4(2q37.3) mutation analysis' versus Clinical Feature #10: 'MIRSEQ_CHIERARCHICAL'
| nPatients | CLUS_1 | CLUS_2 | CLUS_3 |
|---|---|---|---|
| ALL | 165 | 259 | 51 |
| DEL PEAK 4(2Q37.3) MUTATED | 15 | 17 | 14 |
| DEL PEAK 4(2Q37.3) WILD-TYPE | 150 | 242 | 37 |
Figure S46. Get High-res Image Gene #16: 'Del Peak 4(2q37.3) mutation analysis' versus Clinical Feature #10: 'MIRSEQ_CHIERARCHICAL'
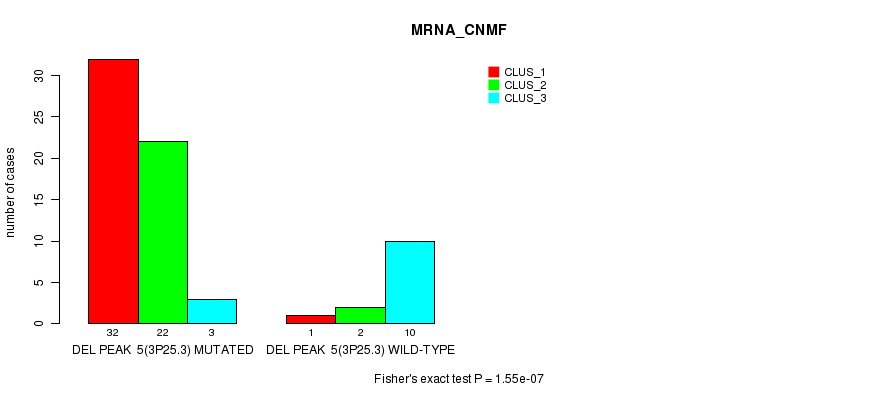
P value = 1.55e-07 (Fisher's exact test), Q value = 4e-05
Table S47. Gene #17: 'Del Peak 5(3p25.3) mutation analysis' versus Clinical Feature #1: 'MRNA_CNMF'
| nPatients | CLUS_1 | CLUS_2 | CLUS_3 |
|---|---|---|---|
| ALL | 33 | 24 | 13 |
| DEL PEAK 5(3P25.3) MUTATED | 32 | 22 | 3 |
| DEL PEAK 5(3P25.3) WILD-TYPE | 1 | 2 | 10 |
Figure S47. Get High-res Image Gene #17: 'Del Peak 5(3p25.3) mutation analysis' versus Clinical Feature #1: 'MRNA_CNMF'
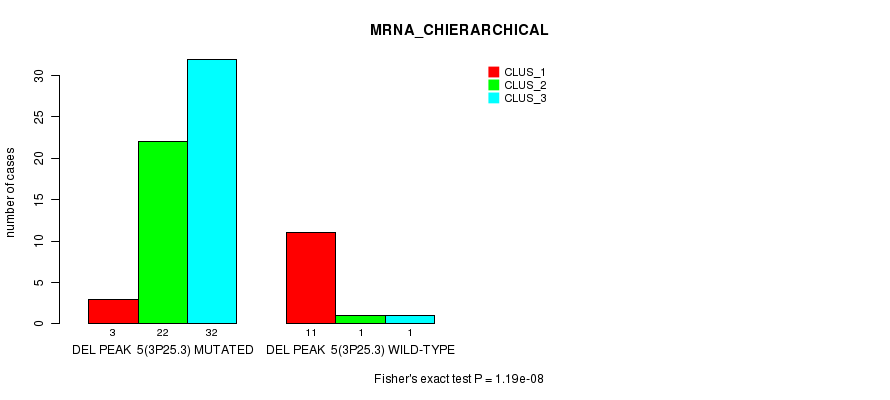
P value = 1.19e-08 (Fisher's exact test), Q value = 3.2e-06
Table S48. Gene #17: 'Del Peak 5(3p25.3) mutation analysis' versus Clinical Feature #2: 'MRNA_CHIERARCHICAL'
| nPatients | CLUS_1 | CLUS_2 | CLUS_3 |
|---|---|---|---|
| ALL | 14 | 23 | 33 |
| DEL PEAK 5(3P25.3) MUTATED | 3 | 22 | 32 |
| DEL PEAK 5(3P25.3) WILD-TYPE | 11 | 1 | 1 |
Figure S48. Get High-res Image Gene #17: 'Del Peak 5(3p25.3) mutation analysis' versus Clinical Feature #2: 'MRNA_CHIERARCHICAL'
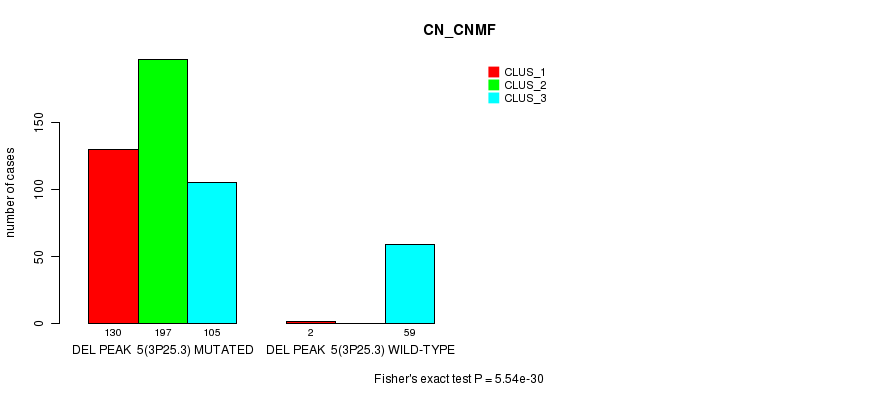
P value = 5.54e-30 (Fisher's exact test), Q value = 1.6e-27
Table S49. Gene #17: 'Del Peak 5(3p25.3) mutation analysis' versus Clinical Feature #3: 'CN_CNMF'
| nPatients | CLUS_1 | CLUS_2 | CLUS_3 |
|---|---|---|---|
| ALL | 132 | 197 | 164 |
| DEL PEAK 5(3P25.3) MUTATED | 130 | 197 | 105 |
| DEL PEAK 5(3P25.3) WILD-TYPE | 2 | 0 | 59 |
Figure S49. Get High-res Image Gene #17: 'Del Peak 5(3p25.3) mutation analysis' versus Clinical Feature #3: 'CN_CNMF'
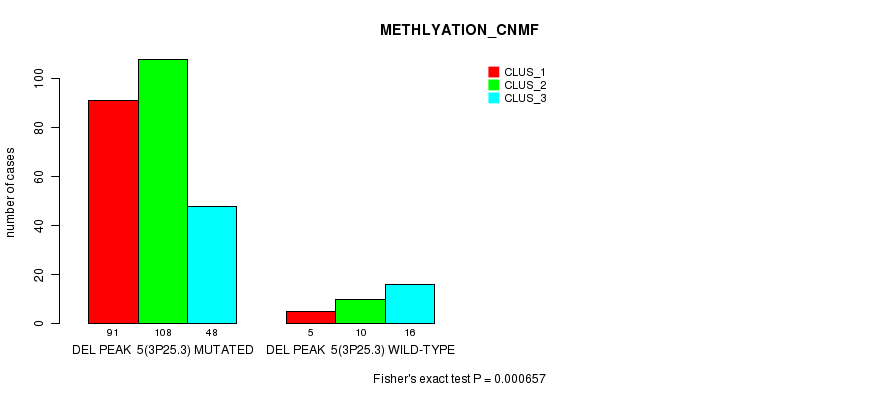
P value = 0.000657 (Fisher's exact test), Q value = 0.13
Table S50. Gene #17: 'Del Peak 5(3p25.3) mutation analysis' versus Clinical Feature #4: 'METHLYATION_CNMF'
| nPatients | CLUS_1 | CLUS_2 | CLUS_3 |
|---|---|---|---|
| ALL | 96 | 118 | 64 |
| DEL PEAK 5(3P25.3) MUTATED | 91 | 108 | 48 |
| DEL PEAK 5(3P25.3) WILD-TYPE | 5 | 10 | 16 |
Figure S50. Get High-res Image Gene #17: 'Del Peak 5(3p25.3) mutation analysis' versus Clinical Feature #4: 'METHLYATION_CNMF'
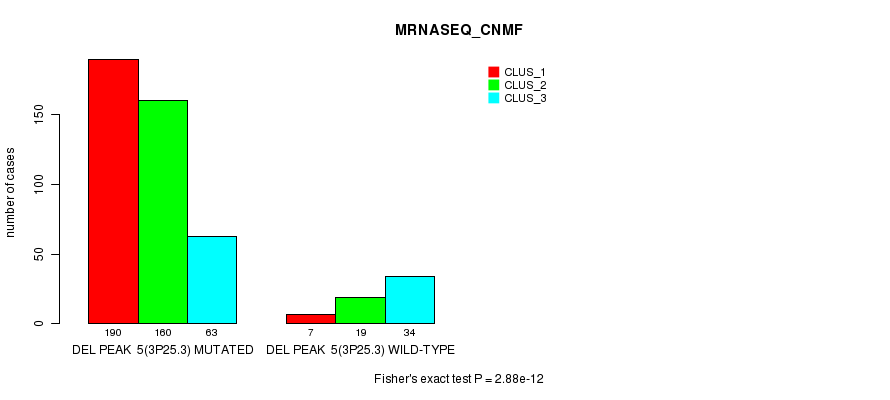
P value = 2.88e-12 (Fisher's exact test), Q value = 7.9e-10
Table S51. Gene #17: 'Del Peak 5(3p25.3) mutation analysis' versus Clinical Feature #7: 'MRNASEQ_CNMF'
| nPatients | CLUS_1 | CLUS_2 | CLUS_3 |
|---|---|---|---|
| ALL | 197 | 179 | 97 |
| DEL PEAK 5(3P25.3) MUTATED | 190 | 160 | 63 |
| DEL PEAK 5(3P25.3) WILD-TYPE | 7 | 19 | 34 |
Figure S51. Get High-res Image Gene #17: 'Del Peak 5(3p25.3) mutation analysis' versus Clinical Feature #7: 'MRNASEQ_CNMF'
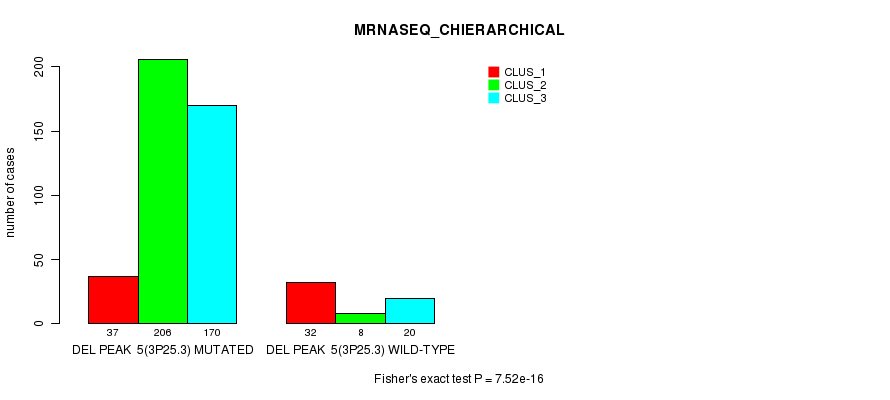
P value = 7.52e-16 (Fisher's exact test), Q value = 2.1e-13
Table S52. Gene #17: 'Del Peak 5(3p25.3) mutation analysis' versus Clinical Feature #8: 'MRNASEQ_CHIERARCHICAL'
| nPatients | CLUS_1 | CLUS_2 | CLUS_3 |
|---|---|---|---|
| ALL | 69 | 214 | 190 |
| DEL PEAK 5(3P25.3) MUTATED | 37 | 206 | 170 |
| DEL PEAK 5(3P25.3) WILD-TYPE | 32 | 8 | 20 |
Figure S52. Get High-res Image Gene #17: 'Del Peak 5(3p25.3) mutation analysis' versus Clinical Feature #8: 'MRNASEQ_CHIERARCHICAL'
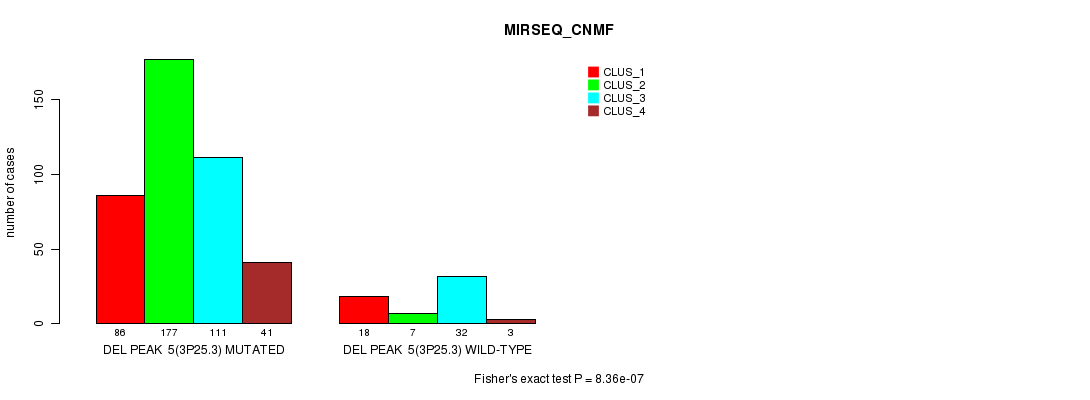
P value = 8.36e-07 (Fisher's exact test), Q value = 0.00021
Table S53. Gene #17: 'Del Peak 5(3p25.3) mutation analysis' versus Clinical Feature #9: 'MIRSEQ_CNMF'
| nPatients | CLUS_1 | CLUS_2 | CLUS_3 | CLUS_4 |
|---|---|---|---|---|
| ALL | 104 | 184 | 143 | 44 |
| DEL PEAK 5(3P25.3) MUTATED | 86 | 177 | 111 | 41 |
| DEL PEAK 5(3P25.3) WILD-TYPE | 18 | 7 | 32 | 3 |
Figure S53. Get High-res Image Gene #17: 'Del Peak 5(3p25.3) mutation analysis' versus Clinical Feature #9: 'MIRSEQ_CNMF'
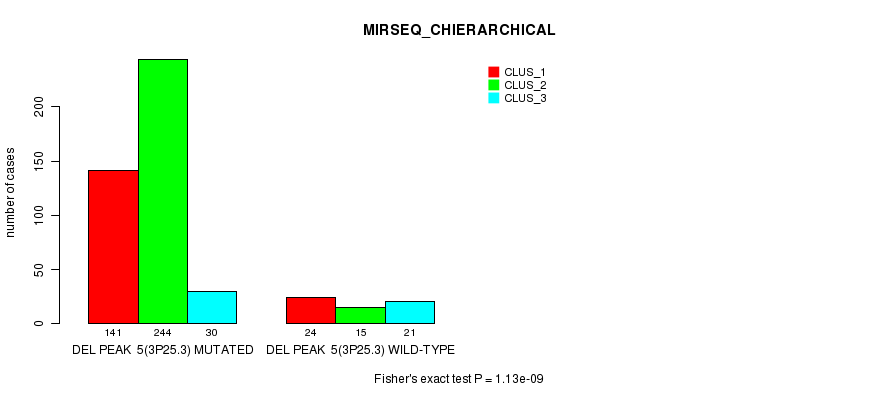
P value = 1.13e-09 (Fisher's exact test), Q value = 3.1e-07
Table S54. Gene #17: 'Del Peak 5(3p25.3) mutation analysis' versus Clinical Feature #10: 'MIRSEQ_CHIERARCHICAL'
| nPatients | CLUS_1 | CLUS_2 | CLUS_3 |
|---|---|---|---|
| ALL | 165 | 259 | 51 |
| DEL PEAK 5(3P25.3) MUTATED | 141 | 244 | 30 |
| DEL PEAK 5(3P25.3) WILD-TYPE | 24 | 15 | 21 |
Figure S54. Get High-res Image Gene #17: 'Del Peak 5(3p25.3) mutation analysis' versus Clinical Feature #10: 'MIRSEQ_CHIERARCHICAL'
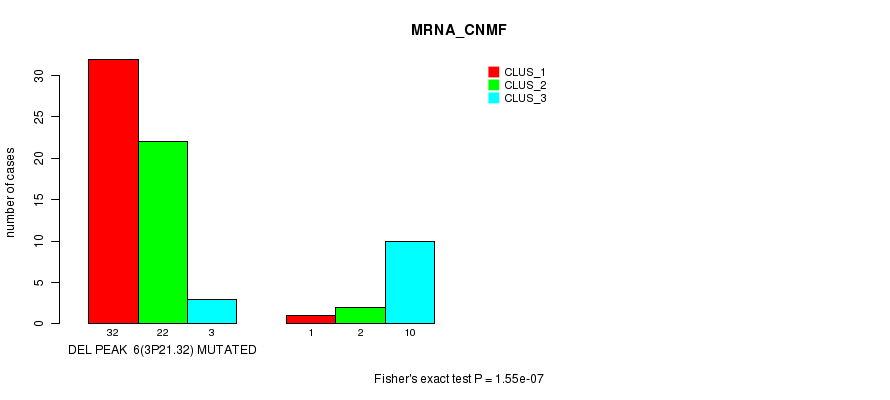
P value = 1.55e-07 (Fisher's exact test), Q value = 4e-05
Table S55. Gene #18: 'Del Peak 6(3p21.32) mutation analysis' versus Clinical Feature #1: 'MRNA_CNMF'
| nPatients | CLUS_1 | CLUS_2 | CLUS_3 |
|---|---|---|---|
| ALL | 33 | 24 | 13 |
| DEL PEAK 6(3P21.32) MUTATED | 32 | 22 | 3 |
| DEL PEAK 6(3P21.32) WILD-TYPE | 1 | 2 | 10 |
Figure S55. Get High-res Image Gene #18: 'Del Peak 6(3p21.32) mutation analysis' versus Clinical Feature #1: 'MRNA_CNMF'
P value = 1.19e-08 (Fisher's exact test), Q value = 3.2e-06
Table S56. Gene #18: 'Del Peak 6(3p21.32) mutation analysis' versus Clinical Feature #2: 'MRNA_CHIERARCHICAL'
| nPatients | CLUS_1 | CLUS_2 | CLUS_3 |
|---|---|---|---|
| ALL | 14 | 23 | 33 |
| DEL PEAK 6(3P21.32) MUTATED | 3 | 22 | 32 |
| DEL PEAK 6(3P21.32) WILD-TYPE | 11 | 1 | 1 |
Figure S56. Get High-res Image Gene #18: 'Del Peak 6(3p21.32) mutation analysis' versus Clinical Feature #2: 'MRNA_CHIERARCHICAL'
P value = 1.74e-29 (Fisher's exact test), Q value = 5.1e-27
Table S57. Gene #18: 'Del Peak 6(3p21.32) mutation analysis' versus Clinical Feature #3: 'CN_CNMF'
| nPatients | CLUS_1 | CLUS_2 | CLUS_3 |
|---|---|---|---|
| ALL | 132 | 197 | 164 |
| DEL PEAK 6(3P21.32) MUTATED | 132 | 196 | 107 |
| DEL PEAK 6(3P21.32) WILD-TYPE | 0 | 1 | 57 |
Figure S57. Get High-res Image Gene #18: 'Del Peak 6(3p21.32) mutation analysis' versus Clinical Feature #3: 'CN_CNMF'
P value = 0.000819 (Fisher's exact test), Q value = 0.15
Table S58. Gene #18: 'Del Peak 6(3p21.32) mutation analysis' versus Clinical Feature #6: 'RPPA_CHIERARCHICAL'
| nPatients | CLUS_1 | CLUS_2 | CLUS_3 |
|---|---|---|---|
| ALL | 132 | 211 | 104 |
| DEL PEAK 6(3P21.32) MUTATED | 124 | 193 | 82 |
| DEL PEAK 6(3P21.32) WILD-TYPE | 8 | 18 | 22 |
Figure S58. Get High-res Image Gene #18: 'Del Peak 6(3p21.32) mutation analysis' versus Clinical Feature #6: 'RPPA_CHIERARCHICAL'
P value = 1.15e-13 (Fisher's exact test), Q value = 3.2e-11
Table S59. Gene #18: 'Del Peak 6(3p21.32) mutation analysis' versus Clinical Feature #7: 'MRNASEQ_CNMF'
| nPatients | CLUS_1 | CLUS_2 | CLUS_3 |
|---|---|---|---|
| ALL | 197 | 179 | 97 |
| DEL PEAK 6(3P21.32) MUTATED | 192 | 161 | 63 |
| DEL PEAK 6(3P21.32) WILD-TYPE | 5 | 18 | 34 |
Figure S59. Get High-res Image Gene #18: 'Del Peak 6(3p21.32) mutation analysis' versus Clinical Feature #7: 'MRNASEQ_CNMF'
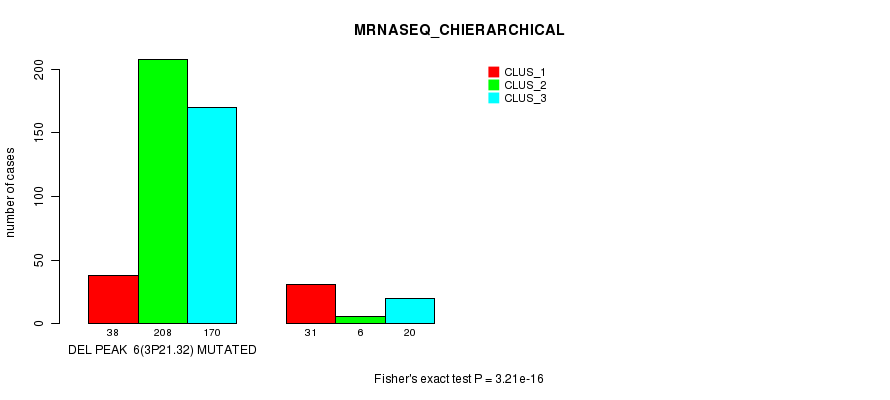
P value = 3.21e-16 (Fisher's exact test), Q value = 9.1e-14
Table S60. Gene #18: 'Del Peak 6(3p21.32) mutation analysis' versus Clinical Feature #8: 'MRNASEQ_CHIERARCHICAL'
| nPatients | CLUS_1 | CLUS_2 | CLUS_3 |
|---|---|---|---|
| ALL | 69 | 214 | 190 |
| DEL PEAK 6(3P21.32) MUTATED | 38 | 208 | 170 |
| DEL PEAK 6(3P21.32) WILD-TYPE | 31 | 6 | 20 |
Figure S60. Get High-res Image Gene #18: 'Del Peak 6(3p21.32) mutation analysis' versus Clinical Feature #8: 'MRNASEQ_CHIERARCHICAL'
P value = 2.3e-06 (Fisher's exact test), Q value = 0.00055
Table S61. Gene #18: 'Del Peak 6(3p21.32) mutation analysis' versus Clinical Feature #9: 'MIRSEQ_CNMF'
| nPatients | CLUS_1 | CLUS_2 | CLUS_3 | CLUS_4 |
|---|---|---|---|---|
| ALL | 104 | 184 | 143 | 44 |
| DEL PEAK 6(3P21.32) MUTATED | 86 | 178 | 114 | 40 |
| DEL PEAK 6(3P21.32) WILD-TYPE | 18 | 6 | 29 | 4 |
Figure S61. Get High-res Image Gene #18: 'Del Peak 6(3p21.32) mutation analysis' versus Clinical Feature #9: 'MIRSEQ_CNMF'

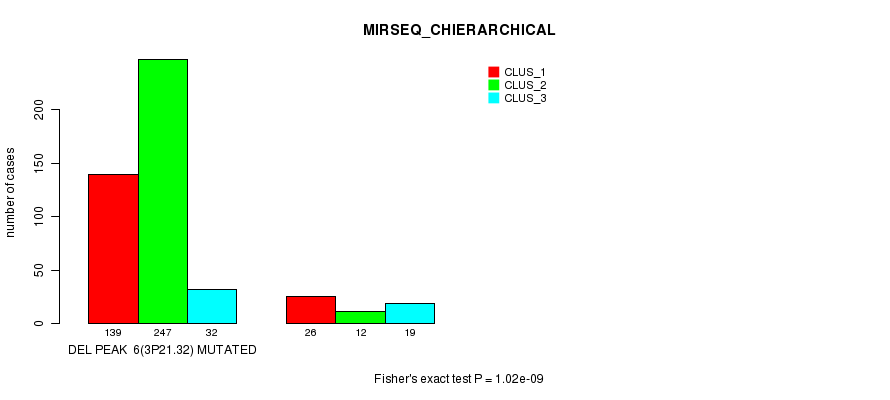
P value = 1.02e-09 (Fisher's exact test), Q value = 2.8e-07
Table S62. Gene #18: 'Del Peak 6(3p21.32) mutation analysis' versus Clinical Feature #10: 'MIRSEQ_CHIERARCHICAL'
| nPatients | CLUS_1 | CLUS_2 | CLUS_3 |
|---|---|---|---|
| ALL | 165 | 259 | 51 |
| DEL PEAK 6(3P21.32) MUTATED | 139 | 247 | 32 |
| DEL PEAK 6(3P21.32) WILD-TYPE | 26 | 12 | 19 |
Figure S62. Get High-res Image Gene #18: 'Del Peak 6(3p21.32) mutation analysis' versus Clinical Feature #10: 'MIRSEQ_CHIERARCHICAL'
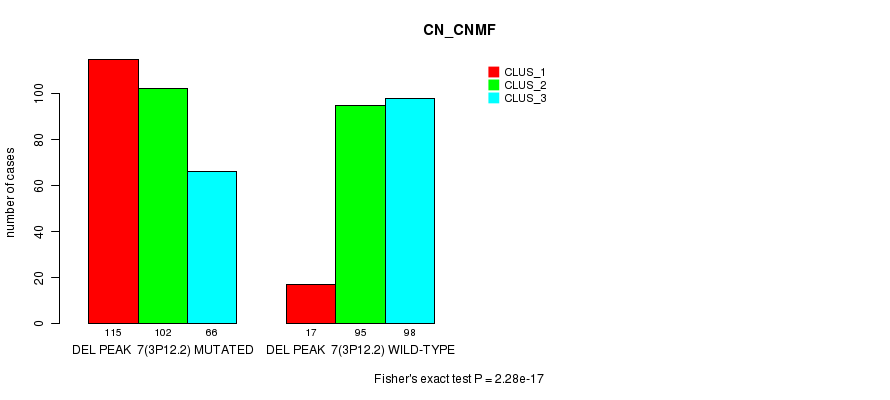
P value = 2.28e-17 (Fisher's exact test), Q value = 6.5e-15
Table S63. Gene #19: 'Del Peak 7(3p12.2) mutation analysis' versus Clinical Feature #3: 'CN_CNMF'
| nPatients | CLUS_1 | CLUS_2 | CLUS_3 |
|---|---|---|---|
| ALL | 132 | 197 | 164 |
| DEL PEAK 7(3P12.2) MUTATED | 115 | 102 | 66 |
| DEL PEAK 7(3P12.2) WILD-TYPE | 17 | 95 | 98 |
Figure S63. Get High-res Image Gene #19: 'Del Peak 7(3p12.2) mutation analysis' versus Clinical Feature #3: 'CN_CNMF'
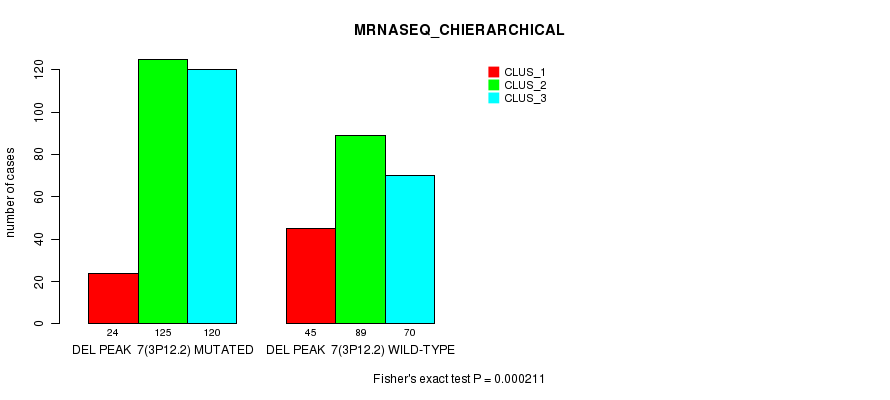
P value = 0.000211 (Fisher's exact test), Q value = 0.043
Table S64. Gene #19: 'Del Peak 7(3p12.2) mutation analysis' versus Clinical Feature #8: 'MRNASEQ_CHIERARCHICAL'
| nPatients | CLUS_1 | CLUS_2 | CLUS_3 |
|---|---|---|---|
| ALL | 69 | 214 | 190 |
| DEL PEAK 7(3P12.2) MUTATED | 24 | 125 | 120 |
| DEL PEAK 7(3P12.2) WILD-TYPE | 45 | 89 | 70 |
Figure S64. Get High-res Image Gene #19: 'Del Peak 7(3p12.2) mutation analysis' versus Clinical Feature #8: 'MRNASEQ_CHIERARCHICAL'
P value = 0.000919 (Fisher's exact test), Q value = 0.17
Table S65. Gene #20: 'Del Peak 8(3q11.2) mutation analysis' versus Clinical Feature #3: 'CN_CNMF'
| nPatients | CLUS_1 | CLUS_2 | CLUS_3 |
|---|---|---|---|
| ALL | 132 | 197 | 164 |
| DEL PEAK 8(3Q11.2) MUTATED | 57 | 54 | 39 |
| DEL PEAK 8(3Q11.2) WILD-TYPE | 75 | 143 | 125 |
Figure S65. Get High-res Image Gene #20: 'Del Peak 8(3q11.2) mutation analysis' versus Clinical Feature #3: 'CN_CNMF'
P value = 5.47e-09 (Fisher's exact test), Q value = 1.5e-06
Table S66. Gene #21: 'Del Peak 9(4q34.3) mutation analysis' versus Clinical Feature #3: 'CN_CNMF'
| nPatients | CLUS_1 | CLUS_2 | CLUS_3 |
|---|---|---|---|
| ALL | 132 | 197 | 164 |
| DEL PEAK 9(4Q34.3) MUTATED | 37 | 9 | 30 |
| DEL PEAK 9(4Q34.3) WILD-TYPE | 95 | 188 | 134 |
Figure S66. Get High-res Image Gene #21: 'Del Peak 9(4q34.3) mutation analysis' versus Clinical Feature #3: 'CN_CNMF'
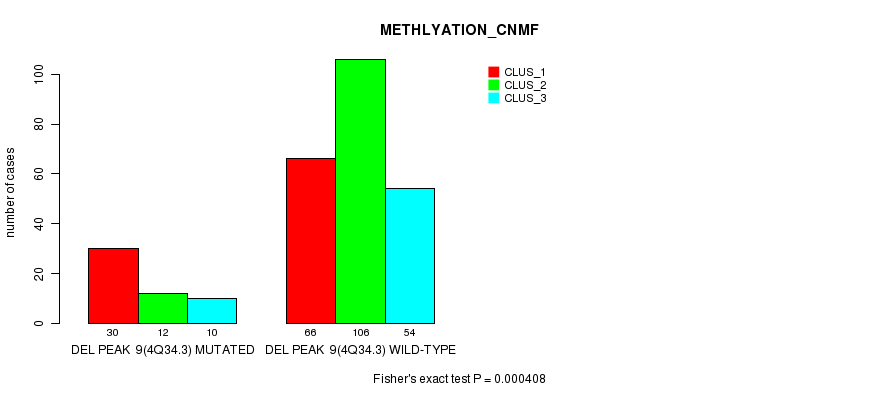
P value = 0.000408 (Fisher's exact test), Q value = 0.083
Table S67. Gene #21: 'Del Peak 9(4q34.3) mutation analysis' versus Clinical Feature #4: 'METHLYATION_CNMF'
| nPatients | CLUS_1 | CLUS_2 | CLUS_3 |
|---|---|---|---|
| ALL | 96 | 118 | 64 |
| DEL PEAK 9(4Q34.3) MUTATED | 30 | 12 | 10 |
| DEL PEAK 9(4Q34.3) WILD-TYPE | 66 | 106 | 54 |
Figure S67. Get High-res Image Gene #21: 'Del Peak 9(4q34.3) mutation analysis' versus Clinical Feature #4: 'METHLYATION_CNMF'
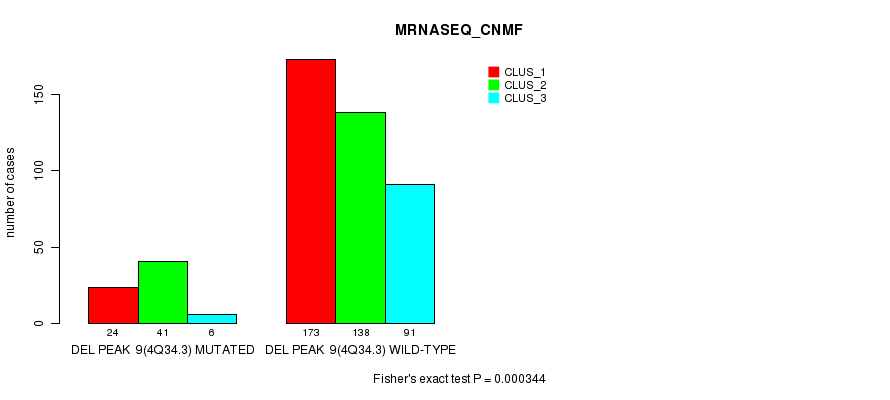
P value = 0.000344 (Fisher's exact test), Q value = 0.07
Table S68. Gene #21: 'Del Peak 9(4q34.3) mutation analysis' versus Clinical Feature #7: 'MRNASEQ_CNMF'
| nPatients | CLUS_1 | CLUS_2 | CLUS_3 |
|---|---|---|---|
| ALL | 197 | 179 | 97 |
| DEL PEAK 9(4Q34.3) MUTATED | 24 | 41 | 6 |
| DEL PEAK 9(4Q34.3) WILD-TYPE | 173 | 138 | 91 |
Figure S68. Get High-res Image Gene #21: 'Del Peak 9(4q34.3) mutation analysis' versus Clinical Feature #7: 'MRNASEQ_CNMF'
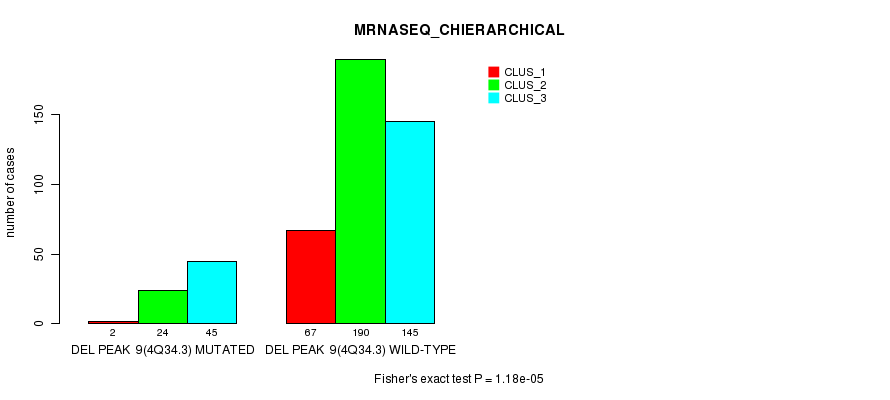
P value = 1.18e-05 (Fisher's exact test), Q value = 0.0027
Table S69. Gene #21: 'Del Peak 9(4q34.3) mutation analysis' versus Clinical Feature #8: 'MRNASEQ_CHIERARCHICAL'
| nPatients | CLUS_1 | CLUS_2 | CLUS_3 |
|---|---|---|---|
| ALL | 69 | 214 | 190 |
| DEL PEAK 9(4Q34.3) MUTATED | 2 | 24 | 45 |
| DEL PEAK 9(4Q34.3) WILD-TYPE | 67 | 190 | 145 |
Figure S69. Get High-res Image Gene #21: 'Del Peak 9(4q34.3) mutation analysis' versus Clinical Feature #8: 'MRNASEQ_CHIERARCHICAL'
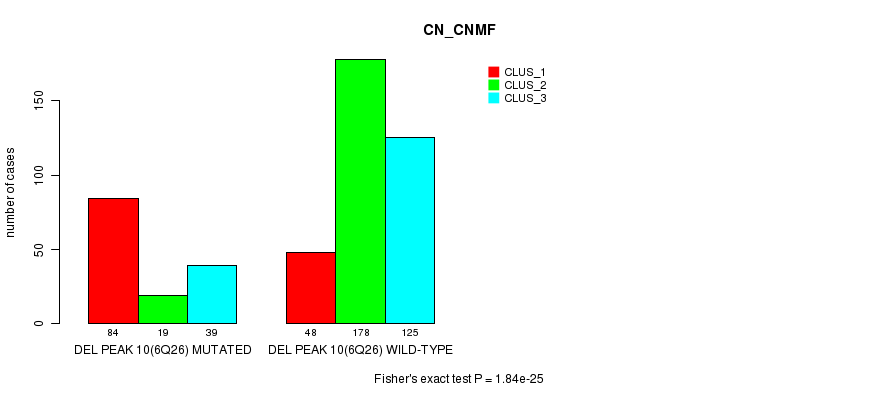
P value = 1.84e-25 (Fisher's exact test), Q value = 5.4e-23
Table S70. Gene #22: 'Del Peak 10(6q26) mutation analysis' versus Clinical Feature #3: 'CN_CNMF'
| nPatients | CLUS_1 | CLUS_2 | CLUS_3 |
|---|---|---|---|
| ALL | 132 | 197 | 164 |
| DEL PEAK 10(6Q26) MUTATED | 84 | 19 | 39 |
| DEL PEAK 10(6Q26) WILD-TYPE | 48 | 178 | 125 |
Figure S70. Get High-res Image Gene #22: 'Del Peak 10(6q26) mutation analysis' versus Clinical Feature #3: 'CN_CNMF'
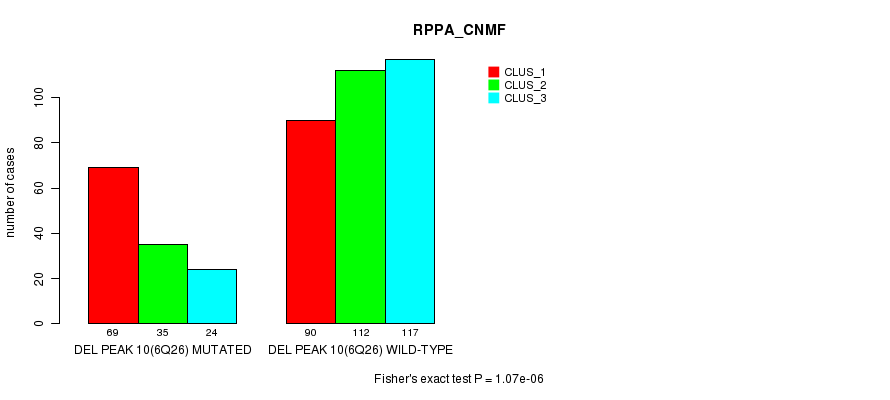
P value = 1.07e-06 (Fisher's exact test), Q value = 0.00026
Table S71. Gene #22: 'Del Peak 10(6q26) mutation analysis' versus Clinical Feature #5: 'RPPA_CNMF'
| nPatients | CLUS_1 | CLUS_2 | CLUS_3 |
|---|---|---|---|
| ALL | 159 | 147 | 141 |
| DEL PEAK 10(6Q26) MUTATED | 69 | 35 | 24 |
| DEL PEAK 10(6Q26) WILD-TYPE | 90 | 112 | 117 |
Figure S71. Get High-res Image Gene #22: 'Del Peak 10(6q26) mutation analysis' versus Clinical Feature #5: 'RPPA_CNMF'
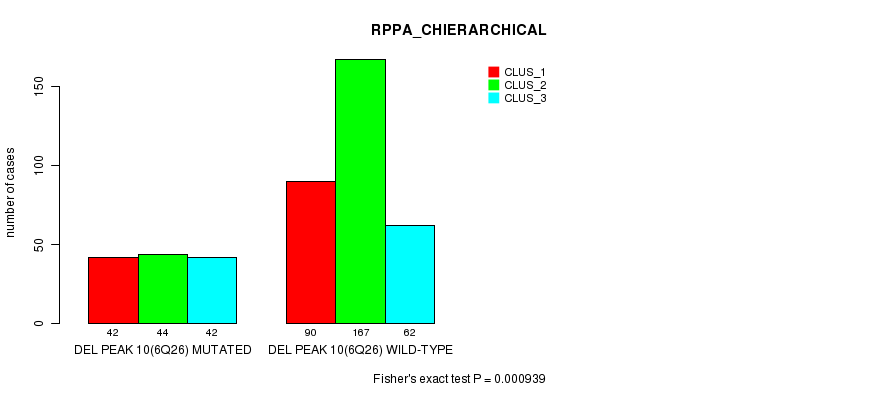
P value = 0.000939 (Fisher's exact test), Q value = 0.17
Table S72. Gene #22: 'Del Peak 10(6q26) mutation analysis' versus Clinical Feature #6: 'RPPA_CHIERARCHICAL'
| nPatients | CLUS_1 | CLUS_2 | CLUS_3 |
|---|---|---|---|
| ALL | 132 | 211 | 104 |
| DEL PEAK 10(6Q26) MUTATED | 42 | 44 | 42 |
| DEL PEAK 10(6Q26) WILD-TYPE | 90 | 167 | 62 |
Figure S72. Get High-res Image Gene #22: 'Del Peak 10(6q26) mutation analysis' versus Clinical Feature #6: 'RPPA_CHIERARCHICAL'
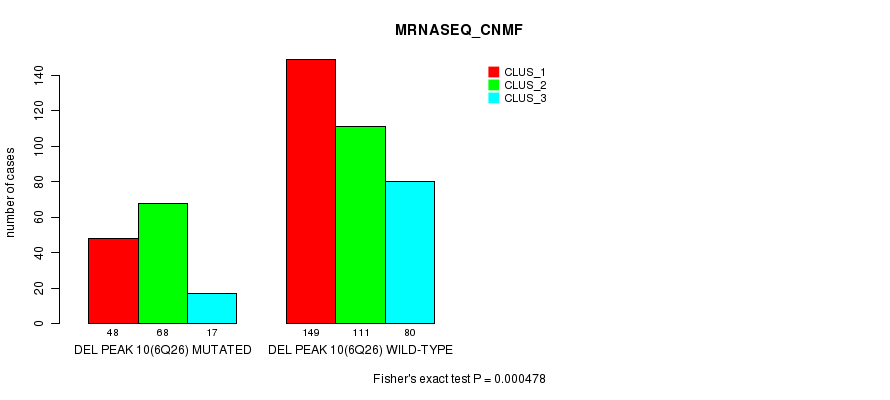
P value = 0.000478 (Fisher's exact test), Q value = 0.096
Table S73. Gene #22: 'Del Peak 10(6q26) mutation analysis' versus Clinical Feature #7: 'MRNASEQ_CNMF'
| nPatients | CLUS_1 | CLUS_2 | CLUS_3 |
|---|---|---|---|
| ALL | 197 | 179 | 97 |
| DEL PEAK 10(6Q26) MUTATED | 48 | 68 | 17 |
| DEL PEAK 10(6Q26) WILD-TYPE | 149 | 111 | 80 |
Figure S73. Get High-res Image Gene #22: 'Del Peak 10(6q26) mutation analysis' versus Clinical Feature #7: 'MRNASEQ_CNMF'
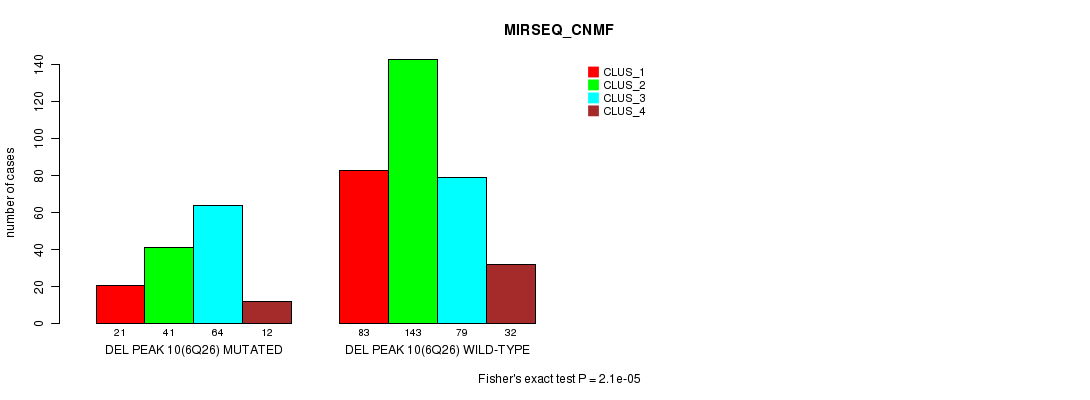
P value = 2.1e-05 (Fisher's exact test), Q value = 0.0048
Table S74. Gene #22: 'Del Peak 10(6q26) mutation analysis' versus Clinical Feature #9: 'MIRSEQ_CNMF'
| nPatients | CLUS_1 | CLUS_2 | CLUS_3 | CLUS_4 |
|---|---|---|---|---|
| ALL | 104 | 184 | 143 | 44 |
| DEL PEAK 10(6Q26) MUTATED | 21 | 41 | 64 | 12 |
| DEL PEAK 10(6Q26) WILD-TYPE | 83 | 143 | 79 | 32 |
Figure S74. Get High-res Image Gene #22: 'Del Peak 10(6q26) mutation analysis' versus Clinical Feature #9: 'MIRSEQ_CNMF'
P value = 1.84e-25 (Fisher's exact test), Q value = 5.4e-23
Table S75. Gene #23: 'Del Peak 11(6q26) mutation analysis' versus Clinical Feature #3: 'CN_CNMF'
| nPatients | CLUS_1 | CLUS_2 | CLUS_3 |
|---|---|---|---|
| ALL | 132 | 197 | 164 |
| DEL PEAK 11(6Q26) MUTATED | 84 | 19 | 39 |
| DEL PEAK 11(6Q26) WILD-TYPE | 48 | 178 | 125 |
Figure S75. Get High-res Image Gene #23: 'Del Peak 11(6q26) mutation analysis' versus Clinical Feature #3: 'CN_CNMF'

P value = 1.07e-06 (Fisher's exact test), Q value = 0.00026
Table S76. Gene #23: 'Del Peak 11(6q26) mutation analysis' versus Clinical Feature #5: 'RPPA_CNMF'
| nPatients | CLUS_1 | CLUS_2 | CLUS_3 |
|---|---|---|---|
| ALL | 159 | 147 | 141 |
| DEL PEAK 11(6Q26) MUTATED | 69 | 35 | 24 |
| DEL PEAK 11(6Q26) WILD-TYPE | 90 | 112 | 117 |
Figure S76. Get High-res Image Gene #23: 'Del Peak 11(6q26) mutation analysis' versus Clinical Feature #5: 'RPPA_CNMF'

P value = 0.00135 (Fisher's exact test), Q value = 0.24
Table S77. Gene #23: 'Del Peak 11(6q26) mutation analysis' versus Clinical Feature #6: 'RPPA_CHIERARCHICAL'
| nPatients | CLUS_1 | CLUS_2 | CLUS_3 |
|---|---|---|---|
| ALL | 132 | 211 | 104 |
| DEL PEAK 11(6Q26) MUTATED | 43 | 44 | 41 |
| DEL PEAK 11(6Q26) WILD-TYPE | 89 | 167 | 63 |
Figure S77. Get High-res Image Gene #23: 'Del Peak 11(6q26) mutation analysis' versus Clinical Feature #6: 'RPPA_CHIERARCHICAL'

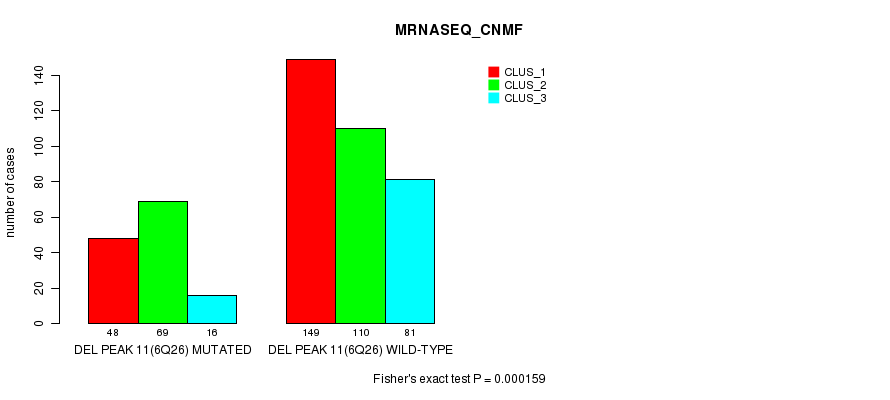
P value = 0.000159 (Fisher's exact test), Q value = 0.034
Table S78. Gene #23: 'Del Peak 11(6q26) mutation analysis' versus Clinical Feature #7: 'MRNASEQ_CNMF'
| nPatients | CLUS_1 | CLUS_2 | CLUS_3 |
|---|---|---|---|
| ALL | 197 | 179 | 97 |
| DEL PEAK 11(6Q26) MUTATED | 48 | 69 | 16 |
| DEL PEAK 11(6Q26) WILD-TYPE | 149 | 110 | 81 |
Figure S78. Get High-res Image Gene #23: 'Del Peak 11(6q26) mutation analysis' versus Clinical Feature #7: 'MRNASEQ_CNMF'
P value = 6.59e-06 (Fisher's exact test), Q value = 0.0015
Table S79. Gene #23: 'Del Peak 11(6q26) mutation analysis' versus Clinical Feature #9: 'MIRSEQ_CNMF'
| nPatients | CLUS_1 | CLUS_2 | CLUS_3 | CLUS_4 |
|---|---|---|---|---|
| ALL | 104 | 184 | 143 | 44 |
| DEL PEAK 11(6Q26) MUTATED | 20 | 41 | 65 | 12 |
| DEL PEAK 11(6Q26) WILD-TYPE | 84 | 143 | 78 | 32 |
Figure S79. Get High-res Image Gene #23: 'Del Peak 11(6q26) mutation analysis' versus Clinical Feature #9: 'MIRSEQ_CNMF'

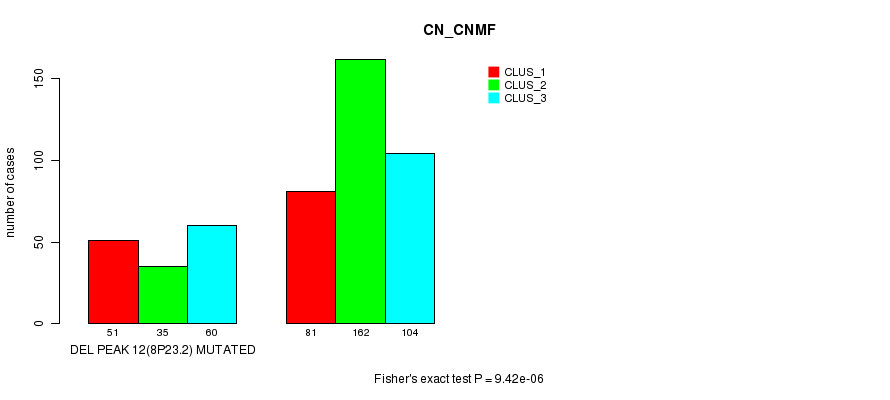
P value = 9.42e-06 (Fisher's exact test), Q value = 0.0022
Table S80. Gene #24: 'Del Peak 12(8p23.2) mutation analysis' versus Clinical Feature #3: 'CN_CNMF'
| nPatients | CLUS_1 | CLUS_2 | CLUS_3 |
|---|---|---|---|
| ALL | 132 | 197 | 164 |
| DEL PEAK 12(8P23.2) MUTATED | 51 | 35 | 60 |
| DEL PEAK 12(8P23.2) WILD-TYPE | 81 | 162 | 104 |
Figure S80. Get High-res Image Gene #24: 'Del Peak 12(8p23.2) mutation analysis' versus Clinical Feature #3: 'CN_CNMF'
P value = 0.000511 (Fisher's exact test), Q value = 0.1
Table S81. Gene #24: 'Del Peak 12(8p23.2) mutation analysis' versus Clinical Feature #9: 'MIRSEQ_CNMF'
| nPatients | CLUS_1 | CLUS_2 | CLUS_3 | CLUS_4 |
|---|---|---|---|---|
| ALL | 104 | 184 | 143 | 44 |
| DEL PEAK 12(8P23.2) MUTATED | 33 | 38 | 60 | 12 |
| DEL PEAK 12(8P23.2) WILD-TYPE | 71 | 146 | 83 | 32 |
Figure S81. Get High-res Image Gene #24: 'Del Peak 12(8p23.2) mutation analysis' versus Clinical Feature #9: 'MIRSEQ_CNMF'
P value = 3.36e-30 (Fisher's exact test), Q value = 1e-27
Table S82. Gene #25: 'Del Peak 13(9p23) mutation analysis' versus Clinical Feature #3: 'CN_CNMF'
| nPatients | CLUS_1 | CLUS_2 | CLUS_3 |
|---|---|---|---|
| ALL | 132 | 197 | 164 |
| DEL PEAK 13(9P23) MUTATED | 80 | 9 | 55 |
| DEL PEAK 13(9P23) WILD-TYPE | 52 | 188 | 109 |
Figure S82. Get High-res Image Gene #25: 'Del Peak 13(9p23) mutation analysis' versus Clinical Feature #3: 'CN_CNMF'
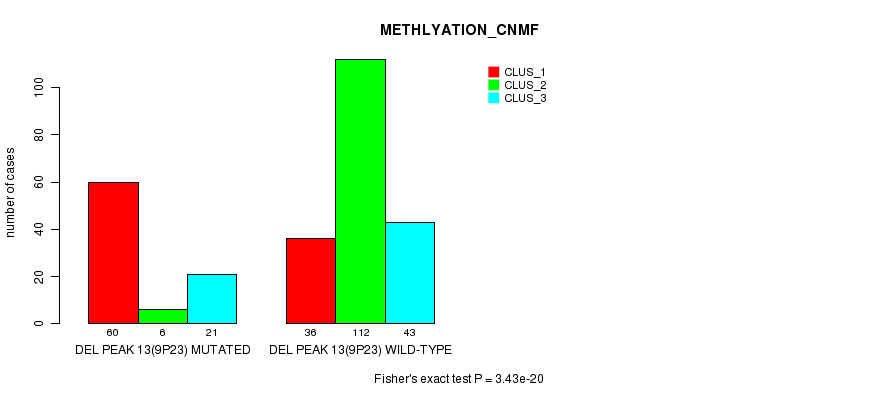
P value = 3.43e-20 (Fisher's exact test), Q value = 9.9e-18
Table S83. Gene #25: 'Del Peak 13(9p23) mutation analysis' versus Clinical Feature #4: 'METHLYATION_CNMF'
| nPatients | CLUS_1 | CLUS_2 | CLUS_3 |
|---|---|---|---|
| ALL | 96 | 118 | 64 |
| DEL PEAK 13(9P23) MUTATED | 60 | 6 | 21 |
| DEL PEAK 13(9P23) WILD-TYPE | 36 | 112 | 43 |
Figure S83. Get High-res Image Gene #25: 'Del Peak 13(9p23) mutation analysis' versus Clinical Feature #4: 'METHLYATION_CNMF'
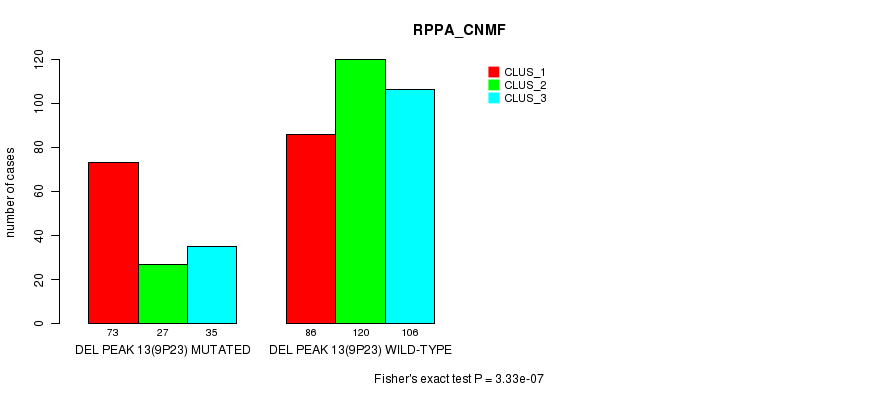
P value = 3.33e-07 (Fisher's exact test), Q value = 8.4e-05
Table S84. Gene #25: 'Del Peak 13(9p23) mutation analysis' versus Clinical Feature #5: 'RPPA_CNMF'
| nPatients | CLUS_1 | CLUS_2 | CLUS_3 |
|---|---|---|---|
| ALL | 159 | 147 | 141 |
| DEL PEAK 13(9P23) MUTATED | 73 | 27 | 35 |
| DEL PEAK 13(9P23) WILD-TYPE | 86 | 120 | 106 |
Figure S84. Get High-res Image Gene #25: 'Del Peak 13(9p23) mutation analysis' versus Clinical Feature #5: 'RPPA_CNMF'
P value = 3.59e-23 (Fisher's exact test), Q value = 1e-20
Table S85. Gene #25: 'Del Peak 13(9p23) mutation analysis' versus Clinical Feature #7: 'MRNASEQ_CNMF'
| nPatients | CLUS_1 | CLUS_2 | CLUS_3 |
|---|---|---|---|
| ALL | 197 | 179 | 97 |
| DEL PEAK 13(9P23) MUTATED | 24 | 101 | 13 |
| DEL PEAK 13(9P23) WILD-TYPE | 173 | 78 | 84 |
Figure S85. Get High-res Image Gene #25: 'Del Peak 13(9p23) mutation analysis' versus Clinical Feature #7: 'MRNASEQ_CNMF'

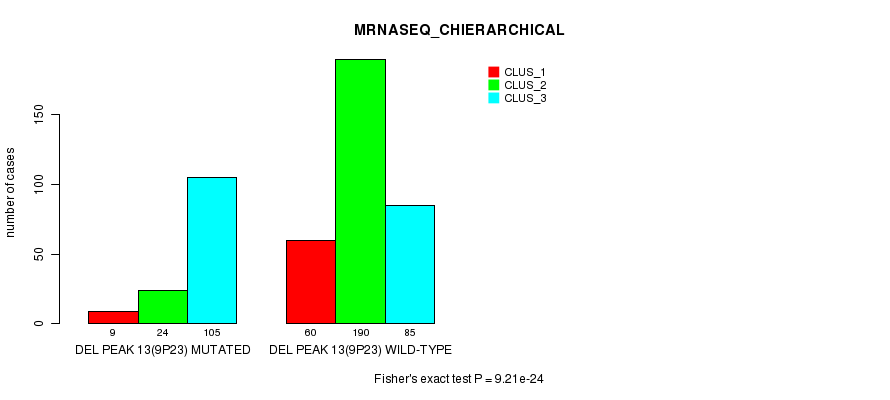
P value = 9.21e-24 (Fisher's exact test), Q value = 2.7e-21
Table S86. Gene #25: 'Del Peak 13(9p23) mutation analysis' versus Clinical Feature #8: 'MRNASEQ_CHIERARCHICAL'
| nPatients | CLUS_1 | CLUS_2 | CLUS_3 |
|---|---|---|---|
| ALL | 69 | 214 | 190 |
| DEL PEAK 13(9P23) MUTATED | 9 | 24 | 105 |
| DEL PEAK 13(9P23) WILD-TYPE | 60 | 190 | 85 |
Figure S86. Get High-res Image Gene #25: 'Del Peak 13(9p23) mutation analysis' versus Clinical Feature #8: 'MRNASEQ_CHIERARCHICAL'
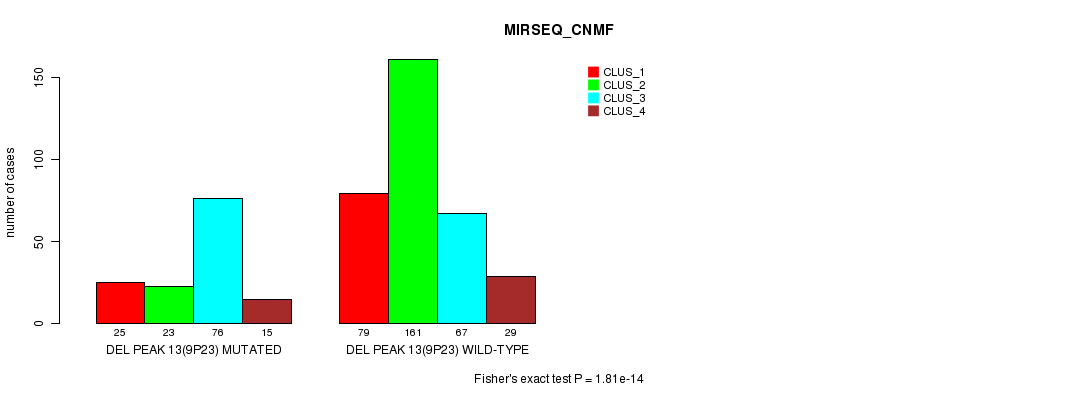
P value = 1.81e-14 (Fisher's exact test), Q value = 5.1e-12
Table S87. Gene #25: 'Del Peak 13(9p23) mutation analysis' versus Clinical Feature #9: 'MIRSEQ_CNMF'
| nPatients | CLUS_1 | CLUS_2 | CLUS_3 | CLUS_4 |
|---|---|---|---|---|
| ALL | 104 | 184 | 143 | 44 |
| DEL PEAK 13(9P23) MUTATED | 25 | 23 | 76 | 15 |
| DEL PEAK 13(9P23) WILD-TYPE | 79 | 161 | 67 | 29 |
Figure S87. Get High-res Image Gene #25: 'Del Peak 13(9p23) mutation analysis' versus Clinical Feature #9: 'MIRSEQ_CNMF'
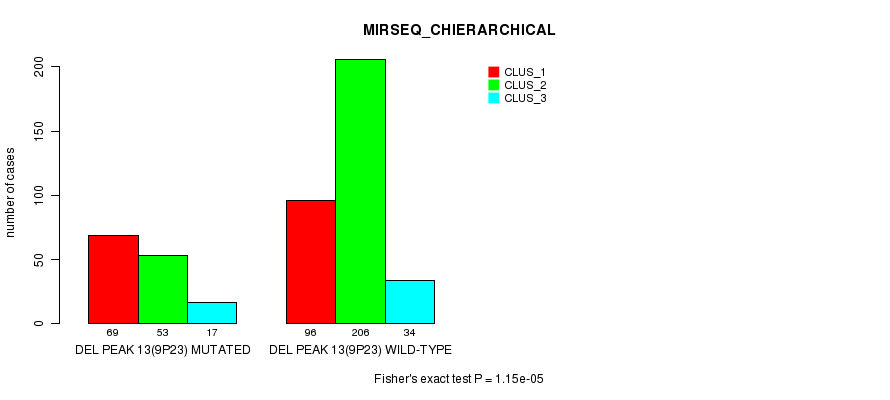
P value = 1.15e-05 (Fisher's exact test), Q value = 0.0027
Table S88. Gene #25: 'Del Peak 13(9p23) mutation analysis' versus Clinical Feature #10: 'MIRSEQ_CHIERARCHICAL'
| nPatients | CLUS_1 | CLUS_2 | CLUS_3 |
|---|---|---|---|
| ALL | 165 | 259 | 51 |
| DEL PEAK 13(9P23) MUTATED | 69 | 53 | 17 |
| DEL PEAK 13(9P23) WILD-TYPE | 96 | 206 | 34 |
Figure S88. Get High-res Image Gene #25: 'Del Peak 13(9p23) mutation analysis' versus Clinical Feature #10: 'MIRSEQ_CHIERARCHICAL'
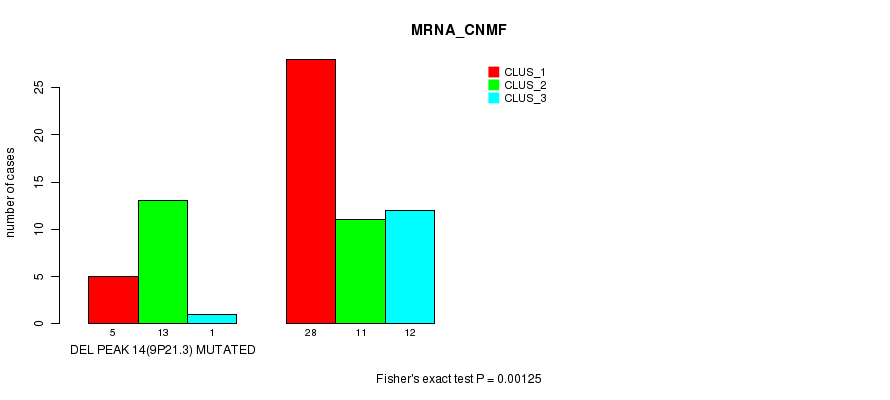
P value = 0.00125 (Fisher's exact test), Q value = 0.23
Table S89. Gene #26: 'Del Peak 14(9p21.3) mutation analysis' versus Clinical Feature #1: 'MRNA_CNMF'
| nPatients | CLUS_1 | CLUS_2 | CLUS_3 |
|---|---|---|---|
| ALL | 33 | 24 | 13 |
| DEL PEAK 14(9P21.3) MUTATED | 5 | 13 | 1 |
| DEL PEAK 14(9P21.3) WILD-TYPE | 28 | 11 | 12 |
Figure S89. Get High-res Image Gene #26: 'Del Peak 14(9p21.3) mutation analysis' versus Clinical Feature #1: 'MRNA_CNMF'
P value = 0.000662 (Fisher's exact test), Q value = 0.13
Table S90. Gene #26: 'Del Peak 14(9p21.3) mutation analysis' versus Clinical Feature #2: 'MRNA_CHIERARCHICAL'
| nPatients | CLUS_1 | CLUS_2 | CLUS_3 |
|---|---|---|---|
| ALL | 14 | 23 | 33 |
| DEL PEAK 14(9P21.3) MUTATED | 1 | 13 | 5 |
| DEL PEAK 14(9P21.3) WILD-TYPE | 13 | 10 | 28 |
Figure S90. Get High-res Image Gene #26: 'Del Peak 14(9p21.3) mutation analysis' versus Clinical Feature #2: 'MRNA_CHIERARCHICAL'
P value = 1.96e-29 (Fisher's exact test), Q value = 5.8e-27
Table S91. Gene #26: 'Del Peak 14(9p21.3) mutation analysis' versus Clinical Feature #3: 'CN_CNMF'
| nPatients | CLUS_1 | CLUS_2 | CLUS_3 |
|---|---|---|---|
| ALL | 132 | 197 | 164 |
| DEL PEAK 14(9P21.3) MUTATED | 81 | 11 | 60 |
| DEL PEAK 14(9P21.3) WILD-TYPE | 51 | 186 | 104 |
Figure S91. Get High-res Image Gene #26: 'Del Peak 14(9p21.3) mutation analysis' versus Clinical Feature #3: 'CN_CNMF'
P value = 2.24e-21 (Fisher's exact test), Q value = 6.5e-19
Table S92. Gene #26: 'Del Peak 14(9p21.3) mutation analysis' versus Clinical Feature #4: 'METHLYATION_CNMF'
| nPatients | CLUS_1 | CLUS_2 | CLUS_3 |
|---|---|---|---|
| ALL | 96 | 118 | 64 |
| DEL PEAK 14(9P21.3) MUTATED | 62 | 6 | 23 |
| DEL PEAK 14(9P21.3) WILD-TYPE | 34 | 112 | 41 |
Figure S92. Get High-res Image Gene #26: 'Del Peak 14(9p21.3) mutation analysis' versus Clinical Feature #4: 'METHLYATION_CNMF'

P value = 1.86e-07 (Fisher's exact test), Q value = 4.7e-05
Table S93. Gene #26: 'Del Peak 14(9p21.3) mutation analysis' versus Clinical Feature #5: 'RPPA_CNMF'
| nPatients | CLUS_1 | CLUS_2 | CLUS_3 |
|---|---|---|---|
| ALL | 159 | 147 | 141 |
| DEL PEAK 14(9P21.3) MUTATED | 76 | 28 | 38 |
| DEL PEAK 14(9P21.3) WILD-TYPE | 83 | 119 | 103 |
Figure S93. Get High-res Image Gene #26: 'Del Peak 14(9p21.3) mutation analysis' versus Clinical Feature #5: 'RPPA_CNMF'
P value = 2.08e-23 (Fisher's exact test), Q value = 6e-21
Table S94. Gene #26: 'Del Peak 14(9p21.3) mutation analysis' versus Clinical Feature #7: 'MRNASEQ_CNMF'
| nPatients | CLUS_1 | CLUS_2 | CLUS_3 |
|---|---|---|---|
| ALL | 197 | 179 | 97 |
| DEL PEAK 14(9P21.3) MUTATED | 26 | 105 | 15 |
| DEL PEAK 14(9P21.3) WILD-TYPE | 171 | 74 | 82 |
Figure S94. Get High-res Image Gene #26: 'Del Peak 14(9p21.3) mutation analysis' versus Clinical Feature #7: 'MRNASEQ_CNMF'
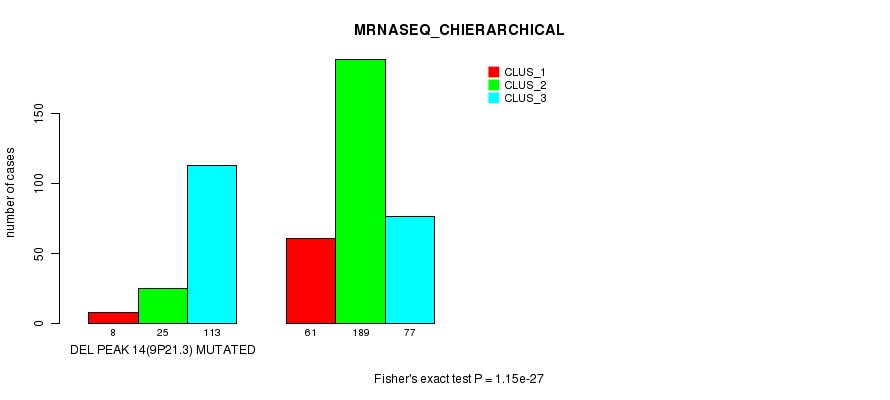
P value = 1.15e-27 (Fisher's exact test), Q value = 3.4e-25
Table S95. Gene #26: 'Del Peak 14(9p21.3) mutation analysis' versus Clinical Feature #8: 'MRNASEQ_CHIERARCHICAL'
| nPatients | CLUS_1 | CLUS_2 | CLUS_3 |
|---|---|---|---|
| ALL | 69 | 214 | 190 |
| DEL PEAK 14(9P21.3) MUTATED | 8 | 25 | 113 |
| DEL PEAK 14(9P21.3) WILD-TYPE | 61 | 189 | 77 |
Figure S95. Get High-res Image Gene #26: 'Del Peak 14(9p21.3) mutation analysis' versus Clinical Feature #8: 'MRNASEQ_CHIERARCHICAL'
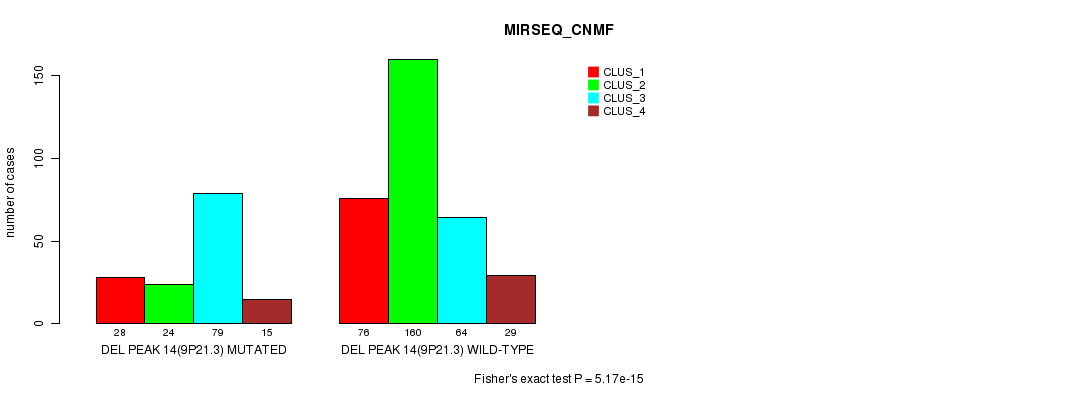
P value = 5.17e-15 (Fisher's exact test), Q value = 1.5e-12
Table S96. Gene #26: 'Del Peak 14(9p21.3) mutation analysis' versus Clinical Feature #9: 'MIRSEQ_CNMF'
| nPatients | CLUS_1 | CLUS_2 | CLUS_3 | CLUS_4 |
|---|---|---|---|---|
| ALL | 104 | 184 | 143 | 44 |
| DEL PEAK 14(9P21.3) MUTATED | 28 | 24 | 79 | 15 |
| DEL PEAK 14(9P21.3) WILD-TYPE | 76 | 160 | 64 | 29 |
Figure S96. Get High-res Image Gene #26: 'Del Peak 14(9p21.3) mutation analysis' versus Clinical Feature #9: 'MIRSEQ_CNMF'
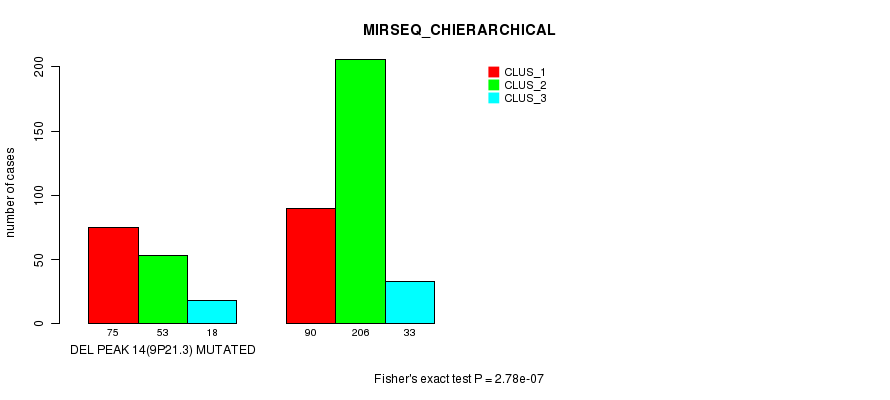
P value = 2.78e-07 (Fisher's exact test), Q value = 7.1e-05
Table S97. Gene #26: 'Del Peak 14(9p21.3) mutation analysis' versus Clinical Feature #10: 'MIRSEQ_CHIERARCHICAL'
| nPatients | CLUS_1 | CLUS_2 | CLUS_3 |
|---|---|---|---|
| ALL | 165 | 259 | 51 |
| DEL PEAK 14(9P21.3) MUTATED | 75 | 53 | 18 |
| DEL PEAK 14(9P21.3) WILD-TYPE | 90 | 206 | 33 |
Figure S97. Get High-res Image Gene #26: 'Del Peak 14(9p21.3) mutation analysis' versus Clinical Feature #10: 'MIRSEQ_CHIERARCHICAL'
P value = 9.29e-07 (Fisher's exact test), Q value = 0.00023
Table S98. Gene #27: 'Del Peak 15(10q23.31) mutation analysis' versus Clinical Feature #3: 'CN_CNMF'
| nPatients | CLUS_1 | CLUS_2 | CLUS_3 |
|---|---|---|---|
| ALL | 132 | 197 | 164 |
| DEL PEAK 15(10Q23.31) MUTATED | 36 | 15 | 39 |
| DEL PEAK 15(10Q23.31) WILD-TYPE | 96 | 182 | 125 |
Figure S98. Get High-res Image Gene #27: 'Del Peak 15(10q23.31) mutation analysis' versus Clinical Feature #3: 'CN_CNMF'

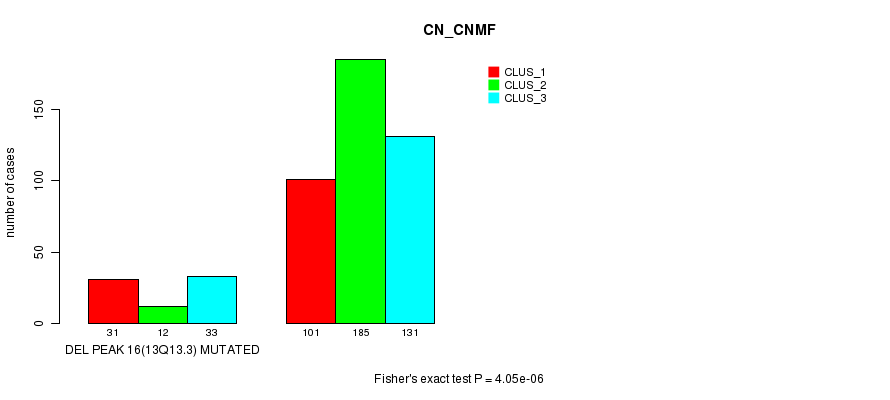
P value = 4.05e-06 (Fisher's exact test), Q value = 0.00096
Table S99. Gene #28: 'Del Peak 16(13q13.3) mutation analysis' versus Clinical Feature #3: 'CN_CNMF'
| nPatients | CLUS_1 | CLUS_2 | CLUS_3 |
|---|---|---|---|
| ALL | 132 | 197 | 164 |
| DEL PEAK 16(13Q13.3) MUTATED | 31 | 12 | 33 |
| DEL PEAK 16(13Q13.3) WILD-TYPE | 101 | 185 | 131 |
Figure S99. Get High-res Image Gene #28: 'Del Peak 16(13q13.3) mutation analysis' versus Clinical Feature #3: 'CN_CNMF'
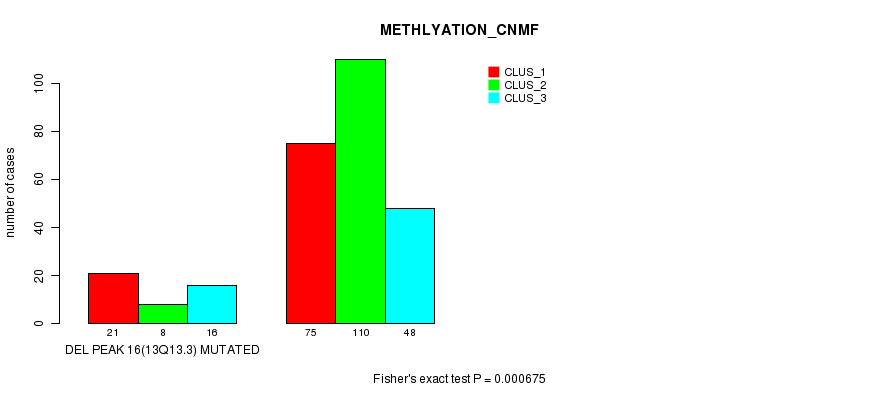
P value = 0.000675 (Fisher's exact test), Q value = 0.13
Table S100. Gene #28: 'Del Peak 16(13q13.3) mutation analysis' versus Clinical Feature #4: 'METHLYATION_CNMF'
| nPatients | CLUS_1 | CLUS_2 | CLUS_3 |
|---|---|---|---|
| ALL | 96 | 118 | 64 |
| DEL PEAK 16(13Q13.3) MUTATED | 21 | 8 | 16 |
| DEL PEAK 16(13Q13.3) WILD-TYPE | 75 | 110 | 48 |
Figure S100. Get High-res Image Gene #28: 'Del Peak 16(13q13.3) mutation analysis' versus Clinical Feature #4: 'METHLYATION_CNMF'
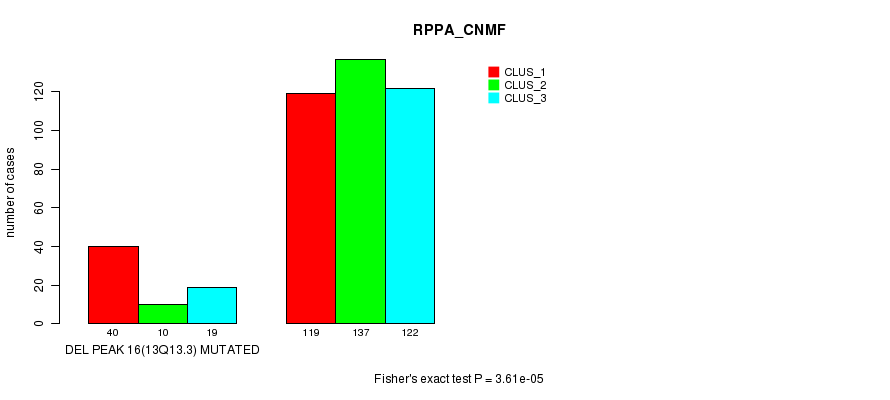
P value = 3.61e-05 (Fisher's exact test), Q value = 0.0081
Table S101. Gene #28: 'Del Peak 16(13q13.3) mutation analysis' versus Clinical Feature #5: 'RPPA_CNMF'
| nPatients | CLUS_1 | CLUS_2 | CLUS_3 |
|---|---|---|---|
| ALL | 159 | 147 | 141 |
| DEL PEAK 16(13Q13.3) MUTATED | 40 | 10 | 19 |
| DEL PEAK 16(13Q13.3) WILD-TYPE | 119 | 137 | 122 |
Figure S101. Get High-res Image Gene #28: 'Del Peak 16(13q13.3) mutation analysis' versus Clinical Feature #5: 'RPPA_CNMF'
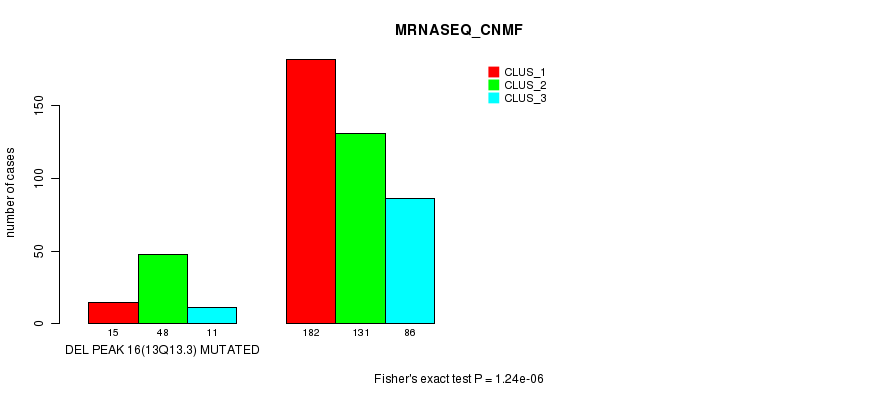
P value = 1.24e-06 (Fisher's exact test), Q value = 3e-04
Table S102. Gene #28: 'Del Peak 16(13q13.3) mutation analysis' versus Clinical Feature #7: 'MRNASEQ_CNMF'
| nPatients | CLUS_1 | CLUS_2 | CLUS_3 |
|---|---|---|---|
| ALL | 197 | 179 | 97 |
| DEL PEAK 16(13Q13.3) MUTATED | 15 | 48 | 11 |
| DEL PEAK 16(13Q13.3) WILD-TYPE | 182 | 131 | 86 |
Figure S102. Get High-res Image Gene #28: 'Del Peak 16(13q13.3) mutation analysis' versus Clinical Feature #7: 'MRNASEQ_CNMF'
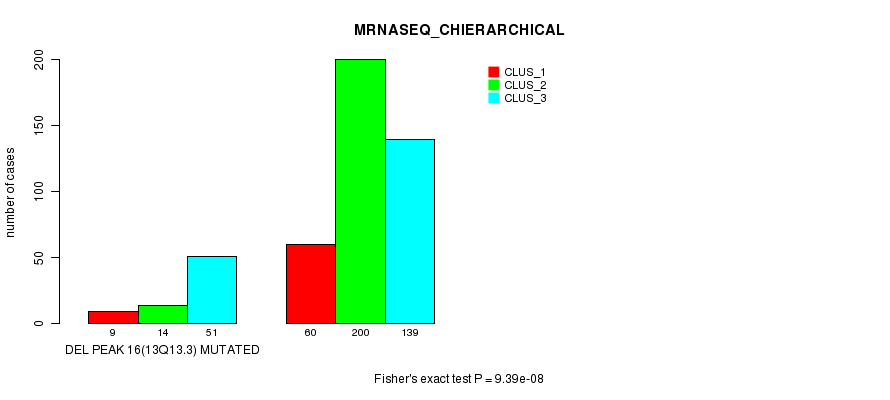
P value = 9.39e-08 (Fisher's exact test), Q value = 2.5e-05
Table S103. Gene #28: 'Del Peak 16(13q13.3) mutation analysis' versus Clinical Feature #8: 'MRNASEQ_CHIERARCHICAL'
| nPatients | CLUS_1 | CLUS_2 | CLUS_3 |
|---|---|---|---|
| ALL | 69 | 214 | 190 |
| DEL PEAK 16(13Q13.3) MUTATED | 9 | 14 | 51 |
| DEL PEAK 16(13Q13.3) WILD-TYPE | 60 | 200 | 139 |
Figure S103. Get High-res Image Gene #28: 'Del Peak 16(13q13.3) mutation analysis' versus Clinical Feature #8: 'MRNASEQ_CHIERARCHICAL'
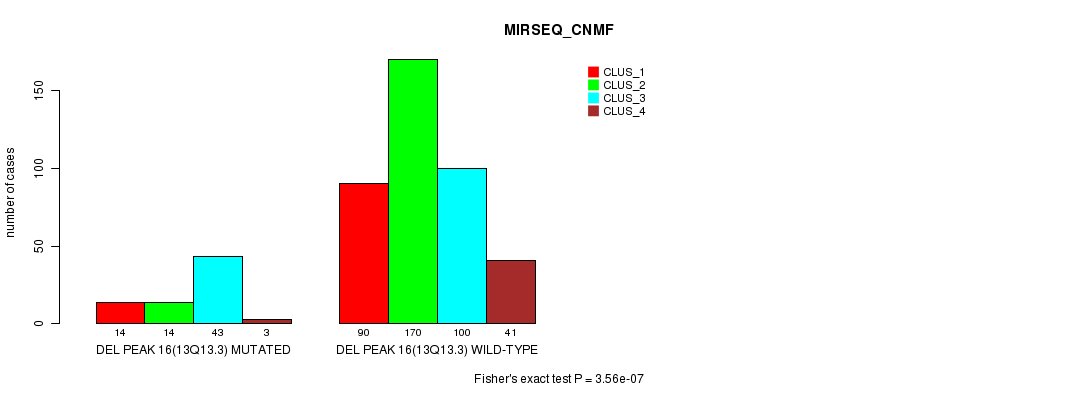
P value = 3.56e-07 (Fisher's exact test), Q value = 9e-05
Table S104. Gene #28: 'Del Peak 16(13q13.3) mutation analysis' versus Clinical Feature #9: 'MIRSEQ_CNMF'
| nPatients | CLUS_1 | CLUS_2 | CLUS_3 | CLUS_4 |
|---|---|---|---|---|
| ALL | 104 | 184 | 143 | 44 |
| DEL PEAK 16(13Q13.3) MUTATED | 14 | 14 | 43 | 3 |
| DEL PEAK 16(13Q13.3) WILD-TYPE | 90 | 170 | 100 | 41 |
Figure S104. Get High-res Image Gene #28: 'Del Peak 16(13q13.3) mutation analysis' versus Clinical Feature #9: 'MIRSEQ_CNMF'
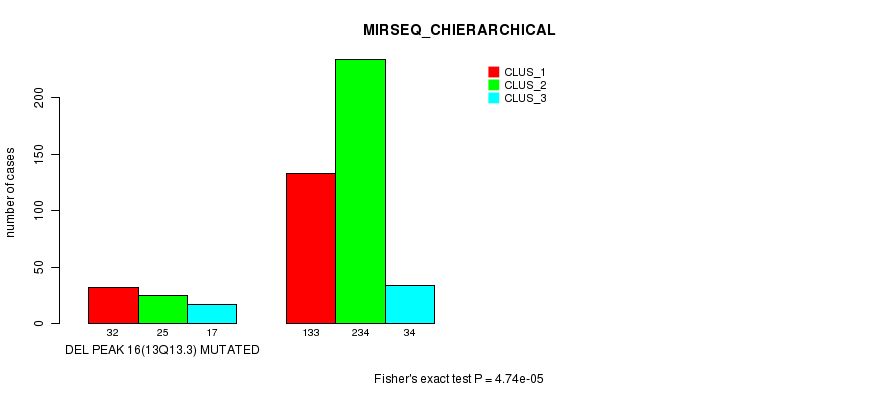
P value = 4.74e-05 (Fisher's exact test), Q value = 0.01
Table S105. Gene #28: 'Del Peak 16(13q13.3) mutation analysis' versus Clinical Feature #10: 'MIRSEQ_CHIERARCHICAL'
| nPatients | CLUS_1 | CLUS_2 | CLUS_3 |
|---|---|---|---|
| ALL | 165 | 259 | 51 |
| DEL PEAK 16(13Q13.3) MUTATED | 32 | 25 | 17 |
| DEL PEAK 16(13Q13.3) WILD-TYPE | 133 | 234 | 34 |
Figure S105. Get High-res Image Gene #28: 'Del Peak 16(13q13.3) mutation analysis' versus Clinical Feature #10: 'MIRSEQ_CHIERARCHICAL'
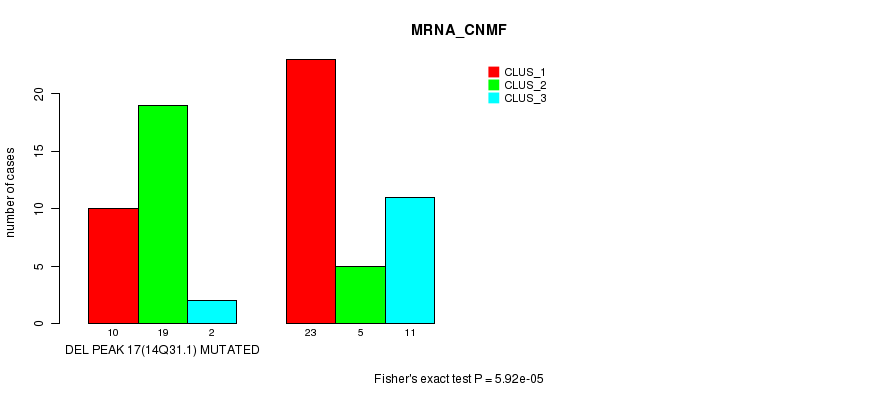
P value = 5.92e-05 (Fisher's exact test), Q value = 0.013
Table S106. Gene #29: 'Del Peak 17(14q31.1) mutation analysis' versus Clinical Feature #1: 'MRNA_CNMF'
| nPatients | CLUS_1 | CLUS_2 | CLUS_3 |
|---|---|---|---|
| ALL | 33 | 24 | 13 |
| DEL PEAK 17(14Q31.1) MUTATED | 10 | 19 | 2 |
| DEL PEAK 17(14Q31.1) WILD-TYPE | 23 | 5 | 11 |
Figure S106. Get High-res Image Gene #29: 'Del Peak 17(14q31.1) mutation analysis' versus Clinical Feature #1: 'MRNA_CNMF'
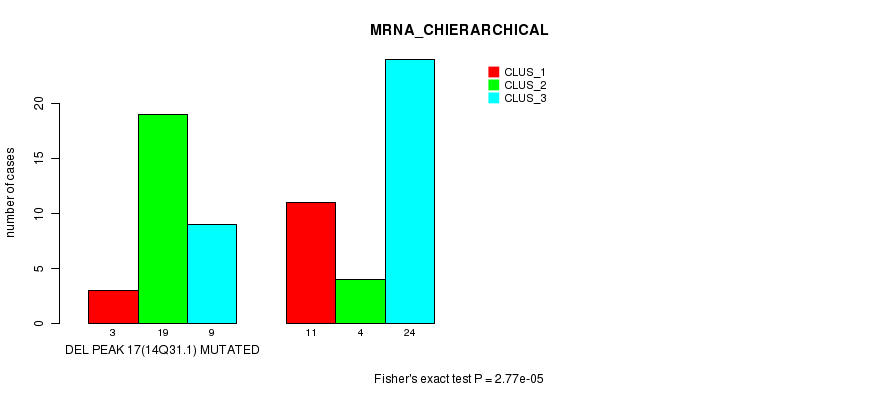
P value = 2.77e-05 (Fisher's exact test), Q value = 0.0063
Table S107. Gene #29: 'Del Peak 17(14q31.1) mutation analysis' versus Clinical Feature #2: 'MRNA_CHIERARCHICAL'
| nPatients | CLUS_1 | CLUS_2 | CLUS_3 |
|---|---|---|---|
| ALL | 14 | 23 | 33 |
| DEL PEAK 17(14Q31.1) MUTATED | 3 | 19 | 9 |
| DEL PEAK 17(14Q31.1) WILD-TYPE | 11 | 4 | 24 |
Figure S107. Get High-res Image Gene #29: 'Del Peak 17(14q31.1) mutation analysis' versus Clinical Feature #2: 'MRNA_CHIERARCHICAL'
P value = 2.06e-13 (Fisher's exact test), Q value = 5.7e-11
Table S108. Gene #29: 'Del Peak 17(14q31.1) mutation analysis' versus Clinical Feature #3: 'CN_CNMF'
| nPatients | CLUS_1 | CLUS_2 | CLUS_3 |
|---|---|---|---|
| ALL | 132 | 197 | 164 |
| DEL PEAK 17(14Q31.1) MUTATED | 92 | 54 | 72 |
| DEL PEAK 17(14Q31.1) WILD-TYPE | 40 | 143 | 92 |
Figure S108. Get High-res Image Gene #29: 'Del Peak 17(14q31.1) mutation analysis' versus Clinical Feature #3: 'CN_CNMF'
P value = 6.79e-08 (Fisher's exact test), Q value = 1.8e-05
Table S109. Gene #29: 'Del Peak 17(14q31.1) mutation analysis' versus Clinical Feature #4: 'METHLYATION_CNMF'
| nPatients | CLUS_1 | CLUS_2 | CLUS_3 |
|---|---|---|---|
| ALL | 96 | 118 | 64 |
| DEL PEAK 17(14Q31.1) MUTATED | 61 | 30 | 32 |
| DEL PEAK 17(14Q31.1) WILD-TYPE | 35 | 88 | 32 |
Figure S109. Get High-res Image Gene #29: 'Del Peak 17(14q31.1) mutation analysis' versus Clinical Feature #4: 'METHLYATION_CNMF'
P value = 2.81e-09 (Fisher's exact test), Q value = 7.5e-07
Table S110. Gene #29: 'Del Peak 17(14q31.1) mutation analysis' versus Clinical Feature #5: 'RPPA_CNMF'
| nPatients | CLUS_1 | CLUS_2 | CLUS_3 |
|---|---|---|---|
| ALL | 159 | 147 | 141 |
| DEL PEAK 17(14Q31.1) MUTATED | 102 | 57 | 42 |
| DEL PEAK 17(14Q31.1) WILD-TYPE | 57 | 90 | 99 |
Figure S110. Get High-res Image Gene #29: 'Del Peak 17(14q31.1) mutation analysis' versus Clinical Feature #5: 'RPPA_CNMF'
P value = 2.31e-05 (Fisher's exact test), Q value = 0.0053
Table S111. Gene #29: 'Del Peak 17(14q31.1) mutation analysis' versus Clinical Feature #6: 'RPPA_CHIERARCHICAL'
| nPatients | CLUS_1 | CLUS_2 | CLUS_3 |
|---|---|---|---|
| ALL | 132 | 211 | 104 |
| DEL PEAK 17(14Q31.1) MUTATED | 79 | 73 | 49 |
| DEL PEAK 17(14Q31.1) WILD-TYPE | 53 | 138 | 55 |
Figure S111. Get High-res Image Gene #29: 'Del Peak 17(14q31.1) mutation analysis' versus Clinical Feature #6: 'RPPA_CHIERARCHICAL'
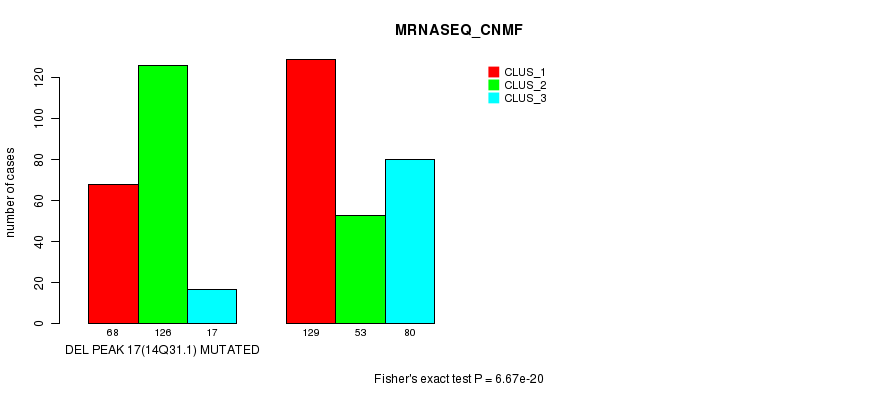
P value = 6.67e-20 (Fisher's exact test), Q value = 1.9e-17
Table S112. Gene #29: 'Del Peak 17(14q31.1) mutation analysis' versus Clinical Feature #7: 'MRNASEQ_CNMF'
| nPatients | CLUS_1 | CLUS_2 | CLUS_3 |
|---|---|---|---|
| ALL | 197 | 179 | 97 |
| DEL PEAK 17(14Q31.1) MUTATED | 68 | 126 | 17 |
| DEL PEAK 17(14Q31.1) WILD-TYPE | 129 | 53 | 80 |
Figure S112. Get High-res Image Gene #29: 'Del Peak 17(14q31.1) mutation analysis' versus Clinical Feature #7: 'MRNASEQ_CNMF'
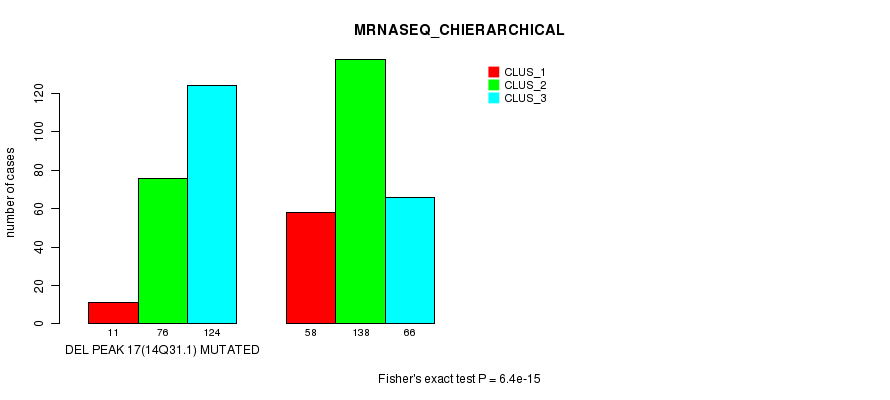
P value = 6.4e-15 (Fisher's exact test), Q value = 1.8e-12
Table S113. Gene #29: 'Del Peak 17(14q31.1) mutation analysis' versus Clinical Feature #8: 'MRNASEQ_CHIERARCHICAL'
| nPatients | CLUS_1 | CLUS_2 | CLUS_3 |
|---|---|---|---|
| ALL | 69 | 214 | 190 |
| DEL PEAK 17(14Q31.1) MUTATED | 11 | 76 | 124 |
| DEL PEAK 17(14Q31.1) WILD-TYPE | 58 | 138 | 66 |
Figure S113. Get High-res Image Gene #29: 'Del Peak 17(14q31.1) mutation analysis' versus Clinical Feature #8: 'MRNASEQ_CHIERARCHICAL'
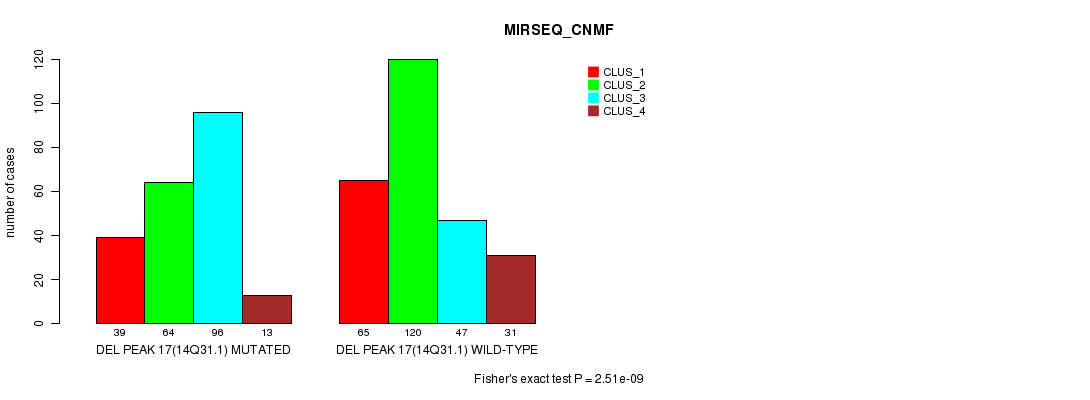
P value = 2.51e-09 (Fisher's exact test), Q value = 6.7e-07
Table S114. Gene #29: 'Del Peak 17(14q31.1) mutation analysis' versus Clinical Feature #9: 'MIRSEQ_CNMF'
| nPatients | CLUS_1 | CLUS_2 | CLUS_3 | CLUS_4 |
|---|---|---|---|---|
| ALL | 104 | 184 | 143 | 44 |
| DEL PEAK 17(14Q31.1) MUTATED | 39 | 64 | 96 | 13 |
| DEL PEAK 17(14Q31.1) WILD-TYPE | 65 | 120 | 47 | 31 |
Figure S114. Get High-res Image Gene #29: 'Del Peak 17(14q31.1) mutation analysis' versus Clinical Feature #9: 'MIRSEQ_CNMF'
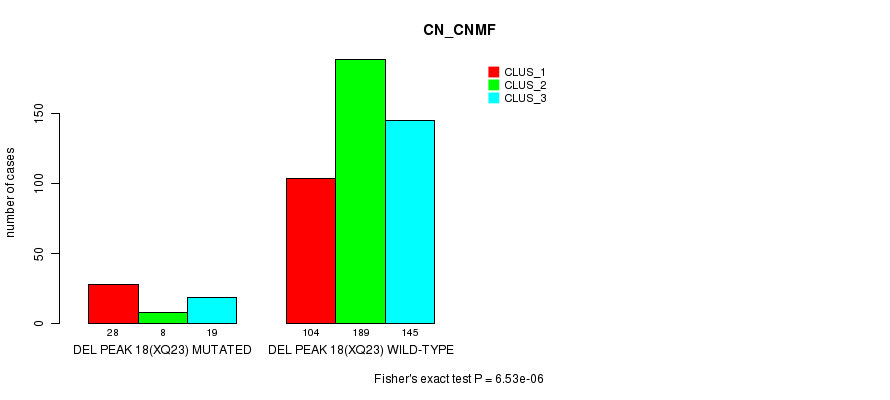
P value = 6.53e-06 (Fisher's exact test), Q value = 0.0015
Table S115. Gene #30: 'Del Peak 18(Xq23) mutation analysis' versus Clinical Feature #3: 'CN_CNMF'
| nPatients | CLUS_1 | CLUS_2 | CLUS_3 |
|---|---|---|---|
| ALL | 132 | 197 | 164 |
| DEL PEAK 18(XQ23) MUTATED | 28 | 8 | 19 |
| DEL PEAK 18(XQ23) WILD-TYPE | 104 | 189 | 145 |
Figure S115. Get High-res Image Gene #30: 'Del Peak 18(Xq23) mutation analysis' versus Clinical Feature #3: 'CN_CNMF'
P value = 0.000715 (Fisher's exact test), Q value = 0.14
Table S116. Gene #30: 'Del Peak 18(Xq23) mutation analysis' versus Clinical Feature #4: 'METHLYATION_CNMF'
| nPatients | CLUS_1 | CLUS_2 | CLUS_3 |
|---|---|---|---|
| ALL | 96 | 118 | 64 |
| DEL PEAK 18(XQ23) MUTATED | 18 | 5 | 3 |
| DEL PEAK 18(XQ23) WILD-TYPE | 78 | 113 | 61 |
Figure S116. Get High-res Image Gene #30: 'Del Peak 18(Xq23) mutation analysis' versus Clinical Feature #4: 'METHLYATION_CNMF'
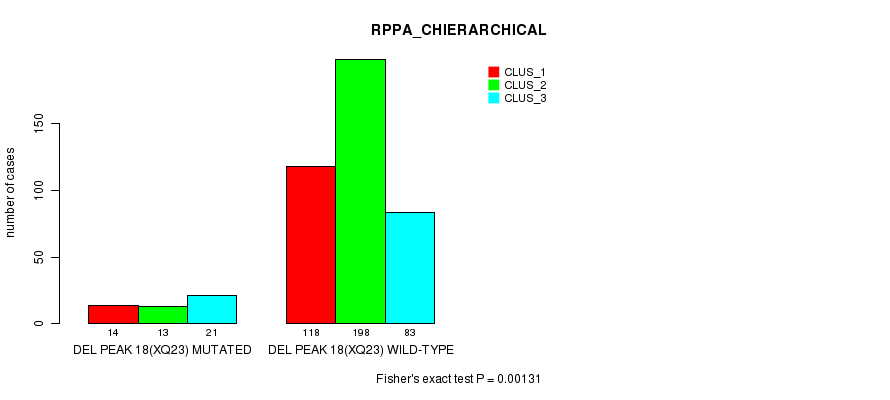
P value = 0.00131 (Fisher's exact test), Q value = 0.24
Table S117. Gene #30: 'Del Peak 18(Xq23) mutation analysis' versus Clinical Feature #6: 'RPPA_CHIERARCHICAL'
| nPatients | CLUS_1 | CLUS_2 | CLUS_3 |
|---|---|---|---|
| ALL | 132 | 211 | 104 |
| DEL PEAK 18(XQ23) MUTATED | 14 | 13 | 21 |
| DEL PEAK 18(XQ23) WILD-TYPE | 118 | 198 | 83 |
Figure S117. Get High-res Image Gene #30: 'Del Peak 18(Xq23) mutation analysis' versus Clinical Feature #6: 'RPPA_CHIERARCHICAL'
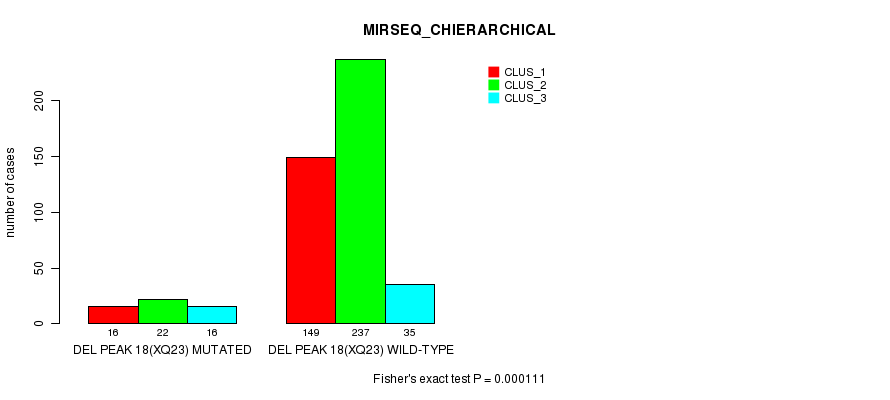
P value = 0.000111 (Fisher's exact test), Q value = 0.024
Table S118. Gene #30: 'Del Peak 18(Xq23) mutation analysis' versus Clinical Feature #10: 'MIRSEQ_CHIERARCHICAL'
| nPatients | CLUS_1 | CLUS_2 | CLUS_3 |
|---|---|---|---|
| ALL | 165 | 259 | 51 |
| DEL PEAK 18(XQ23) MUTATED | 16 | 22 | 16 |
| DEL PEAK 18(XQ23) WILD-TYPE | 149 | 237 | 35 |
Figure S118. Get High-res Image Gene #30: 'Del Peak 18(Xq23) mutation analysis' versus Clinical Feature #10: 'MIRSEQ_CHIERARCHICAL'
-
Copy number data file = All Lesions File (all_lesions.conf_##.txt, where ## is the confidence level). The all lesions file is from GISTIC pipeline and summarizes the results from the GISTIC run. It contains data about the significant regions of amplification and deletion as well as which samples are amplified or deleted in each of these regions. The identified regions are listed down the first column, and the samples are listed across the first row, starting in column 10.
-
Molecular subtype file = KIRC-TP.transferedmergedcluster.txt
-
Number of patients = 493
-
Number of copy number variation regions = 30
-
Number of molecular subtypes = 10
-
Exclude regions that fewer than K tumors have alterations, K = 3
For binary or multi-class clinical features (nominal or ordinal), two-tailed Fisher's exact tests (Fisher 1922) were used to estimate the P values using the 'fisher.test' function in R
For multiple hypothesis correction, Q value is the False Discovery Rate (FDR) analogue of the P value (Benjamini and Hochberg 1995), defined as the minimum FDR at which the test may be called significant. We used the 'Benjamini and Hochberg' method of 'p.adjust' function in R to convert P values into Q values.
This is an experimental feature. The full results of the analysis summarized in this report can be downloaded from the TCGA Data Coordination Center.