This pipeline uses various statistical tests to identify genes whose promoter methylation levels correlated to selected clinical features.
Testing the association between 17247 genes and 8 clinical features across 58 samples, statistically thresholded by Q value < 0.05, 5 clinical features related to at least one genes.
-
1 gene correlated to 'AGE'.
-
IGF2BP2
-
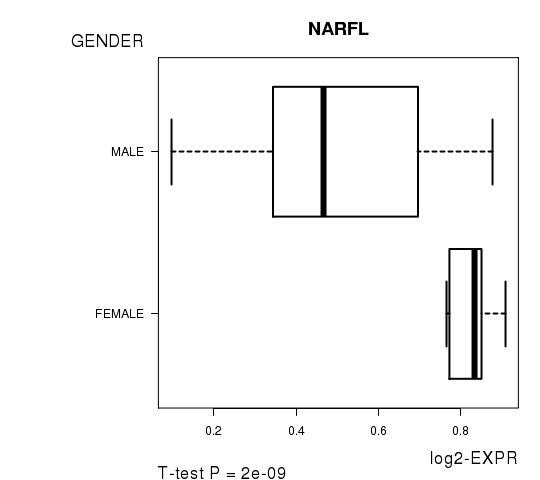
3 genes correlated to 'GENDER'.
-
NARFL , ATAD5 , CCNYL1
-
51 genes correlated to 'PATHOLOGY.T'.
-
DLX6AS , GNASAS , GP2 , GPR150 , PCDHB19P , ...
-
22 genes correlated to 'PATHOLOGICSPREAD(M)'.
-
RFX7 , GDPD4 , ERCC2 , DHDH , UNC93A , ...
-
33 genes correlated to 'TUMOR.STAGE'.
-
INSM1 , ZNF177 , DLX6AS , CNIH3 , MATK , ...
-
No genes correlated to 'Time to Death', 'KARNOFSKY.PERFORMANCE.SCORE', and 'PATHOLOGY.N'.
Complete statistical result table is provided in Supplement Table 1
Table 1. Get Full Table This table shows the clinical features, statistical methods used, and the number of genes that are significantly associated with each clinical feature at Q value < 0.05.
| Clinical feature | Statistical test | Significant genes | Associated with | Associated with | ||
|---|---|---|---|---|---|---|
| Time to Death | Cox regression test | N=0 | ||||
| AGE | Spearman correlation test | N=1 | older | N=1 | younger | N=0 |
| GENDER | t test | N=3 | male | N=1 | female | N=2 |
| KARNOFSKY PERFORMANCE SCORE | t test | N=0 | ||||
| PATHOLOGY T | Spearman correlation test | N=51 | higher pT | N=40 | lower pT | N=11 |
| PATHOLOGY N | Spearman correlation test | N=0 | ||||
| PATHOLOGICSPREAD(M) | ANOVA test | N=22 | ||||
| TUMOR STAGE | Spearman correlation test | N=33 | higher stage | N=29 | lower stage | N=4 |
Table S1. Basic characteristics of clinical feature: 'Time to Death'
| Time to Death | Duration (Months) | 1-182.7 (median=21.6) |
| censored | N = 44 | |
| death | N = 11 | |
| Significant markers | N = 0 |
Table S2. Basic characteristics of clinical feature: 'AGE'
| AGE | Mean (SD) | 60.27 (14) |
| Significant markers | N = 1 | |
| pos. correlated | 1 | |
| neg. correlated | 0 |
Table S3. Get Full Table List of one gene significantly correlated to 'AGE' by Spearman correlation test
| SpearmanCorr | corrP | Q | |
|---|---|---|---|
| IGF2BP2 | 0.619 | 4.721e-07 | 0.00814 |
Figure S1. Get High-res Image As an example, this figure shows the association of IGF2BP2 to 'AGE'. P value = 4.72e-07 with Spearman correlation analysis. The straight line presents the best linear regression.
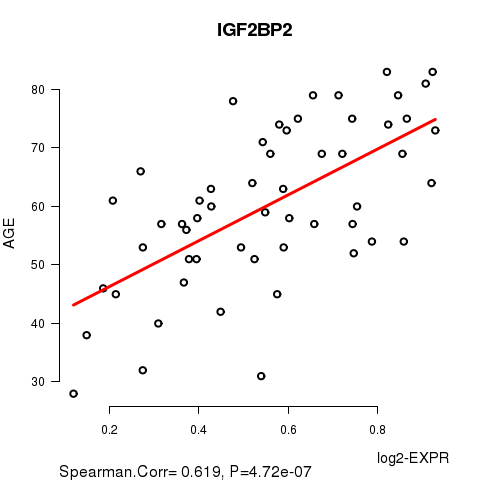
Table S4. Basic characteristics of clinical feature: 'GENDER'
| GENDER | Labels | N |
| FEMALE | 18 | |
| MALE | 40 | |
| Significant markers | N = 3 | |
| Higher in MALE | 1 | |
| Higher in FEMALE | 2 |
Table S5. Get Full Table List of 3 genes differentially expressed by 'GENDER'
| T(pos if higher in 'MALE') | ttestP | Q | AUC | |
|---|---|---|---|---|
| NARFL | -7.15 | 1.997e-09 | 3.44e-05 | 0.8875 |
| ATAD5 | 6.47 | 6.841e-07 | 0.0118 | 0.8889 |
| CCNYL1 | -6.09 | 2.276e-06 | 0.0392 | 0.8847 |
Figure S2. Get High-res Image As an example, this figure shows the association of NARFL to 'GENDER'. P value = 2e-09 with T-test analysis.
No gene related to 'KARNOFSKY.PERFORMANCE.SCORE'.
Table S6. Basic characteristics of clinical feature: 'KARNOFSKY.PERFORMANCE.SCORE'
| KARNOFSKY.PERFORMANCE.SCORE | Labels | N |
| class100 | 5 | |
| class90 | 5 | |
| Significant markers | N = 0 |
Table S7. Basic characteristics of clinical feature: 'PATHOLOGY.T'
| PATHOLOGY.T | Mean (SD) | 1.91 (1) |
| N | ||
| T1 | 31 | |
| T2 | 2 | |
| T3 | 24 | |
| T4 | 1 | |
| Significant markers | N = 51 | |
| pos. correlated | 40 | |
| neg. correlated | 11 |
Table S8. Get Full Table List of top 10 genes significantly correlated to 'PATHOLOGY.T' by Spearman correlation test
| SpearmanCorr | corrP | Q | |
|---|---|---|---|
| DLX6AS | 0.6973 | 1.19e-09 | 2.05e-05 |
| GNASAS | -0.6915 | 1.858e-09 | 3.2e-05 |
| GP2 | -0.6477 | 3.9e-08 | 0.000673 |
| GPR150 | 0.64 | 6.328e-08 | 0.00109 |
| PCDHB19P | 0.6368 | 7.7e-08 | 0.00133 |
| HBA1 | 0.6368 | 7.716e-08 | 0.00133 |
| SLC2A14 | 0.6329 | 9.774e-08 | 0.00169 |
| DLEU2 | -0.6307 | 1.118e-07 | 0.00193 |
| MATK | 0.6246 | 1.605e-07 | 0.00277 |
| NECAB1 | 0.624 | 1.665e-07 | 0.00287 |
Figure S3. Get High-res Image As an example, this figure shows the association of DLX6AS to 'PATHOLOGY.T'. P value = 1.19e-09 with Spearman correlation analysis.
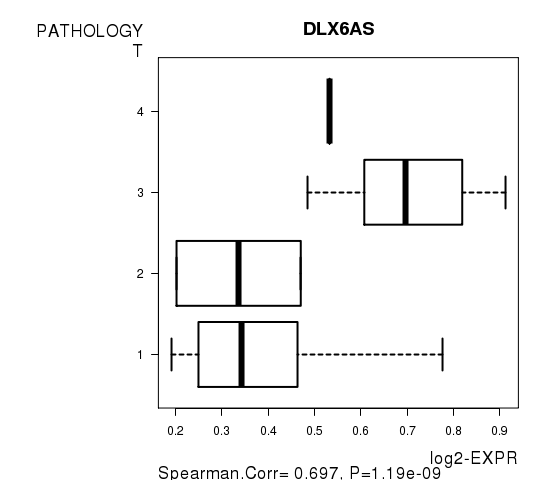
Table S9. Basic characteristics of clinical feature: 'PATHOLOGY.N'
| PATHOLOGY.N | Mean (SD) | 0.56 (0.7) |
| N | ||
| N0 | 15 | |
| N1 | 9 | |
| N2 | 3 | |
| Significant markers | N = 0 |
Table S10. Basic characteristics of clinical feature: 'PATHOLOGICSPREAD(M)'
| PATHOLOGICSPREAD(M) | Labels | N |
| M0 | 37 | |
| M1 | 4 | |
| MX | 16 | |
| Significant markers | N = 22 |
Table S11. Get Full Table List of top 10 genes differentially expressed by 'PATHOLOGICSPREAD(M)'
| ANOVA_P | Q | |
|---|---|---|
| RFX7 | 2.125e-11 | 3.67e-07 |
| GDPD4 | 7.075e-09 | 0.000122 |
| ERCC2 | 4.114e-08 | 0.000709 |
| DHDH | 1.266e-07 | 0.00218 |
| UNC93A | 1.497e-07 | 0.00258 |
| NFE2L1 | 1.929e-07 | 0.00333 |
| ZPBP | 2.418e-07 | 0.00417 |
| OR10AD1 | 3.672e-07 | 0.00633 |
| PCDHA5 | 3.774e-07 | 0.00651 |
| TRMT6 | 4.743e-07 | 0.00818 |
Figure S4. Get High-res Image As an example, this figure shows the association of RFX7 to 'PATHOLOGICSPREAD(M)'. P value = 2.12e-11 with ANOVA analysis.
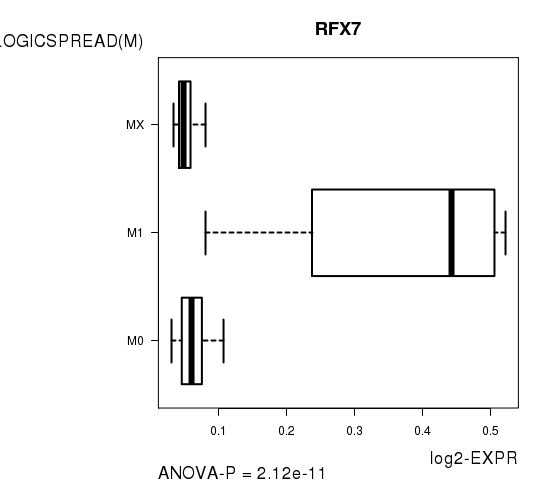
Table S12. Basic characteristics of clinical feature: 'TUMOR.STAGE'
| TUMOR.STAGE | Mean (SD) | 2.05 (1.2) |
| N | ||
| Stage 1 | 30 | |
| Stage 2 | 1 | |
| Stage 3 | 19 | |
| Stage 4 | 7 | |
| Significant markers | N = 33 | |
| pos. correlated | 29 | |
| neg. correlated | 4 |
Table S13. Get Full Table List of top 10 genes significantly correlated to 'TUMOR.STAGE' by Spearman correlation test
| SpearmanCorr | corrP | Q | |
|---|---|---|---|
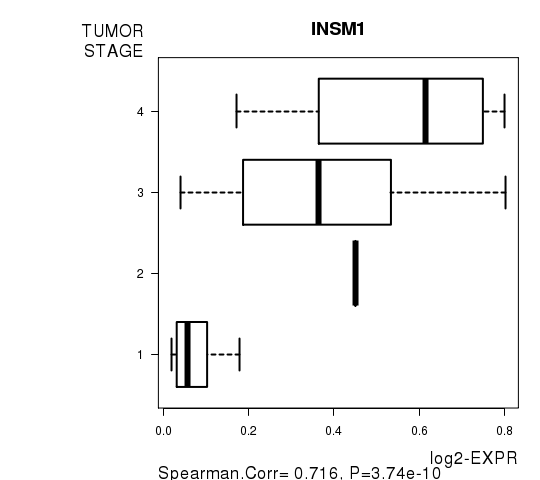
| INSM1 | 0.7163 | 3.74e-10 | 6.45e-06 |
| ZNF177 | 0.6711 | 1.111e-08 | 0.000192 |
| DLX6AS | 0.6708 | 1.133e-08 | 0.000195 |
| CNIH3 | 0.6526 | 3.775e-08 | 0.000651 |
| MATK | 0.65 | 4.45e-08 | 0.000767 |
| NSD1 | 0.6407 | 7.973e-08 | 0.00137 |
| TMEM132B | -0.6389 | 8.876e-08 | 0.00153 |
| WDR16 | 0.6318 | 1.363e-07 | 0.00235 |
| HBA1 | 0.6317 | 1.372e-07 | 0.00236 |
| DIO3 | 0.6263 | 1.878e-07 | 0.00324 |
Figure S5. Get High-res Image As an example, this figure shows the association of INSM1 to 'TUMOR.STAGE'. P value = 3.74e-10 with Spearman correlation analysis.
-
Expresson data file = KIRP-TP.meth.for_correlation.filtered_data.txt
-
Clinical data file = KIRP-TP.clin.merged.picked.txt
-
Number of patients = 58
-
Number of genes = 17247
-
Number of clinical features = 8
For survival clinical features, Wald's test in univariate Cox regression analysis with proportional hazards model (Andersen and Gill 1982) was used to estimate the P values using the 'coxph' function in R. Kaplan-Meier survival curves were plot using the four quartile subgroups of patients based on expression levels
For continuous numerical clinical features, Spearman's rank correlation coefficients (Spearman 1904) and two-tailed P values were estimated using 'cor.test' function in R
For two-class clinical features, two-tailed Student's t test with unequal variance (Lehmann and Romano 2005) was applied to compare the log2-expression levels between the two clinical classes using 't.test' function in R
For multi-class clinical features (ordinal or nominal), one-way analysis of variance (Howell 2002) was applied to compare the log2-expression levels between different clinical classes using 'anova' function in R
For multiple hypothesis correction, Q value is the False Discovery Rate (FDR) analogue of the P value (Benjamini and Hochberg 1995), defined as the minimum FDR at which the test may be called significant. We used the 'Benjamini and Hochberg' method of 'p.adjust' function in R to convert P values into Q values.
This is an experimental feature. The full results of the analysis summarized in this report can be downloaded from the TCGA Data Coordination Center.