This pipeline uses various statistical tests to identify mRNAs whose expression levels correlated to selected clinical features.
Testing the association between 18174 genes and 8 clinical features across 74 samples, statistically thresholded by Q value < 0.05, 6 clinical features related to at least one genes.
-
1 gene correlated to 'AGE'.
-
MCCC2|64087
-
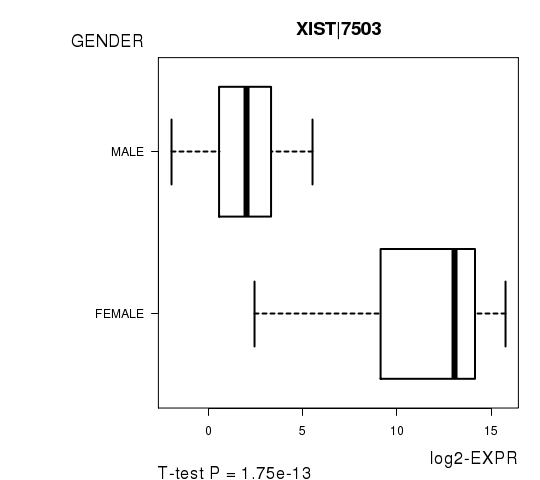
16 genes correlated to 'GENDER'.
-
XIST|7503 , RPS4Y1|6192 , KDM5C|8242 , PRKY|5616 , ZFX|7543 , ...
-
43 genes correlated to 'PATHOLOGY.T'.
-
UCK2|7371 , PRCC|5546 , MAD2L1|4085 , ACBD6|84320 , EPR1|8475 , ...
-
1 gene correlated to 'PATHOLOGY.N'.
-
KIAA0664|23277
-
1 gene correlated to 'PATHOLOGICSPREAD(M)'.
-
CA8|767
-
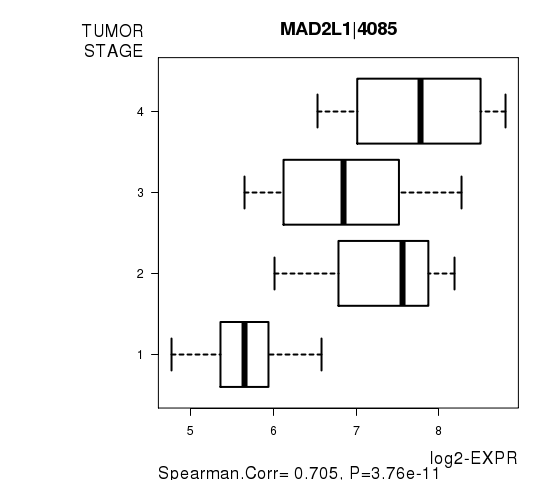
106 genes correlated to 'TUMOR.STAGE'.
-
MAD2L1|4085 , UCK2|7371 , PRCC|5546 , EPR1|8475 , GPR19|2842 , ...
-
No genes correlated to 'Time to Death', and 'KARNOFSKY.PERFORMANCE.SCORE'.
Complete statistical result table is provided in Supplement Table 1
Table 1. Get Full Table This table shows the clinical features, statistical methods used, and the number of genes that are significantly associated with each clinical feature at Q value < 0.05.
| Clinical feature | Statistical test | Significant genes | Associated with | Associated with | ||
|---|---|---|---|---|---|---|
| Time to Death | Cox regression test | N=0 | ||||
| AGE | Spearman correlation test | N=1 | older | N=1 | younger | N=0 |
| GENDER | t test | N=16 | male | N=4 | female | N=12 |
| KARNOFSKY PERFORMANCE SCORE | Spearman correlation test | N=0 | ||||
| PATHOLOGY T | Spearman correlation test | N=43 | higher pT | N=41 | lower pT | N=2 |
| PATHOLOGY N | Spearman correlation test | N=1 | higher pN | N=0 | lower pN | N=1 |
| PATHOLOGICSPREAD(M) | ANOVA test | N=1 | ||||
| TUMOR STAGE | Spearman correlation test | N=106 | higher stage | N=93 | lower stage | N=13 |
Table S1. Basic characteristics of clinical feature: 'Time to Death'
| Time to Death | Duration (Months) | 0.5-182.7 (median=15.5) |
| censored | N = 58 | |
| death | N = 13 | |
| Significant markers | N = 0 |
Table S2. Basic characteristics of clinical feature: 'AGE'
| AGE | Mean (SD) | 59.75 (13) |
| Significant markers | N = 1 | |
| pos. correlated | 1 | |
| neg. correlated | 0 |
Table S3. Get Full Table List of one gene significantly correlated to 'AGE' by Spearman correlation test
| SpearmanCorr | corrP | Q | |
|---|---|---|---|
| MCCC2|64087 | 0.5349 | 1.545e-06 | 0.0281 |
Figure S1. Get High-res Image As an example, this figure shows the association of MCCC2|64087 to 'AGE'. P value = 1.54e-06 with Spearman correlation analysis. The straight line presents the best linear regression.
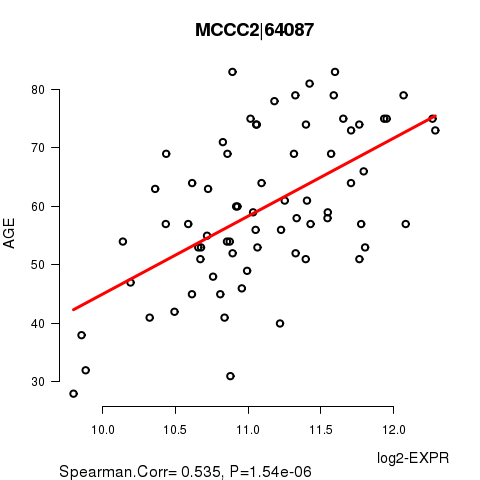
Table S4. Basic characteristics of clinical feature: 'GENDER'
| GENDER | Labels | N |
| FEMALE | 22 | |
| MALE | 52 | |
| Significant markers | N = 16 | |
| Higher in MALE | 4 | |
| Higher in FEMALE | 12 |
Table S5. Get Full Table List of top 10 genes differentially expressed by 'GENDER'
| T(pos if higher in 'MALE') | ttestP | Q | AUC | |
|---|---|---|---|---|
| XIST|7503 | -12.87 | 1.749e-13 | 3.18e-09 | 0.9812 |
| RPS4Y1|6192 | 11.88 | 2.538e-11 | 4.61e-07 | 0.9562 |
| KDM5C|8242 | -8.46 | 2.523e-10 | 4.58e-06 | 0.9423 |
| PRKY|5616 | 7.2 | 3.165e-08 | 0.000575 | 0.9126 |
| ZFX|7543 | -6.71 | 3.323e-08 | 0.000604 | 0.8872 |
| KDM6A|7403 | -6.64 | 3.859e-08 | 0.000701 | 0.9065 |
| TSIX|9383 | -7.35 | 3.863e-08 | 0.000702 | 0.9274 |
| UBA1|7317 | -6.32 | 1.455e-07 | 0.00264 | 0.8741 |
| TXLNG|55787 | -6.05 | 1.724e-07 | 0.00313 | 0.8601 |
| DYNLT1|6993 | 5.79 | 3.751e-07 | 0.00681 | 0.8523 |
Figure S2. Get High-res Image As an example, this figure shows the association of XIST|7503 to 'GENDER'. P value = 1.75e-13 with T-test analysis.
No gene related to 'KARNOFSKY.PERFORMANCE.SCORE'.
Table S6. Basic characteristics of clinical feature: 'KARNOFSKY.PERFORMANCE.SCORE'
| KARNOFSKY.PERFORMANCE.SCORE | Mean (SD) | 86.36 (29) |
| Score | N | |
| 0 | 1 | |
| 90 | 5 | |
| 100 | 5 | |
| Significant markers | N = 0 |
Table S7. Basic characteristics of clinical feature: 'PATHOLOGY.T'
| PATHOLOGY.T | Mean (SD) | 1.86 (0.96) |
| N | ||
| T1 | 38 | |
| T2 | 9 | |
| T3 | 26 | |
| T4 | 1 | |
| Significant markers | N = 43 | |
| pos. correlated | 41 | |
| neg. correlated | 2 |
Table S8. Get Full Table List of top 10 genes significantly correlated to 'PATHOLOGY.T' by Spearman correlation test
| SpearmanCorr | corrP | Q | |
|---|---|---|---|
| UCK2|7371 | 0.66 | 1.592e-10 | 2.89e-06 |
| PRCC|5546 | 0.5992 | 1.703e-08 | 0.00031 |
| MAD2L1|4085 | 0.5921 | 2.761e-08 | 0.000502 |
| ACBD6|84320 | 0.5798 | 6.178e-08 | 0.00112 |
| EPR1|8475 | 0.5777 | 8.741e-08 | 0.00159 |
| CCT3|7203 | 0.5733 | 9.35e-08 | 0.0017 |
| NUF2|83540 | 0.5731 | 9.506e-08 | 0.00173 |
| PTHLH|5744 | 0.5767 | 1.413e-07 | 0.00257 |
| UBE2T|29089 | 0.5666 | 1.421e-07 | 0.00258 |
| GPR19|2842 | 0.5732 | 1.425e-07 | 0.00259 |
Figure S3. Get High-res Image As an example, this figure shows the association of UCK2|7371 to 'PATHOLOGY.T'. P value = 1.59e-10 with Spearman correlation analysis.
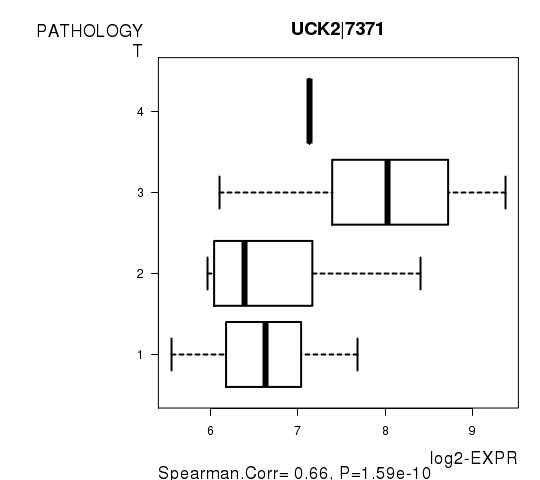
Table S9. Basic characteristics of clinical feature: 'PATHOLOGY.N'
| PATHOLOGY.N | Mean (SD) | 0.59 (0.68) |
| N | ||
| N0 | 15 | |
| N1 | 11 | |
| N2 | 3 | |
| Significant markers | N = 1 | |
| pos. correlated | 0 | |
| neg. correlated | 1 |
Table S10. Get Full Table List of one gene significantly correlated to 'PATHOLOGY.N' by Spearman correlation test
| SpearmanCorr | corrP | Q | |
|---|---|---|---|
| KIAA0664|23277 | -0.7639 | 1.422e-06 | 0.0258 |
Figure S4. Get High-res Image As an example, this figure shows the association of KIAA0664|23277 to 'PATHOLOGY.N'. P value = 1.42e-06 with Spearman correlation analysis.
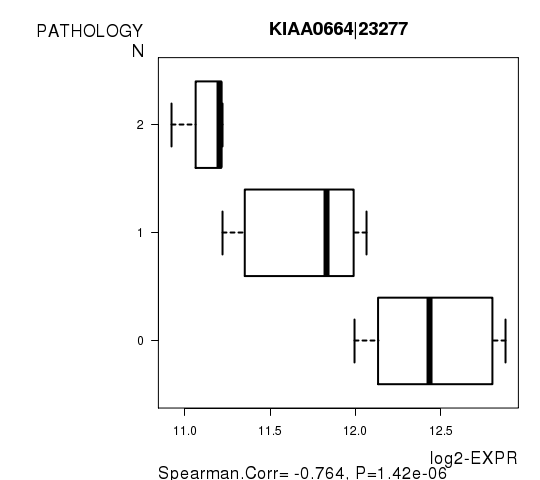
Table S11. Basic characteristics of clinical feature: 'PATHOLOGICSPREAD(M)'
| PATHOLOGICSPREAD(M) | Labels | N |
| M0 | 46 | |
| M1 | 5 | |
| MX | 16 | |
| Significant markers | N = 1 |
Table S12. Get Full Table List of one gene differentially expressed by 'PATHOLOGICSPREAD(M)'
| ANOVA_P | Q | |
|---|---|---|
| CA8|767 | 7.982e-08 | 0.00145 |
Figure S5. Get High-res Image As an example, this figure shows the association of CA8|767 to 'PATHOLOGICSPREAD(M)'. P value = 7.98e-08 with ANOVA analysis.
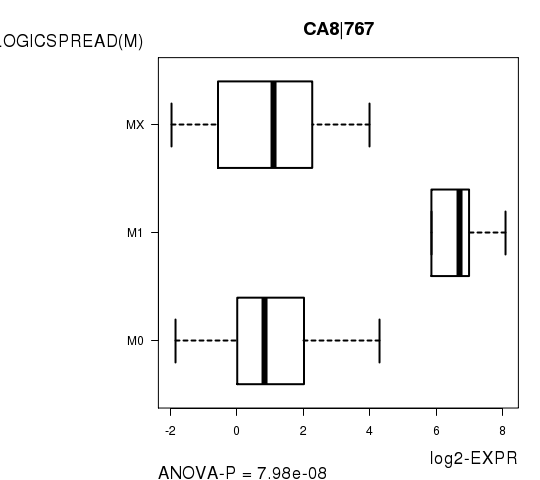
Table S13. Basic characteristics of clinical feature: 'TUMOR.STAGE'
| TUMOR.STAGE | Mean (SD) | 2.02 (1.2) |
| N | ||
| Stage 1 | 35 | |
| Stage 2 | 3 | |
| Stage 3 | 20 | |
| Stage 4 | 8 | |
| Significant markers | N = 106 | |
| pos. correlated | 93 | |
| neg. correlated | 13 |
Table S14. Get Full Table List of top 10 genes significantly correlated to 'TUMOR.STAGE' by Spearman correlation test
| SpearmanCorr | corrP | Q | |
|---|---|---|---|
| MAD2L1|4085 | 0.7054 | 3.756e-11 | 6.83e-07 |
| UCK2|7371 | 0.6701 | 7.557e-10 | 1.37e-05 |
| PRCC|5546 | 0.644 | 5.435e-09 | 9.88e-05 |
| EPR1|8475 | 0.6391 | 1.01e-08 | 0.000184 |
| GPR19|2842 | 0.6423 | 1.06e-08 | 0.000193 |
| TCTA|6988 | -0.6276 | 1.701e-08 | 0.000309 |
| ORC6L|23594 | 0.6156 | 3.777e-08 | 0.000686 |
| CDCA5|113130 | 0.6149 | 3.956e-08 | 0.000719 |
| PTHLH|5744 | 0.6258 | 4.143e-08 | 0.000753 |
| TROAP|10024 | 0.6128 | 4.53e-08 | 0.000823 |
Figure S6. Get High-res Image As an example, this figure shows the association of MAD2L1|4085 to 'TUMOR.STAGE'. P value = 3.76e-11 with Spearman correlation analysis.
-
Expresson data file = KIRP-TP.uncv2.mRNAseq_RSEM_normalized_log2.txt
-
Clinical data file = KIRP-TP.clin.merged.picked.txt
-
Number of patients = 74
-
Number of genes = 18174
-
Number of clinical features = 8
For survival clinical features, Wald's test in univariate Cox regression analysis with proportional hazards model (Andersen and Gill 1982) was used to estimate the P values using the 'coxph' function in R. Kaplan-Meier survival curves were plot using the four quartile subgroups of patients based on expression levels
For continuous numerical clinical features, Spearman's rank correlation coefficients (Spearman 1904) and two-tailed P values were estimated using 'cor.test' function in R
For two-class clinical features, two-tailed Student's t test with unequal variance (Lehmann and Romano 2005) was applied to compare the log2-expression levels between the two clinical classes using 't.test' function in R
For multi-class clinical features (ordinal or nominal), one-way analysis of variance (Howell 2002) was applied to compare the log2-expression levels between different clinical classes using 'anova' function in R
For multiple hypothesis correction, Q value is the False Discovery Rate (FDR) analogue of the P value (Benjamini and Hochberg 1995), defined as the minimum FDR at which the test may be called significant. We used the 'Benjamini and Hochberg' method of 'p.adjust' function in R to convert P values into Q values.
This is an experimental feature. The full results of the analysis summarized in this report can be downloaded from the TCGA Data Coordination Center.