This pipeline computes the correlation between significant arm-level copy number variations (cnvs) and subtypes.
Testing the association between copy number variation 59 arm-level results and 8 molecular subtypes across 117 patients, 28 significant findings detected with Q value < 0.25.
-
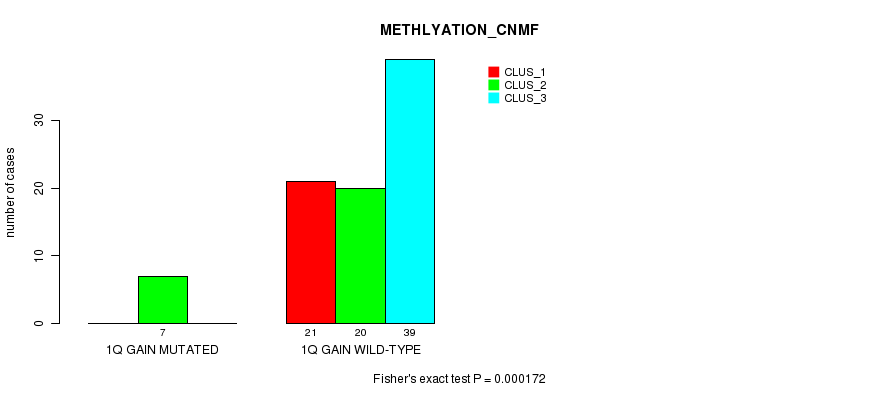
1q gain cnv correlated to 'METHLYATION_CNMF'.
-
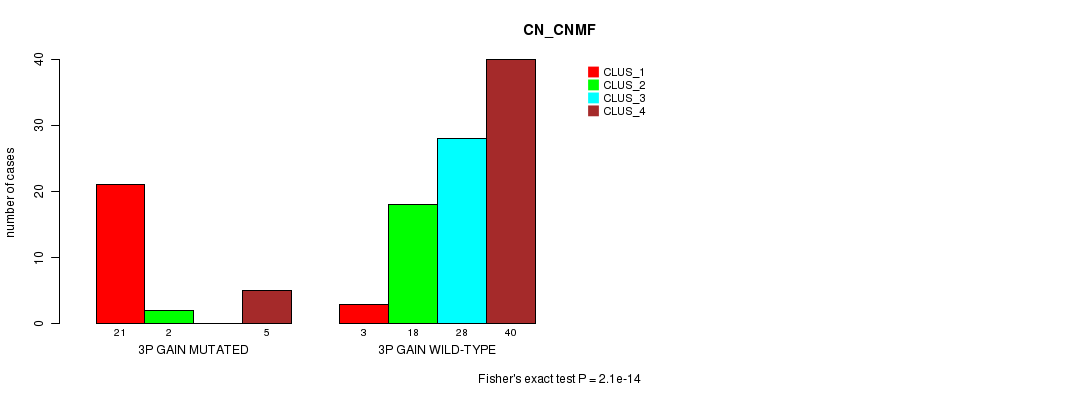
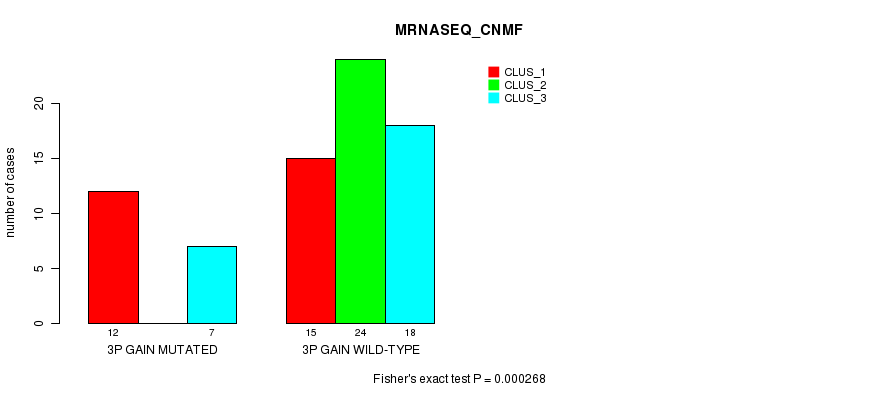
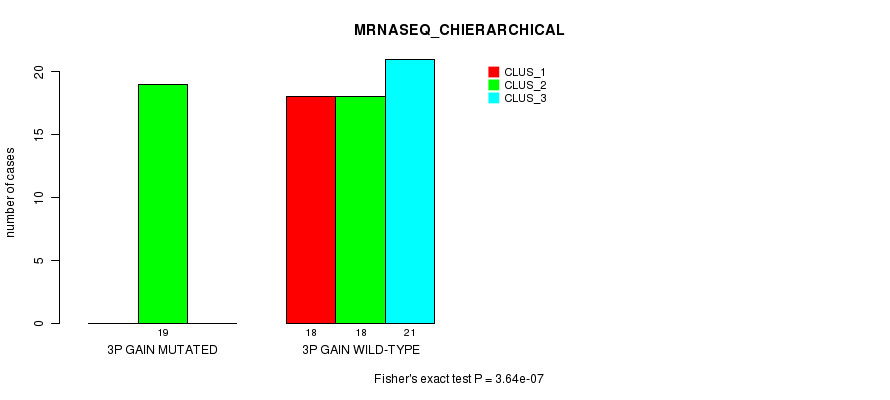
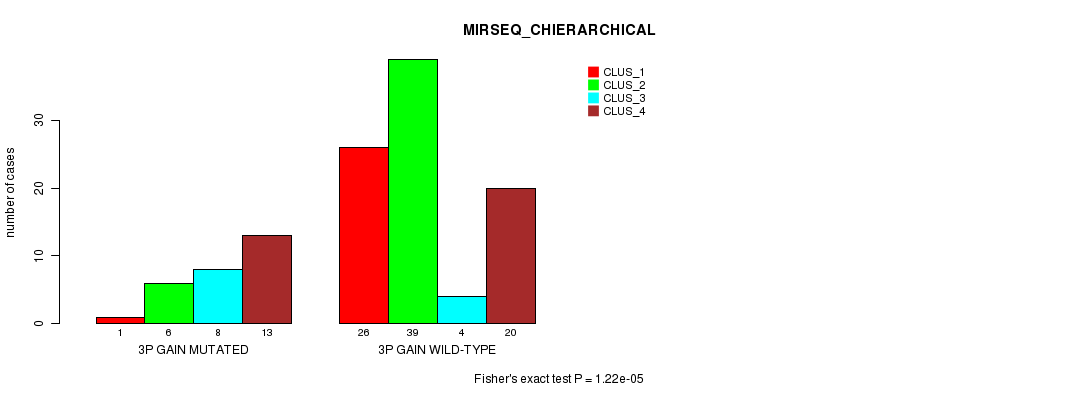
3p gain cnv correlated to 'CN_CNMF', 'MRNASEQ_CNMF', 'MRNASEQ_CHIERARCHICAL', and 'MIRSEQ_CHIERARCHICAL'.
-
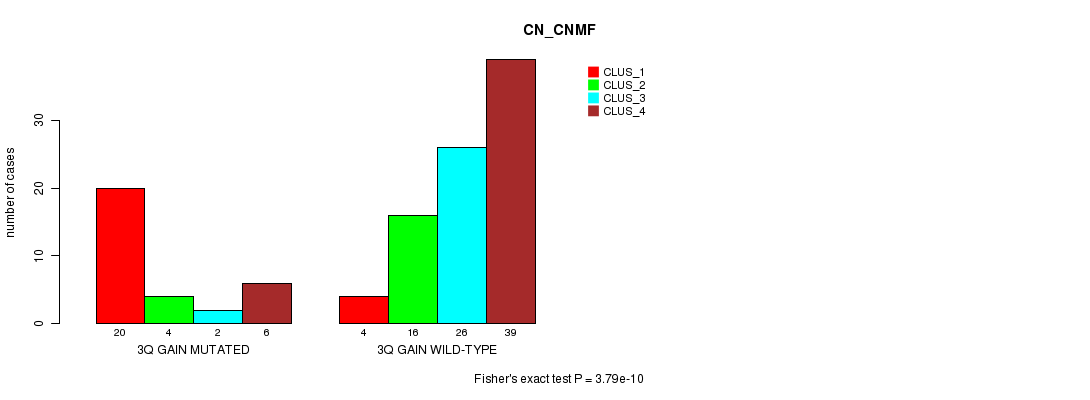
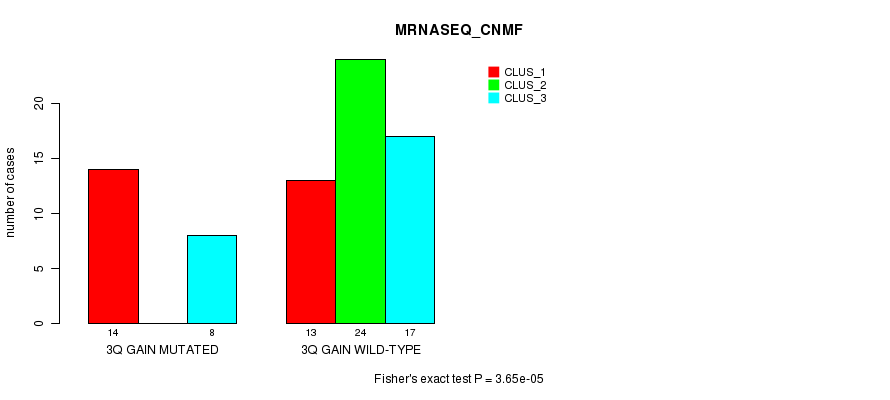
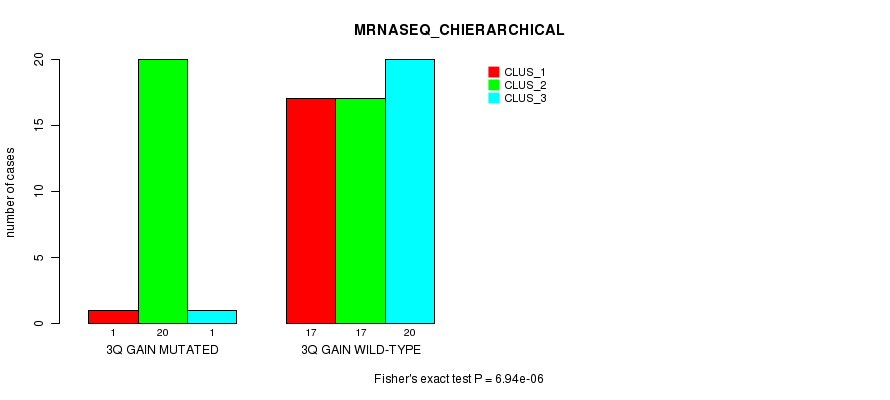
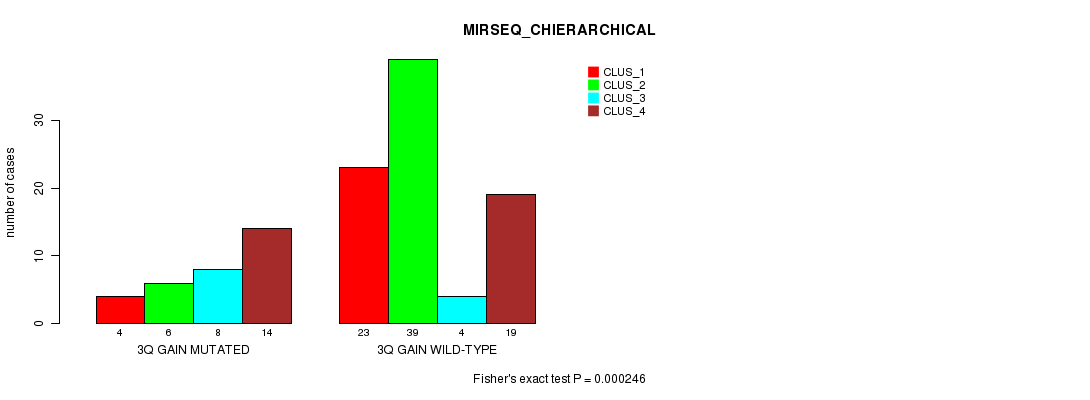
3q gain cnv correlated to 'CN_CNMF', 'MRNASEQ_CNMF', 'MRNASEQ_CHIERARCHICAL', and 'MIRSEQ_CHIERARCHICAL'.
-
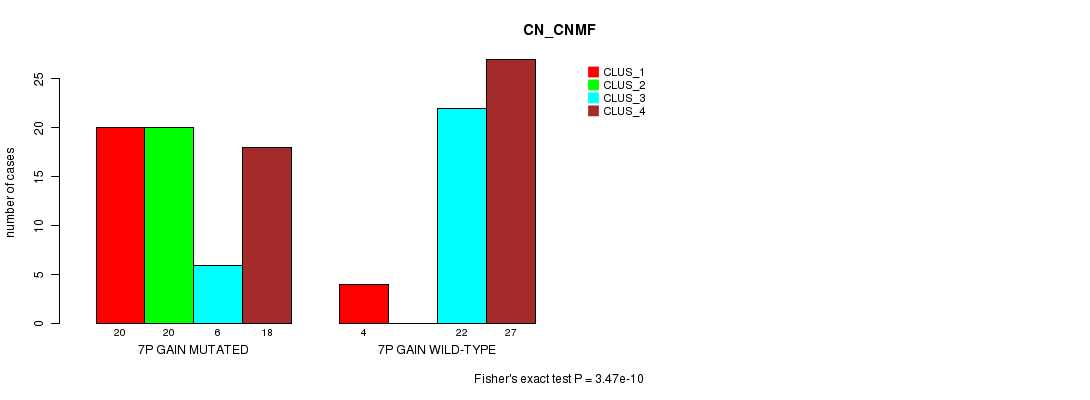
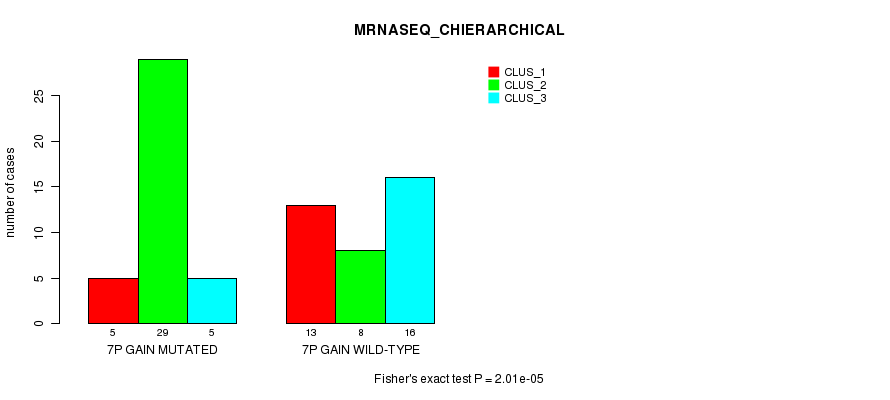
7p gain cnv correlated to 'CN_CNMF', 'METHLYATION_CNMF', 'MRNASEQ_CNMF', and 'MRNASEQ_CHIERARCHICAL'.
-
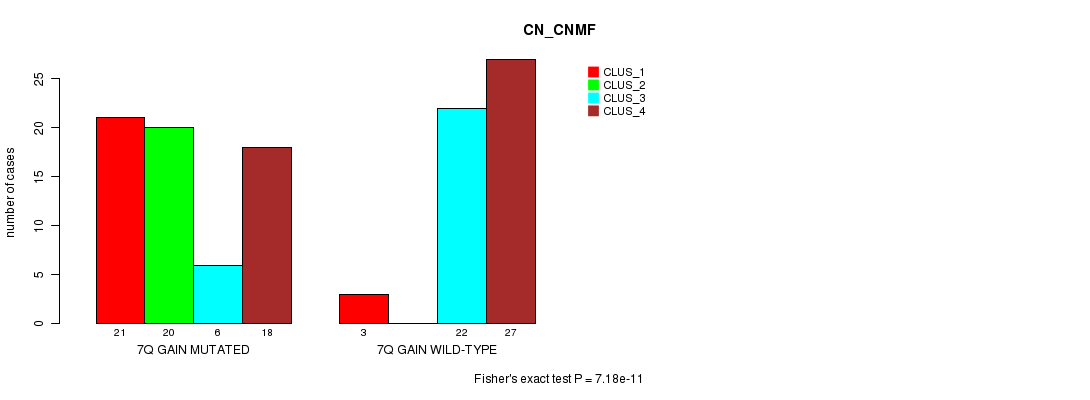
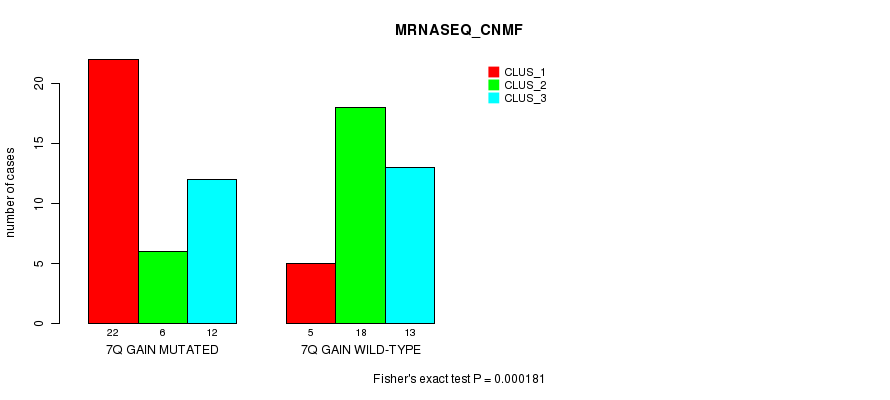
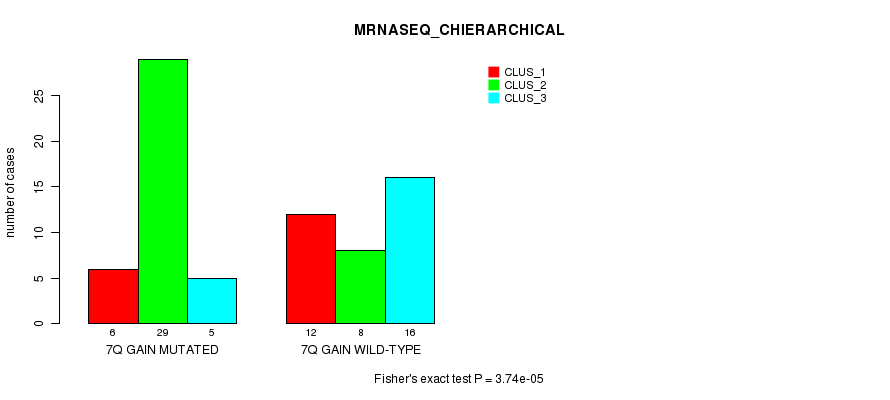
7q gain cnv correlated to 'CN_CNMF', 'MRNASEQ_CNMF', and 'MRNASEQ_CHIERARCHICAL'.
-
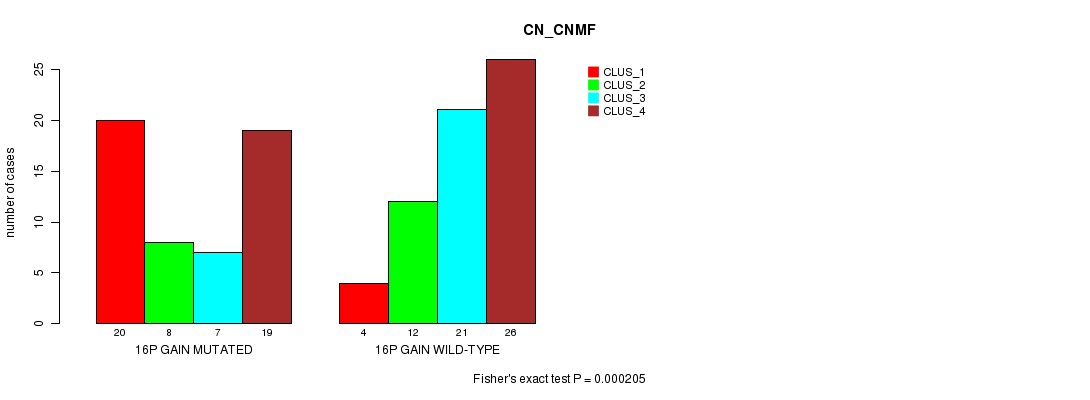
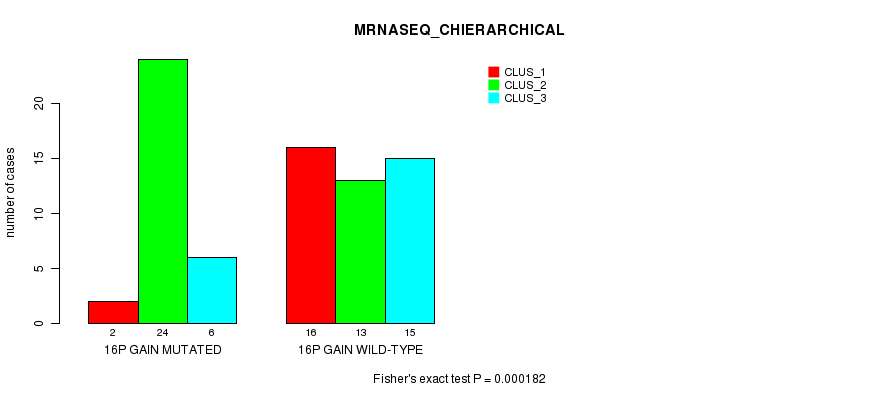
16p gain cnv correlated to 'CN_CNMF' and 'MRNASEQ_CHIERARCHICAL'.
-
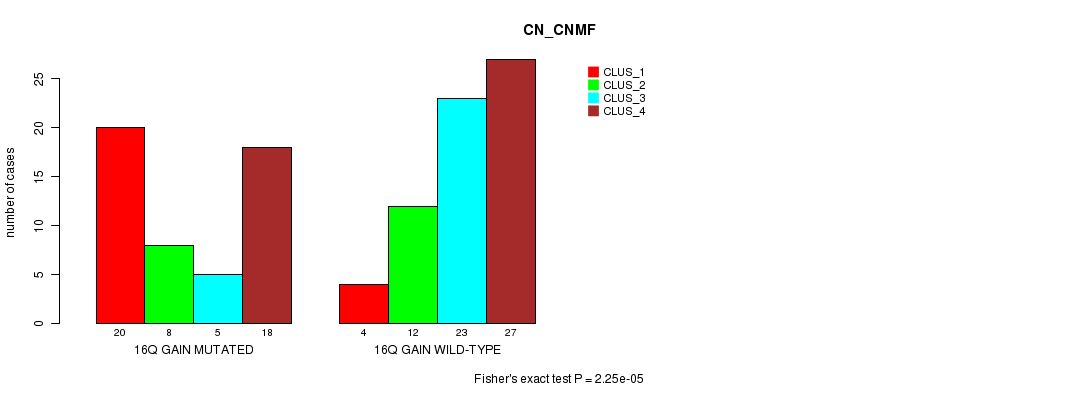
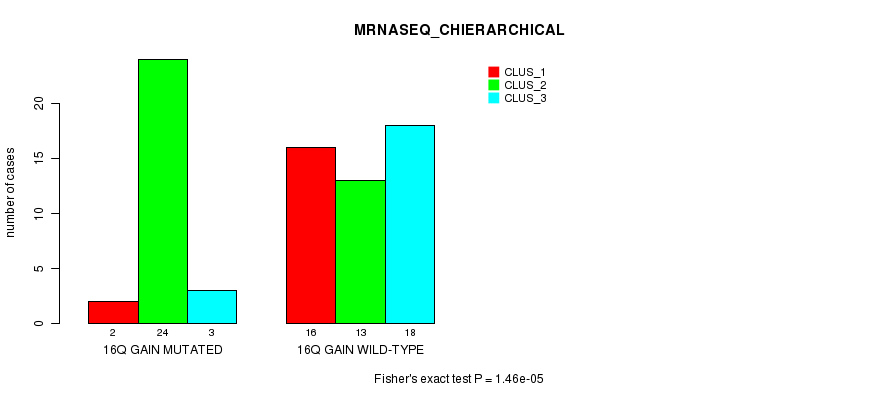
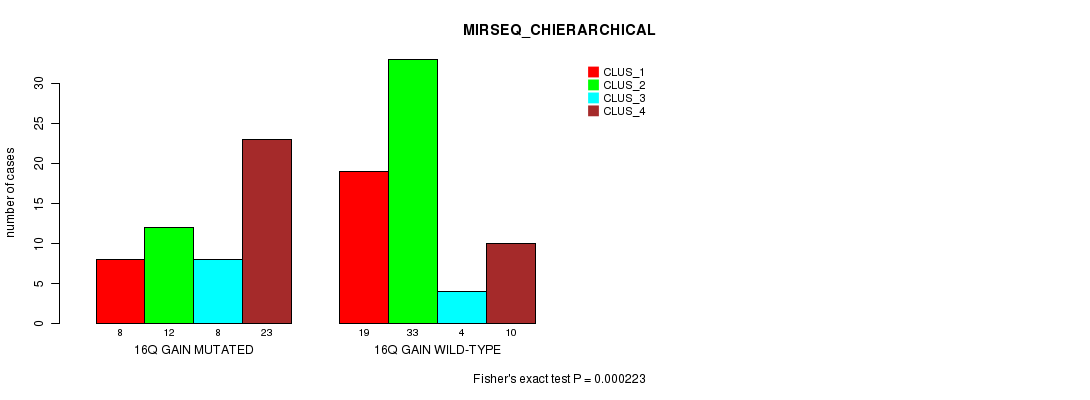
16q gain cnv correlated to 'CN_CNMF', 'MRNASEQ_CHIERARCHICAL', and 'MIRSEQ_CHIERARCHICAL'.
-
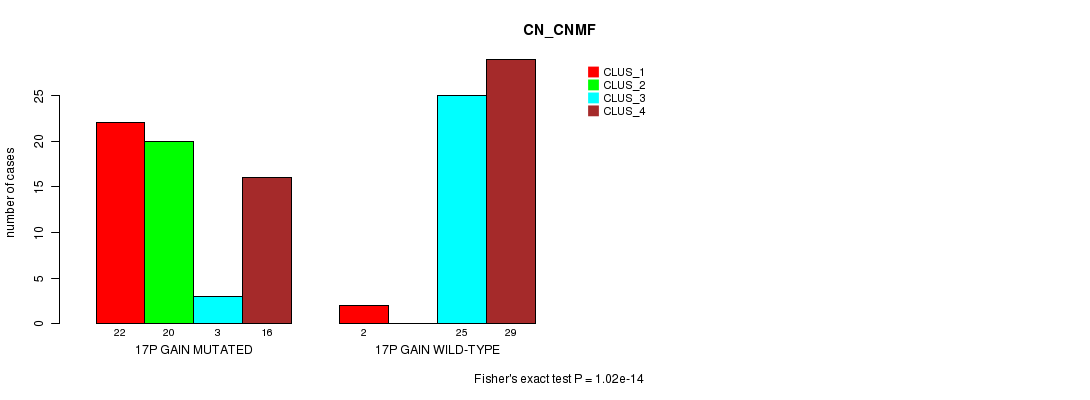
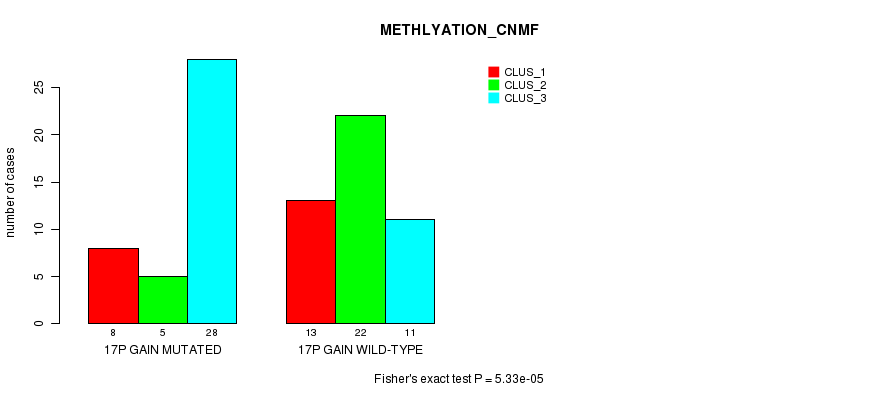
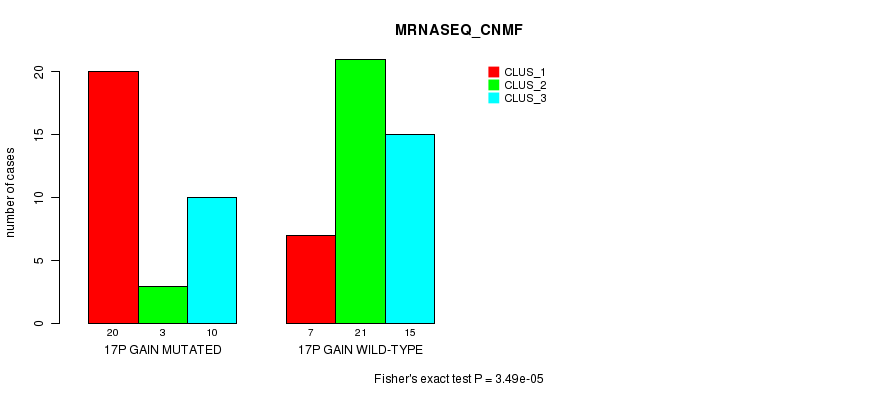
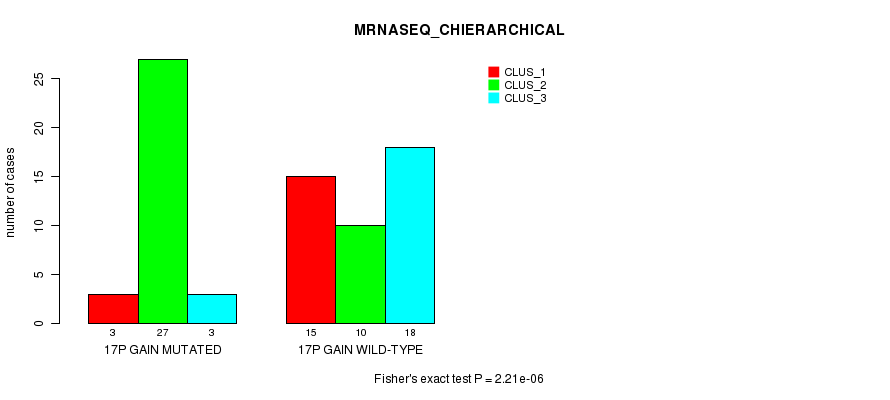
17p gain cnv correlated to 'CN_CNMF', 'METHLYATION_CNMF', 'MRNASEQ_CNMF', and 'MRNASEQ_CHIERARCHICAL'.
-
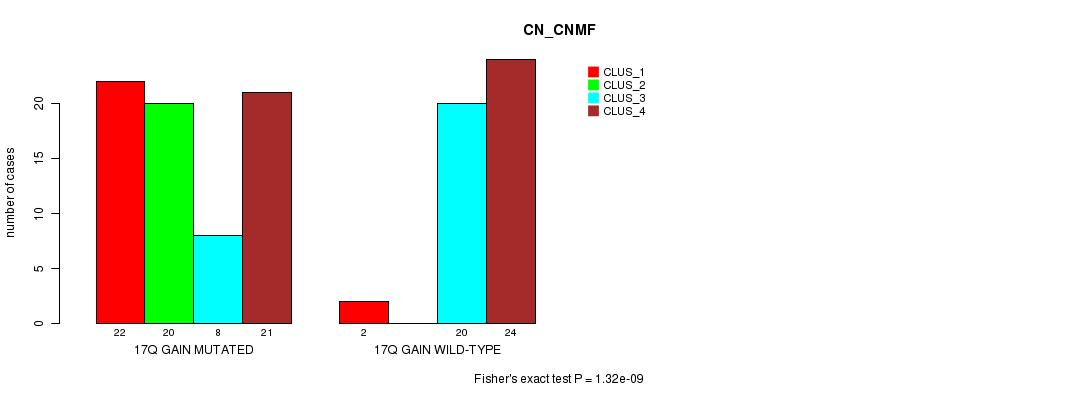
17q gain cnv correlated to 'CN_CNMF'.
-
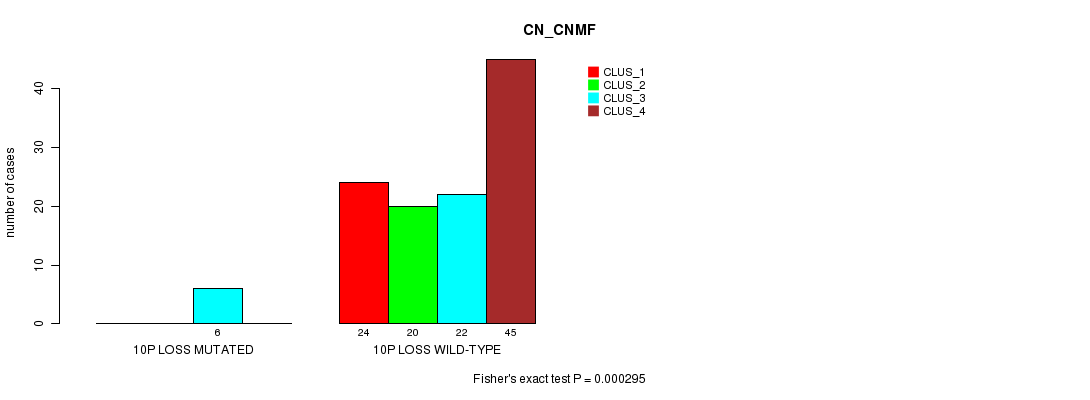
10p loss cnv correlated to 'CN_CNMF'.
-
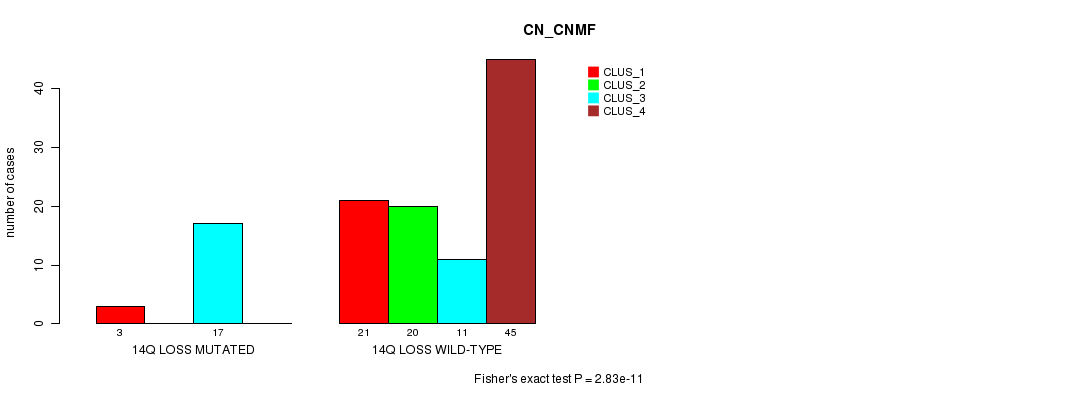
14q loss cnv correlated to 'CN_CNMF'.
Table 1. Get Full Table Overview of the association between significant copy number variation of 59 arm-level results and 8 molecular subtypes. Shown in the table are P values (Q values). Thresholded by Q value < 0.25, 28 significant findings detected.
|
Molecular subtypes |
MRNA CNMF |
MRNA CHIERARCHICAL |
CN CNMF |
METHLYATION CNMF |
MRNASEQ CNMF |
MRNASEQ CHIERARCHICAL |
MIRSEQ CNMF |
MIRSEQ CHIERARCHICAL |
||
| nCNV (%) | nWild-Type | Fisher's exact test | Fisher's exact test | Fisher's exact test | Fisher's exact test | Fisher's exact test | Fisher's exact test | Fisher's exact test | Fisher's exact test | |
| 3p gain | 28 (24%) | 89 |
0.302 (1.00) |
0.0559 (1.00) |
2.1e-14 (8.44e-12) |
0.0297 (1.00) |
0.000268 (0.101) |
3.64e-07 (0.000144) |
0.0375 (1.00) |
1.22e-05 (0.00477) |
| 3q gain | 32 (27%) | 85 |
0.302 (1.00) |
0.0559 (1.00) |
3.79e-10 (1.5e-07) |
0.0245 (1.00) |
3.65e-05 (0.0141) |
6.94e-06 (0.00273) |
0.00911 (1.00) |
0.000246 (0.0928) |
| 7p gain | 64 (55%) | 53 |
0.633 (1.00) |
0.432 (1.00) |
3.47e-10 (1.38e-07) |
0.000334 (0.125) |
5.65e-05 (0.0217) |
2.01e-05 (0.00785) |
0.011 (1.00) |
0.00896 (1.00) |
| 17p gain | 61 (52%) | 56 |
0.633 (1.00) |
0.432 (1.00) |
1.02e-14 (4.08e-12) |
5.33e-05 (0.0205) |
3.49e-05 (0.0135) |
2.21e-06 (0.000871) |
0.129 (1.00) |
0.00197 (0.713) |
| 7q gain | 65 (56%) | 52 |
0.633 (1.00) |
0.432 (1.00) |
7.18e-11 (2.86e-08) |
0.0011 (0.405) |
0.000181 (0.0691) |
3.74e-05 (0.0144) |
0.00419 (1.00) |
0.0113 (1.00) |
| 16q gain | 51 (44%) | 66 |
0.302 (1.00) |
0.0559 (1.00) |
2.25e-05 (0.00875) |
0.117 (1.00) |
0.00419 (1.00) |
1.46e-05 (0.00571) |
0.00179 (0.65) |
0.000223 (0.0846) |
| 16p gain | 54 (46%) | 63 |
0.126 (1.00) |
0.0699 (1.00) |
0.000205 (0.0778) |
0.352 (1.00) |
0.00874 (1.00) |
0.000182 (0.0695) |
0.00268 (0.96) |
0.000706 (0.264) |
| 1q gain | 8 (7%) | 109 |
0.438 (1.00) |
0.207 (1.00) |
0.000172 (0.0658) |
0.00232 (0.836) |
0.00827 (1.00) |
0.433 (1.00) |
0.145 (1.00) |
|
| 17q gain | 71 (61%) | 46 |
0.308 (1.00) |
0.808 (1.00) |
1.32e-09 (5.23e-07) |
0.0143 (1.00) |
0.0144 (1.00) |
0.000926 (0.344) |
0.362 (1.00) |
0.156 (1.00) |
| 10p loss | 6 (5%) | 111 |
1 (1.00) |
0.000295 (0.111) |
0.199 (1.00) |
0.269 (1.00) |
0.18 (1.00) |
0.265 (1.00) |
0.675 (1.00) |
|
| 14q loss | 20 (17%) | 97 |
1 (1.00) |
0.385 (1.00) |
2.83e-11 (1.13e-08) |
0.39 (1.00) |
0.135 (1.00) |
0.0977 (1.00) |
0.457 (1.00) |
0.968 (1.00) |
| 2p gain | 11 (9%) | 106 |
0.55 (1.00) |
0.75 (1.00) |
0.00302 (1.00) |
0.149 (1.00) |
0.585 (1.00) |
0.338 (1.00) |
0.869 (1.00) |
0.0669 (1.00) |
| 2q gain | 13 (11%) | 104 |
0.55 (1.00) |
0.75 (1.00) |
0.00178 (0.65) |
0.286 (1.00) |
0.329 (1.00) |
0.205 (1.00) |
0.856 (1.00) |
0.174 (1.00) |
| 4p gain | 4 (3%) | 113 |
0.175 (1.00) |
0.438 (1.00) |
0.457 (1.00) |
1 (1.00) |
0.683 (1.00) |
0.881 (1.00) |
||
| 4q gain | 3 (3%) | 114 |
0.438 (1.00) |
0.777 (1.00) |
0.645 (1.00) |
0.602 (1.00) |
0.767 (1.00) |
0.618 (1.00) |
||
| 5p gain | 11 (9%) | 106 |
0.175 (1.00) |
0.23 (1.00) |
0.18 (1.00) |
0.156 (1.00) |
0.8 (1.00) |
0.697 (1.00) |
0.731 (1.00) |
|
| 5q gain | 11 (9%) | 106 |
0.175 (1.00) |
0.23 (1.00) |
0.18 (1.00) |
0.579 (1.00) |
0.8 (1.00) |
0.919 (1.00) |
0.301 (1.00) |
|
| 6p gain | 4 (3%) | 113 |
0.438 (1.00) |
0.438 (1.00) |
0.456 (1.00) |
0.114 (1.00) |
0.677 (1.00) |
0.165 (1.00) |
0.374 (1.00) |
|
| 6q gain | 3 (3%) | 114 |
0.438 (1.00) |
0.113 (1.00) |
0.41 (1.00) |
1 (1.00) |
0.231 (1.00) |
0.397 (1.00) |
||
| 8p gain | 7 (6%) | 110 |
1 (1.00) |
0.72 (1.00) |
0.0776 (1.00) |
0.732 (1.00) |
0.232 (1.00) |
0.617 (1.00) |
0.854 (1.00) |
|
| 8q gain | 9 (8%) | 108 |
1 (1.00) |
0.371 (1.00) |
0.0234 (1.00) |
0.243 (1.00) |
0.0683 (1.00) |
0.187 (1.00) |
0.767 (1.00) |
|
| 10p gain | 4 (3%) | 113 |
1 (1.00) |
0.173 (1.00) |
0.645 (1.00) |
0.602 (1.00) |
0.189 (1.00) |
0.881 (1.00) |
||
| 10q gain | 3 (3%) | 114 |
1 (1.00) |
0.31 (1.00) |
0.454 (1.00) |
0.341 (1.00) |
||||
| 12p gain | 36 (31%) | 81 |
1 (1.00) |
0.0909 (1.00) |
0.0345 (1.00) |
0.276 (1.00) |
0.161 (1.00) |
0.0648 (1.00) |
0.146 (1.00) |
0.0968 (1.00) |
| 12q gain | 36 (31%) | 81 |
1 (1.00) |
0.0909 (1.00) |
0.0345 (1.00) |
0.276 (1.00) |
0.161 (1.00) |
0.0648 (1.00) |
0.146 (1.00) |
0.0968 (1.00) |
| 13q gain | 14 (12%) | 103 |
1 (1.00) |
0.0454 (1.00) |
0.455 (1.00) |
0.324 (1.00) |
0.0445 (1.00) |
0.747 (1.00) |
0.0852 (1.00) |
|
| 18p gain | 6 (5%) | 111 |
0.55 (1.00) |
0.141 (1.00) |
0.0489 (1.00) |
0.327 (1.00) |
0.863 (1.00) |
1 (1.00) |
0.845 (1.00) |
0.877 (1.00) |
| 18q gain | 4 (3%) | 113 |
0.438 (1.00) |
0.00209 (0.753) |
0.327 (1.00) |
0.77 (1.00) |
0.432 (1.00) |
0.91 (1.00) |
0.331 (1.00) |
|
| 20p gain | 37 (32%) | 80 |
0.126 (1.00) |
0.162 (1.00) |
0.00294 (1.00) |
0.106 (1.00) |
0.000722 (0.269) |
0.0152 (1.00) |
0.305 (1.00) |
0.125 (1.00) |
| 20q gain | 38 (32%) | 79 |
0.315 (1.00) |
0.119 (1.00) |
0.00595 (1.00) |
0.293 (1.00) |
0.000813 (0.303) |
0.0381 (1.00) |
0.179 (1.00) |
0.371 (1.00) |
| 21q gain | 4 (3%) | 113 |
0.438 (1.00) |
0.317 (1.00) |
0.11 (1.00) |
0.0492 (1.00) |
||||
| Xq gain | 4 (3%) | 113 |
1 (1.00) |
0.113 (1.00) |
0.456 (1.00) |
0.457 (1.00) |
1 (1.00) |
0.57 (1.00) |
0.881 (1.00) |
|
| 1p loss | 12 (10%) | 105 |
1 (1.00) |
0.119 (1.00) |
1 (1.00) |
0.611 (1.00) |
0.589 (1.00) |
0.0114 (1.00) |
0.0873 (1.00) |
|
| 1q loss | 7 (6%) | 110 |
1 (1.00) |
0.0998 (1.00) |
0.198 (1.00) |
0.103 (1.00) |
0.432 (1.00) |
0.0359 (1.00) |
0.0124 (1.00) |
|
| 3p loss | 7 (6%) | 110 |
0.438 (1.00) |
0.00335 (1.00) |
0.00274 (0.979) |
0.058 (1.00) |
0.0149 (1.00) |
0.0591 (1.00) |
0.221 (1.00) |
|
| 3q loss | 3 (3%) | 114 |
0.0248 (1.00) |
0.0401 (1.00) |
0.0288 (1.00) |
0.0762 (1.00) |
0.521 (1.00) |
0.72 (1.00) |
||
| 4p loss | 10 (9%) | 107 |
1 (1.00) |
0.0826 (1.00) |
0.00141 (0.518) |
0.00399 (1.00) |
0.0866 (1.00) |
0.853 (1.00) |
0.9 (1.00) |
|
| 4q loss | 10 (9%) | 107 |
1 (1.00) |
0.0112 (1.00) |
0.00141 (0.518) |
0.0999 (1.00) |
0.0683 (1.00) |
0.853 (1.00) |
0.698 (1.00) |
|
| 5p loss | 5 (4%) | 112 |
0.286 (1.00) |
0.434 (1.00) |
0.114 (1.00) |
0.0626 (1.00) |
0.236 (1.00) |
0.916 (1.00) |
||
| 5q loss | 5 (4%) | 112 |
0.411 (1.00) |
0.434 (1.00) |
0.41 (1.00) |
0.211 (1.00) |
0.236 (1.00) |
0.916 (1.00) |
||
| 6p loss | 9 (8%) | 108 |
1 (1.00) |
0.107 (1.00) |
0.568 (1.00) |
0.468 (1.00) |
1 (1.00) |
0.331 (1.00) |
0.539 (1.00) |
|
| 6q loss | 11 (9%) | 106 |
1 (1.00) |
0.0822 (1.00) |
0.205 (1.00) |
0.374 (1.00) |
0.558 (1.00) |
0.783 (1.00) |
0.693 (1.00) |
|
| 8p loss | 3 (3%) | 114 |
1 (1.00) |
0.143 (1.00) |
1 (1.00) |
0.618 (1.00) |
||||
| 9p loss | 14 (12%) | 103 |
1 (1.00) |
0.75 (1.00) |
0.0123 (1.00) |
0.00135 (0.495) |
0.00782 (1.00) |
0.0678 (1.00) |
0.232 (1.00) |
0.587 (1.00) |
| 9q loss | 14 (12%) | 103 |
1 (1.00) |
0.0531 (1.00) |
0.00125 (0.463) |
0.0256 (1.00) |
0.131 (1.00) |
0.37 (1.00) |
0.254 (1.00) |
|
| 10q loss | 7 (6%) | 110 |
0.438 (1.00) |
0.00335 (1.00) |
0.0868 (1.00) |
0.269 (1.00) |
0.0871 (1.00) |
0.617 (1.00) |
0.221 (1.00) |
|
| 11p loss | 8 (7%) | 109 |
1 (1.00) |
0.0664 (1.00) |
0.0434 (1.00) |
0.269 (1.00) |
0.145 (1.00) |
1 (1.00) |
0.447 (1.00) |
|
| 11q loss | 10 (9%) | 107 |
0.0362 (1.00) |
0.00652 (1.00) |
0.296 (1.00) |
0.0563 (1.00) |
0.968 (1.00) |
0.9 (1.00) |
||
| 13q loss | 10 (9%) | 107 |
1 (1.00) |
0.178 (1.00) |
0.00141 (0.518) |
0.091 (1.00) |
0.403 (1.00) |
0.355 (1.00) |
0.234 (1.00) |
|
| 15q loss | 10 (9%) | 107 |
1 (1.00) |
0.0362 (1.00) |
0.32 (1.00) |
0.579 (1.00) |
0.487 (1.00) |
0.573 (1.00) |
0.816 (1.00) |
|
| 16q loss | 3 (3%) | 114 |
0.143 (1.00) |
0.0401 (1.00) |
0.862 (1.00) |
0.286 (1.00) |
||||
| 17p loss | 5 (4%) | 112 |
0.438 (1.00) |
0.411 (1.00) |
0.0106 (1.00) |
0.0288 (1.00) |
0.0762 (1.00) |
0.219 (1.00) |
0.251 (1.00) |
|
| 18p loss | 17 (15%) | 100 |
1 (1.00) |
0.905 (1.00) |
0.0675 (1.00) |
0.0772 (1.00) |
0.0114 (1.00) |
0.158 (1.00) |
0.445 (1.00) |
|
| 18q loss | 18 (15%) | 99 |
1 (1.00) |
0.91 (1.00) |
0.0318 (1.00) |
0.0392 (1.00) |
0.00363 (1.00) |
0.322 (1.00) |
0.373 (1.00) |
|
| 19p loss | 4 (3%) | 113 |
0.0954 (1.00) |
1 (1.00) |
0.746 (1.00) |
0.331 (1.00) |
||||
| 19q loss | 3 (3%) | 114 |
0.143 (1.00) |
0.603 (1.00) |
0.279 (1.00) |
0.618 (1.00) |
||||
| 21q loss | 12 (10%) | 105 |
0.55 (1.00) |
0.413 (1.00) |
0.5 (1.00) |
0.355 (1.00) |
0.246 (1.00) |
0.728 (1.00) |
0.219 (1.00) |
0.284 (1.00) |
| 22q loss | 21 (18%) | 96 |
1 (1.00) |
0.00916 (1.00) |
0.0971 (1.00) |
0.673 (1.00) |
0.0477 (1.00) |
0.186 (1.00) |
0.433 (1.00) |
|
| Xq loss | 3 (3%) | 114 |
1 (1.00) |
0.31 (1.00) |
0.767 (1.00) |
0.1 (1.00) |
P value = 0.000172 (Fisher's exact test), Q value = 0.066
Table S1. Gene #1: '1q gain mutation analysis' versus Clinical Feature #4: 'METHLYATION_CNMF'
| nPatients | CLUS_1 | CLUS_2 | CLUS_3 |
|---|---|---|---|
| ALL | 21 | 27 | 39 |
| 1Q GAIN MUTATED | 0 | 7 | 0 |
| 1Q GAIN WILD-TYPE | 21 | 20 | 39 |
Figure S1. Get High-res Image Gene #1: '1q gain mutation analysis' versus Clinical Feature #4: 'METHLYATION_CNMF'
P value = 2.1e-14 (Fisher's exact test), Q value = 8.4e-12
Table S2. Gene #4: '3p gain mutation analysis' versus Clinical Feature #3: 'CN_CNMF'
| nPatients | CLUS_1 | CLUS_2 | CLUS_3 | CLUS_4 |
|---|---|---|---|---|
| ALL | 24 | 20 | 28 | 45 |
| 3P GAIN MUTATED | 21 | 2 | 0 | 5 |
| 3P GAIN WILD-TYPE | 3 | 18 | 28 | 40 |
Figure S2. Get High-res Image Gene #4: '3p gain mutation analysis' versus Clinical Feature #3: 'CN_CNMF'
P value = 0.000268 (Fisher's exact test), Q value = 0.1
Table S3. Gene #4: '3p gain mutation analysis' versus Clinical Feature #5: 'MRNASEQ_CNMF'
| nPatients | CLUS_1 | CLUS_2 | CLUS_3 |
|---|---|---|---|
| ALL | 27 | 24 | 25 |
| 3P GAIN MUTATED | 12 | 0 | 7 |
| 3P GAIN WILD-TYPE | 15 | 24 | 18 |
Figure S3. Get High-res Image Gene #4: '3p gain mutation analysis' versus Clinical Feature #5: 'MRNASEQ_CNMF'
P value = 3.64e-07 (Fisher's exact test), Q value = 0.00014
Table S4. Gene #4: '3p gain mutation analysis' versus Clinical Feature #6: 'MRNASEQ_CHIERARCHICAL'
| nPatients | CLUS_1 | CLUS_2 | CLUS_3 |
|---|---|---|---|
| ALL | 18 | 37 | 21 |
| 3P GAIN MUTATED | 0 | 19 | 0 |
| 3P GAIN WILD-TYPE | 18 | 18 | 21 |
Figure S4. Get High-res Image Gene #4: '3p gain mutation analysis' versus Clinical Feature #6: 'MRNASEQ_CHIERARCHICAL'
P value = 1.22e-05 (Fisher's exact test), Q value = 0.0048
Table S5. Gene #4: '3p gain mutation analysis' versus Clinical Feature #8: 'MIRSEQ_CHIERARCHICAL'
| nPatients | CLUS_1 | CLUS_2 | CLUS_3 | CLUS_4 |
|---|---|---|---|---|
| ALL | 27 | 45 | 12 | 33 |
| 3P GAIN MUTATED | 1 | 6 | 8 | 13 |
| 3P GAIN WILD-TYPE | 26 | 39 | 4 | 20 |
Figure S5. Get High-res Image Gene #4: '3p gain mutation analysis' versus Clinical Feature #8: 'MIRSEQ_CHIERARCHICAL'
P value = 3.79e-10 (Fisher's exact test), Q value = 1.5e-07
Table S6. Gene #5: '3q gain mutation analysis' versus Clinical Feature #3: 'CN_CNMF'
| nPatients | CLUS_1 | CLUS_2 | CLUS_3 | CLUS_4 |
|---|---|---|---|---|
| ALL | 24 | 20 | 28 | 45 |
| 3Q GAIN MUTATED | 20 | 4 | 2 | 6 |
| 3Q GAIN WILD-TYPE | 4 | 16 | 26 | 39 |
Figure S6. Get High-res Image Gene #5: '3q gain mutation analysis' versus Clinical Feature #3: 'CN_CNMF'
P value = 3.65e-05 (Fisher's exact test), Q value = 0.014
Table S7. Gene #5: '3q gain mutation analysis' versus Clinical Feature #5: 'MRNASEQ_CNMF'
| nPatients | CLUS_1 | CLUS_2 | CLUS_3 |
|---|---|---|---|
| ALL | 27 | 24 | 25 |
| 3Q GAIN MUTATED | 14 | 0 | 8 |
| 3Q GAIN WILD-TYPE | 13 | 24 | 17 |
Figure S7. Get High-res Image Gene #5: '3q gain mutation analysis' versus Clinical Feature #5: 'MRNASEQ_CNMF'
P value = 6.94e-06 (Fisher's exact test), Q value = 0.0027
Table S8. Gene #5: '3q gain mutation analysis' versus Clinical Feature #6: 'MRNASEQ_CHIERARCHICAL'
| nPatients | CLUS_1 | CLUS_2 | CLUS_3 |
|---|---|---|---|
| ALL | 18 | 37 | 21 |
| 3Q GAIN MUTATED | 1 | 20 | 1 |
| 3Q GAIN WILD-TYPE | 17 | 17 | 20 |
Figure S8. Get High-res Image Gene #5: '3q gain mutation analysis' versus Clinical Feature #6: 'MRNASEQ_CHIERARCHICAL'
P value = 0.000246 (Fisher's exact test), Q value = 0.093
Table S9. Gene #5: '3q gain mutation analysis' versus Clinical Feature #8: 'MIRSEQ_CHIERARCHICAL'
| nPatients | CLUS_1 | CLUS_2 | CLUS_3 | CLUS_4 |
|---|---|---|---|---|
| ALL | 27 | 45 | 12 | 33 |
| 3Q GAIN MUTATED | 4 | 6 | 8 | 14 |
| 3Q GAIN WILD-TYPE | 23 | 39 | 4 | 19 |
Figure S9. Get High-res Image Gene #5: '3q gain mutation analysis' versus Clinical Feature #8: 'MIRSEQ_CHIERARCHICAL'
P value = 3.47e-10 (Fisher's exact test), Q value = 1.4e-07
Table S10. Gene #12: '7p gain mutation analysis' versus Clinical Feature #3: 'CN_CNMF'
| nPatients | CLUS_1 | CLUS_2 | CLUS_3 | CLUS_4 |
|---|---|---|---|---|
| ALL | 24 | 20 | 28 | 45 |
| 7P GAIN MUTATED | 20 | 20 | 6 | 18 |
| 7P GAIN WILD-TYPE | 4 | 0 | 22 | 27 |
Figure S10. Get High-res Image Gene #12: '7p gain mutation analysis' versus Clinical Feature #3: 'CN_CNMF'
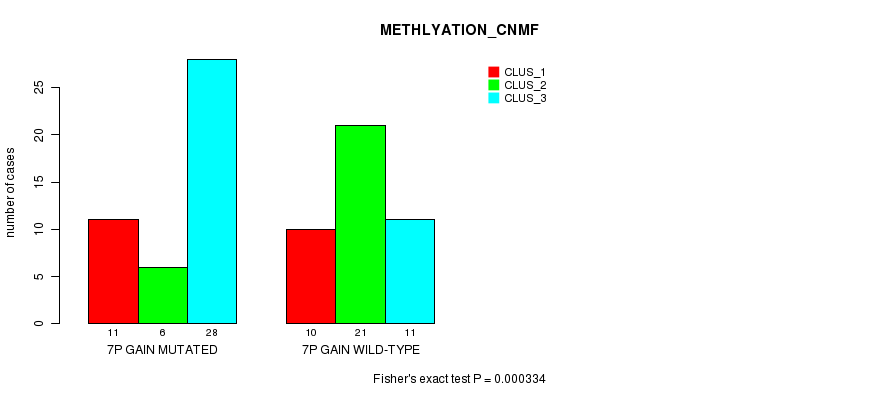
P value = 0.000334 (Fisher's exact test), Q value = 0.13
Table S11. Gene #12: '7p gain mutation analysis' versus Clinical Feature #4: 'METHLYATION_CNMF'
| nPatients | CLUS_1 | CLUS_2 | CLUS_3 |
|---|---|---|---|
| ALL | 21 | 27 | 39 |
| 7P GAIN MUTATED | 11 | 6 | 28 |
| 7P GAIN WILD-TYPE | 10 | 21 | 11 |
Figure S11. Get High-res Image Gene #12: '7p gain mutation analysis' versus Clinical Feature #4: 'METHLYATION_CNMF'
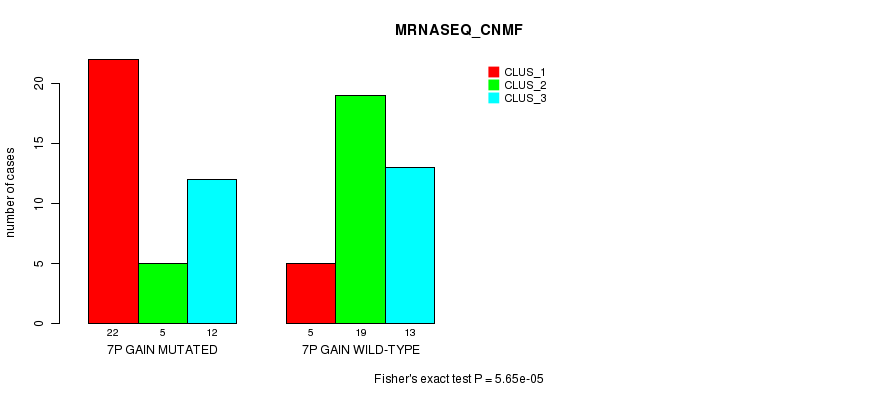
P value = 5.65e-05 (Fisher's exact test), Q value = 0.022
Table S12. Gene #12: '7p gain mutation analysis' versus Clinical Feature #5: 'MRNASEQ_CNMF'
| nPatients | CLUS_1 | CLUS_2 | CLUS_3 |
|---|---|---|---|
| ALL | 27 | 24 | 25 |
| 7P GAIN MUTATED | 22 | 5 | 12 |
| 7P GAIN WILD-TYPE | 5 | 19 | 13 |
Figure S12. Get High-res Image Gene #12: '7p gain mutation analysis' versus Clinical Feature #5: 'MRNASEQ_CNMF'
P value = 2.01e-05 (Fisher's exact test), Q value = 0.0079
Table S13. Gene #12: '7p gain mutation analysis' versus Clinical Feature #6: 'MRNASEQ_CHIERARCHICAL'
| nPatients | CLUS_1 | CLUS_2 | CLUS_3 |
|---|---|---|---|
| ALL | 18 | 37 | 21 |
| 7P GAIN MUTATED | 5 | 29 | 5 |
| 7P GAIN WILD-TYPE | 13 | 8 | 16 |
Figure S13. Get High-res Image Gene #12: '7p gain mutation analysis' versus Clinical Feature #6: 'MRNASEQ_CHIERARCHICAL'
P value = 7.18e-11 (Fisher's exact test), Q value = 2.9e-08
Table S14. Gene #13: '7q gain mutation analysis' versus Clinical Feature #3: 'CN_CNMF'
| nPatients | CLUS_1 | CLUS_2 | CLUS_3 | CLUS_4 |
|---|---|---|---|---|
| ALL | 24 | 20 | 28 | 45 |
| 7Q GAIN MUTATED | 21 | 20 | 6 | 18 |
| 7Q GAIN WILD-TYPE | 3 | 0 | 22 | 27 |
Figure S14. Get High-res Image Gene #13: '7q gain mutation analysis' versus Clinical Feature #3: 'CN_CNMF'
P value = 0.000181 (Fisher's exact test), Q value = 0.069
Table S15. Gene #13: '7q gain mutation analysis' versus Clinical Feature #5: 'MRNASEQ_CNMF'
| nPatients | CLUS_1 | CLUS_2 | CLUS_3 |
|---|---|---|---|
| ALL | 27 | 24 | 25 |
| 7Q GAIN MUTATED | 22 | 6 | 12 |
| 7Q GAIN WILD-TYPE | 5 | 18 | 13 |
Figure S15. Get High-res Image Gene #13: '7q gain mutation analysis' versus Clinical Feature #5: 'MRNASEQ_CNMF'
P value = 3.74e-05 (Fisher's exact test), Q value = 0.014
Table S16. Gene #13: '7q gain mutation analysis' versus Clinical Feature #6: 'MRNASEQ_CHIERARCHICAL'
| nPatients | CLUS_1 | CLUS_2 | CLUS_3 |
|---|---|---|---|
| ALL | 18 | 37 | 21 |
| 7Q GAIN MUTATED | 6 | 29 | 5 |
| 7Q GAIN WILD-TYPE | 12 | 8 | 16 |
Figure S16. Get High-res Image Gene #13: '7q gain mutation analysis' versus Clinical Feature #6: 'MRNASEQ_CHIERARCHICAL'
P value = 0.000205 (Fisher's exact test), Q value = 0.078
Table S17. Gene #21: '16p gain mutation analysis' versus Clinical Feature #3: 'CN_CNMF'
| nPatients | CLUS_1 | CLUS_2 | CLUS_3 | CLUS_4 |
|---|---|---|---|---|
| ALL | 24 | 20 | 28 | 45 |
| 16P GAIN MUTATED | 20 | 8 | 7 | 19 |
| 16P GAIN WILD-TYPE | 4 | 12 | 21 | 26 |
Figure S17. Get High-res Image Gene #21: '16p gain mutation analysis' versus Clinical Feature #3: 'CN_CNMF'
P value = 0.000182 (Fisher's exact test), Q value = 0.069
Table S18. Gene #21: '16p gain mutation analysis' versus Clinical Feature #6: 'MRNASEQ_CHIERARCHICAL'
| nPatients | CLUS_1 | CLUS_2 | CLUS_3 |
|---|---|---|---|
| ALL | 18 | 37 | 21 |
| 16P GAIN MUTATED | 2 | 24 | 6 |
| 16P GAIN WILD-TYPE | 16 | 13 | 15 |
Figure S18. Get High-res Image Gene #21: '16p gain mutation analysis' versus Clinical Feature #6: 'MRNASEQ_CHIERARCHICAL'
P value = 2.25e-05 (Fisher's exact test), Q value = 0.0088
Table S19. Gene #22: '16q gain mutation analysis' versus Clinical Feature #3: 'CN_CNMF'
| nPatients | CLUS_1 | CLUS_2 | CLUS_3 | CLUS_4 |
|---|---|---|---|---|
| ALL | 24 | 20 | 28 | 45 |
| 16Q GAIN MUTATED | 20 | 8 | 5 | 18 |
| 16Q GAIN WILD-TYPE | 4 | 12 | 23 | 27 |
Figure S19. Get High-res Image Gene #22: '16q gain mutation analysis' versus Clinical Feature #3: 'CN_CNMF'
P value = 1.46e-05 (Fisher's exact test), Q value = 0.0057
Table S20. Gene #22: '16q gain mutation analysis' versus Clinical Feature #6: 'MRNASEQ_CHIERARCHICAL'
| nPatients | CLUS_1 | CLUS_2 | CLUS_3 |
|---|---|---|---|
| ALL | 18 | 37 | 21 |
| 16Q GAIN MUTATED | 2 | 24 | 3 |
| 16Q GAIN WILD-TYPE | 16 | 13 | 18 |
Figure S20. Get High-res Image Gene #22: '16q gain mutation analysis' versus Clinical Feature #6: 'MRNASEQ_CHIERARCHICAL'
P value = 0.000223 (Fisher's exact test), Q value = 0.085
Table S21. Gene #22: '16q gain mutation analysis' versus Clinical Feature #8: 'MIRSEQ_CHIERARCHICAL'
| nPatients | CLUS_1 | CLUS_2 | CLUS_3 | CLUS_4 |
|---|---|---|---|---|
| ALL | 27 | 45 | 12 | 33 |
| 16Q GAIN MUTATED | 8 | 12 | 8 | 23 |
| 16Q GAIN WILD-TYPE | 19 | 33 | 4 | 10 |
Figure S21. Get High-res Image Gene #22: '16q gain mutation analysis' versus Clinical Feature #8: 'MIRSEQ_CHIERARCHICAL'
P value = 1.02e-14 (Fisher's exact test), Q value = 4.1e-12
Table S22. Gene #23: '17p gain mutation analysis' versus Clinical Feature #3: 'CN_CNMF'
| nPatients | CLUS_1 | CLUS_2 | CLUS_3 | CLUS_4 |
|---|---|---|---|---|
| ALL | 24 | 20 | 28 | 45 |
| 17P GAIN MUTATED | 22 | 20 | 3 | 16 |
| 17P GAIN WILD-TYPE | 2 | 0 | 25 | 29 |
Figure S22. Get High-res Image Gene #23: '17p gain mutation analysis' versus Clinical Feature #3: 'CN_CNMF'
P value = 5.33e-05 (Fisher's exact test), Q value = 0.021
Table S23. Gene #23: '17p gain mutation analysis' versus Clinical Feature #4: 'METHLYATION_CNMF'
| nPatients | CLUS_1 | CLUS_2 | CLUS_3 |
|---|---|---|---|
| ALL | 21 | 27 | 39 |
| 17P GAIN MUTATED | 8 | 5 | 28 |
| 17P GAIN WILD-TYPE | 13 | 22 | 11 |
Figure S23. Get High-res Image Gene #23: '17p gain mutation analysis' versus Clinical Feature #4: 'METHLYATION_CNMF'
P value = 3.49e-05 (Fisher's exact test), Q value = 0.014
Table S24. Gene #23: '17p gain mutation analysis' versus Clinical Feature #5: 'MRNASEQ_CNMF'
| nPatients | CLUS_1 | CLUS_2 | CLUS_3 |
|---|---|---|---|
| ALL | 27 | 24 | 25 |
| 17P GAIN MUTATED | 20 | 3 | 10 |
| 17P GAIN WILD-TYPE | 7 | 21 | 15 |
Figure S24. Get High-res Image Gene #23: '17p gain mutation analysis' versus Clinical Feature #5: 'MRNASEQ_CNMF'
P value = 2.21e-06 (Fisher's exact test), Q value = 0.00087
Table S25. Gene #23: '17p gain mutation analysis' versus Clinical Feature #6: 'MRNASEQ_CHIERARCHICAL'
| nPatients | CLUS_1 | CLUS_2 | CLUS_3 |
|---|---|---|---|
| ALL | 18 | 37 | 21 |
| 17P GAIN MUTATED | 3 | 27 | 3 |
| 17P GAIN WILD-TYPE | 15 | 10 | 18 |
Figure S25. Get High-res Image Gene #23: '17p gain mutation analysis' versus Clinical Feature #6: 'MRNASEQ_CHIERARCHICAL'
P value = 1.32e-09 (Fisher's exact test), Q value = 5.2e-07
Table S26. Gene #24: '17q gain mutation analysis' versus Clinical Feature #3: 'CN_CNMF'
| nPatients | CLUS_1 | CLUS_2 | CLUS_3 | CLUS_4 |
|---|---|---|---|---|
| ALL | 24 | 20 | 28 | 45 |
| 17Q GAIN MUTATED | 22 | 20 | 8 | 21 |
| 17Q GAIN WILD-TYPE | 2 | 0 | 20 | 24 |
Figure S26. Get High-res Image Gene #24: '17q gain mutation analysis' versus Clinical Feature #3: 'CN_CNMF'
P value = 0.000295 (Fisher's exact test), Q value = 0.11
Table S27. Gene #44: '10p loss mutation analysis' versus Clinical Feature #3: 'CN_CNMF'
| nPatients | CLUS_1 | CLUS_2 | CLUS_3 | CLUS_4 |
|---|---|---|---|---|
| ALL | 24 | 20 | 28 | 45 |
| 10P LOSS MUTATED | 0 | 0 | 6 | 0 |
| 10P LOSS WILD-TYPE | 24 | 20 | 22 | 45 |
Figure S27. Get High-res Image Gene #44: '10p loss mutation analysis' versus Clinical Feature #3: 'CN_CNMF'
P value = 2.83e-11 (Fisher's exact test), Q value = 1.1e-08
Table S28. Gene #49: '14q loss mutation analysis' versus Clinical Feature #3: 'CN_CNMF'
| nPatients | CLUS_1 | CLUS_2 | CLUS_3 | CLUS_4 |
|---|---|---|---|---|
| ALL | 24 | 20 | 28 | 45 |
| 14Q LOSS MUTATED | 3 | 0 | 17 | 0 |
| 14Q LOSS WILD-TYPE | 21 | 20 | 11 | 45 |
Figure S28. Get High-res Image Gene #49: '14q loss mutation analysis' versus Clinical Feature #3: 'CN_CNMF'
-
Mutation data file = broad_values_by_arm.mutsig.cluster.txt
-
Molecular subtypes file = KIRP-TP.transferedmergedcluster.txt
-
Number of patients = 117
-
Number of significantly arm-level cnvs = 59
-
Number of molecular subtypes = 8
-
Exclude genes that fewer than K tumors have mutations, K = 3
For binary or multi-class clinical features (nominal or ordinal), two-tailed Fisher's exact tests (Fisher 1922) were used to estimate the P values using the 'fisher.test' function in R
For multiple hypothesis correction, Q value is the False Discovery Rate (FDR) analogue of the P value (Benjamini and Hochberg 1995), defined as the minimum FDR at which the test may be called significant. We used the 'Benjamini and Hochberg' method of 'p.adjust' function in R to convert P values into Q values.
This is an experimental feature. The full results of the analysis summarized in this report can be downloaded from the TCGA Data Coordination Center.