This pipeline uses various statistical tests to identify genes whose promoter methylation levels correlated to selected clinical features.
Testing the association between 17401 genes and 6 clinical features across 169 samples, statistically thresholded by Q value < 0.05, 4 clinical features related to at least one genes.
-
615 genes correlated to 'Time to Death'.
-
HS3ST4 , SDCBP , IRF2 , CD274 , GSTCD , ...
-
111 genes correlated to 'AGE'.
-
HOXD8 , RAB6C , SLC18A2 , RAB11FIP1 , LOC150786 , ...
-
11 genes correlated to 'GENDER'.
-
UTP14C , FDPS , ATAD5 , WBP11P1 , TFDP1 , ...
-
667 genes correlated to 'HISTOLOGICAL.TYPE'.
-
BVES , TGFBRAP1 , REST , PRR5 , SNAPC2 , ...
-
No genes correlated to 'KARNOFSKY.PERFORMANCE.SCORE', and 'RADIATIONS.RADIATION.REGIMENINDICATION'.
Complete statistical result table is provided in Supplement Table 1
Table 1. Get Full Table This table shows the clinical features, statistical methods used, and the number of genes that are significantly associated with each clinical feature at Q value < 0.05.
| Clinical feature | Statistical test | Significant genes | Associated with | Associated with | ||
|---|---|---|---|---|---|---|
| Time to Death | Cox regression test | N=615 | shorter survival | N=83 | longer survival | N=532 |
| AGE | Spearman correlation test | N=111 | older | N=98 | younger | N=13 |
| GENDER | t test | N=11 | male | N=6 | female | N=5 |
| KARNOFSKY PERFORMANCE SCORE | Spearman correlation test | N=0 | ||||
| HISTOLOGICAL TYPE | ANOVA test | N=667 | ||||
| RADIATIONS RADIATION REGIMENINDICATION | t test | N=0 |
Table S1. Basic characteristics of clinical feature: 'Time to Death'
| Time to Death | Duration (Months) | 0-211.2 (median=14.6) |
| censored | N = 124 | |
| death | N = 44 | |
| Significant markers | N = 615 | |
| associated with shorter survival | 83 | |
| associated with longer survival | 532 |
Table S2. Get Full Table List of top 10 genes significantly associated with 'Time to Death' by Cox regression test
| HazardRatio | Wald_P | Q | C_index | |
|---|---|---|---|---|
| HS3ST4 | 171 | 7.867e-12 | 1.4e-07 | 0.763 |
| SDCBP | 0 | 1.125e-11 | 2e-07 | 0.26 |
| IRF2 | 0 | 1.414e-11 | 2.5e-07 | 0.31 |
| CD274 | 0.01 | 1.758e-11 | 3.1e-07 | 0.271 |
| GSTCD | 0.01 | 2.322e-11 | 4e-07 | 0.276 |
| SSTR1 | 151 | 3.369e-11 | 5.9e-07 | 0.781 |
| ZNF492 | 82 | 3.53e-11 | 6.1e-07 | 0.688 |
| NEIL3 | 0 | 3.659e-11 | 6.4e-07 | 0.214 |
| HPD | 0 | 3.88e-11 | 6.7e-07 | 0.287 |
| KHDRBS2 | 261 | 5.865e-11 | 1e-06 | 0.741 |
Figure S1. Get High-res Image As an example, this figure shows the association of HS3ST4 to 'Time to Death'. four curves present the cumulative survival rates of 4 quartile subsets of patients. P value = 7.87e-12 with univariate Cox regression analysis using continuous log-2 expression values.

Table S3. Basic characteristics of clinical feature: 'AGE'
| AGE | Mean (SD) | 43.04 (13) |
| Significant markers | N = 111 | |
| pos. correlated | 98 | |
| neg. correlated | 13 |
Table S4. Get Full Table List of top 10 genes significantly correlated to 'AGE' by Spearman correlation test
| SpearmanCorr | corrP | Q | |
|---|---|---|---|
| HOXD8 | 0.5556 | 4.512e-15 | 7.85e-11 |
| RAB6C | 0.536 | 5.906e-14 | 1.03e-09 |
| SLC18A2 | 0.532 | 9.799e-14 | 1.7e-09 |
| RAB11FIP1 | 0.5296 | 1.326e-13 | 2.31e-09 |
| LOC150786 | 0.5284 | 1.537e-13 | 2.67e-09 |
| ADAMTSL3 | 0.5124 | 1.072e-12 | 1.87e-08 |
| PAX9 | 0.4994 | 4.807e-12 | 8.36e-08 |
| GALNT14 | 0.4974 | 5.999e-12 | 1.04e-07 |
| TRIM58 | 0.4926 | 1.029e-11 | 1.79e-07 |
| SLCO4C1 | 0.485 | 2.359e-11 | 4.1e-07 |
Figure S2. Get High-res Image As an example, this figure shows the association of HOXD8 to 'AGE'. P value = 4.51e-15 with Spearman correlation analysis. The straight line presents the best linear regression.

Table S5. Basic characteristics of clinical feature: 'GENDER'
| GENDER | Labels | N |
| FEMALE | 74 | |
| MALE | 95 | |
| Significant markers | N = 11 | |
| Higher in MALE | 6 | |
| Higher in FEMALE | 5 |
Table S6. Get Full Table List of top 10 genes differentially expressed by 'GENDER'
| T(pos if higher in 'MALE') | ttestP | Q | AUC | |
|---|---|---|---|---|
| UTP14C | 18.39 | 3.81e-33 | 6.63e-29 | 0.9731 |
| FDPS | 10.1 | 2.252e-18 | 3.92e-14 | 0.8795 |
| ATAD5 | 8.37 | 2.44e-14 | 4.25e-10 | 0.845 |
| WBP11P1 | 7.63 | 3.119e-12 | 5.43e-08 | 0.8319 |
| TFDP1 | -6.71 | 3.384e-10 | 5.89e-06 | 0.8667 |
| GLUD1 | -6.57 | 1.525e-09 | 2.65e-05 | 0.7735 |
| KIF4B | -6.01 | 2.065e-08 | 0.000359 | 0.7378 |
| ZNF839 | -5.09 | 1.125e-06 | 0.0196 | 0.7556 |
| AES | 5.04 | 1.222e-06 | 0.0213 | 0.7174 |
| CCDC121 | 5.05 | 1.43e-06 | 0.0249 | 0.7222 |
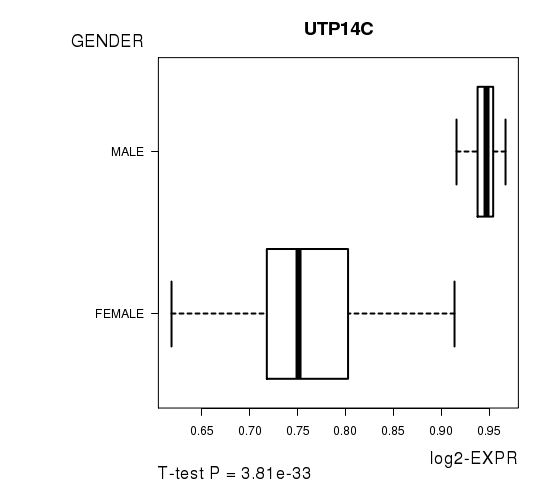
Figure S3. Get High-res Image As an example, this figure shows the association of UTP14C to 'GENDER'. P value = 3.81e-33 with T-test analysis.
No gene related to 'KARNOFSKY.PERFORMANCE.SCORE'.
Table S7. Basic characteristics of clinical feature: 'KARNOFSKY.PERFORMANCE.SCORE'
| KARNOFSKY.PERFORMANCE.SCORE | Mean (SD) | 88.37 (11) |
| Significant markers | N = 0 |
Table S8. Basic characteristics of clinical feature: 'HISTOLOGICAL.TYPE'
| HISTOLOGICAL.TYPE | Labels | N |
| ASTROCYTOMA | 50 | |
| OLIGOASTROCYTOMA | 45 | |
| OLIGODENDROGLIOMA | 73 | |
| Significant markers | N = 667 |
Table S9. Get Full Table List of top 10 genes differentially expressed by 'HISTOLOGICAL.TYPE'
| ANOVA_P | Q | |
|---|---|---|
| BVES | 5.056e-15 | 8.8e-11 |
| TGFBRAP1 | 4.758e-14 | 8.28e-10 |
| REST | 3.17e-13 | 5.52e-09 |
| PRR5 | 7.362e-13 | 1.28e-08 |
| SNAPC2 | 1.089e-12 | 1.89e-08 |
| SLC2A4RG | 1.67e-12 | 2.9e-08 |
| MAPKAP1 | 1.888e-12 | 3.28e-08 |
| TMEM51 | 1.306e-11 | 2.27e-07 |
| SERTAD3 | 1.505e-11 | 2.62e-07 |
| NCKAP5 | 1.734e-11 | 3.02e-07 |
Figure S4. Get High-res Image As an example, this figure shows the association of BVES to 'HISTOLOGICAL.TYPE'. P value = 5.06e-15 with ANOVA analysis.

No gene related to 'RADIATIONS.RADIATION.REGIMENINDICATION'.
Table S10. Basic characteristics of clinical feature: 'RADIATIONS.RADIATION.REGIMENINDICATION'
| RADIATIONS.RADIATION.REGIMENINDICATION | Labels | N |
| NO | 90 | |
| YES | 79 | |
| Significant markers | N = 0 |
-
Expresson data file = LGG-TP.meth.for_correlation.filtered_data.txt
-
Clinical data file = LGG-TP.clin.merged.picked.txt
-
Number of patients = 169
-
Number of genes = 17401
-
Number of clinical features = 6
For survival clinical features, Wald's test in univariate Cox regression analysis with proportional hazards model (Andersen and Gill 1982) was used to estimate the P values using the 'coxph' function in R. Kaplan-Meier survival curves were plot using the four quartile subgroups of patients based on expression levels
For continuous numerical clinical features, Spearman's rank correlation coefficients (Spearman 1904) and two-tailed P values were estimated using 'cor.test' function in R
For two-class clinical features, two-tailed Student's t test with unequal variance (Lehmann and Romano 2005) was applied to compare the log2-expression levels between the two clinical classes using 't.test' function in R
For multi-class clinical features (ordinal or nominal), one-way analysis of variance (Howell 2002) was applied to compare the log2-expression levels between different clinical classes using 'anova' function in R
For multiple hypothesis correction, Q value is the False Discovery Rate (FDR) analogue of the P value (Benjamini and Hochberg 1995), defined as the minimum FDR at which the test may be called significant. We used the 'Benjamini and Hochberg' method of 'p.adjust' function in R to convert P values into Q values.
This is an experimental feature. The full results of the analysis summarized in this report can be downloaded from the TCGA Data Coordination Center.