This pipeline computes the correlation between significant copy number variation (cnv) genes and molecular subtypes.
Testing the association between copy number variation of 43 peak regions and 8 molecular subtypes across 220 patients, 62 significant findings detected with Q value < 0.25.
-
Amp Peak 1(1q32.1) cnvs correlated to 'CN_CNMF', 'METHLYATION_CNMF', and 'MRNASEQ_CNMF'.
-
Amp Peak 3(7p11.2) cnvs correlated to 'CN_CNMF', 'METHLYATION_CNMF', and 'MRNASEQ_CNMF'.
-
Amp Peak 4(7q32.3) cnvs correlated to 'CN_CNMF', 'METHLYATION_CNMF', and 'MRNASEQ_CNMF'.
-
Amp Peak 5(8q24.21) cnvs correlated to 'CN_CNMF' and 'METHLYATION_CNMF'.
-
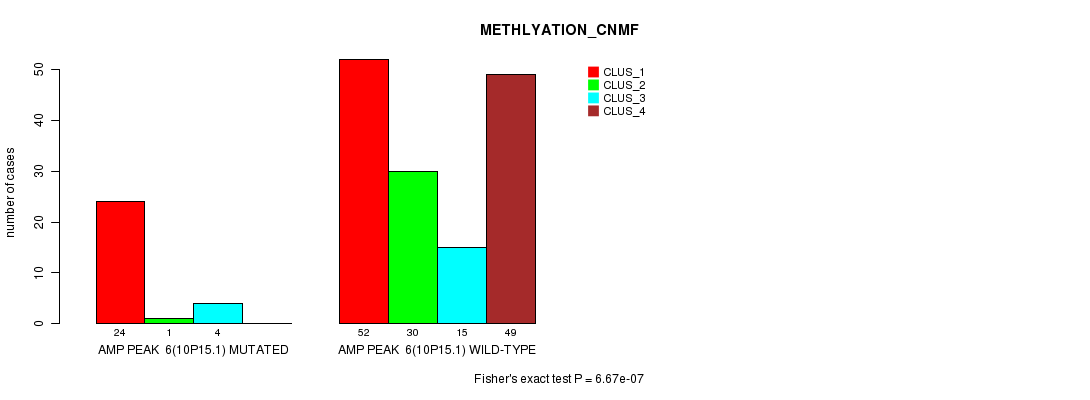
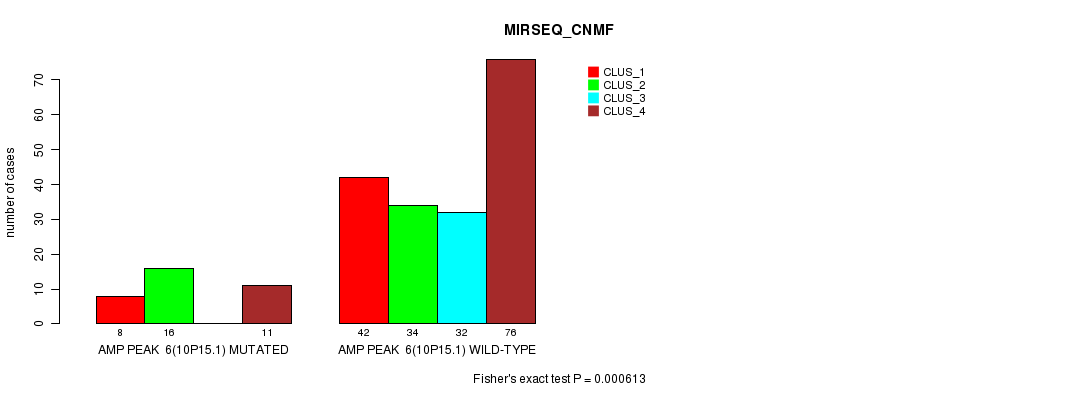
Amp Peak 6(10p15.1) cnvs correlated to 'CN_CNMF', 'METHLYATION_CNMF', and 'MIRSEQ_CNMF'.
-
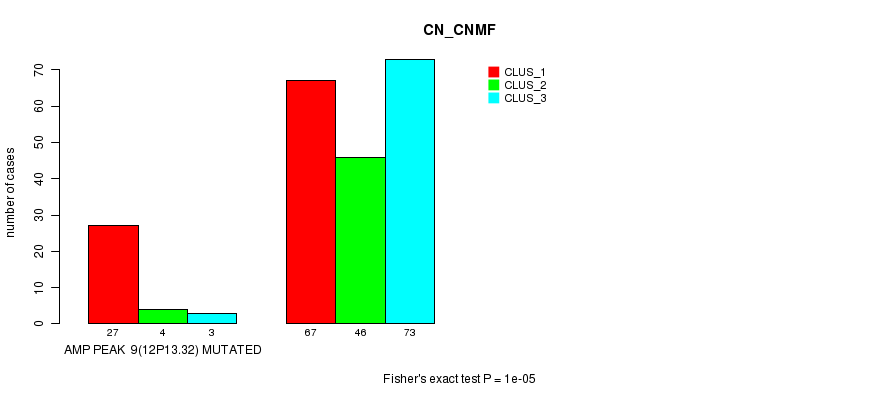
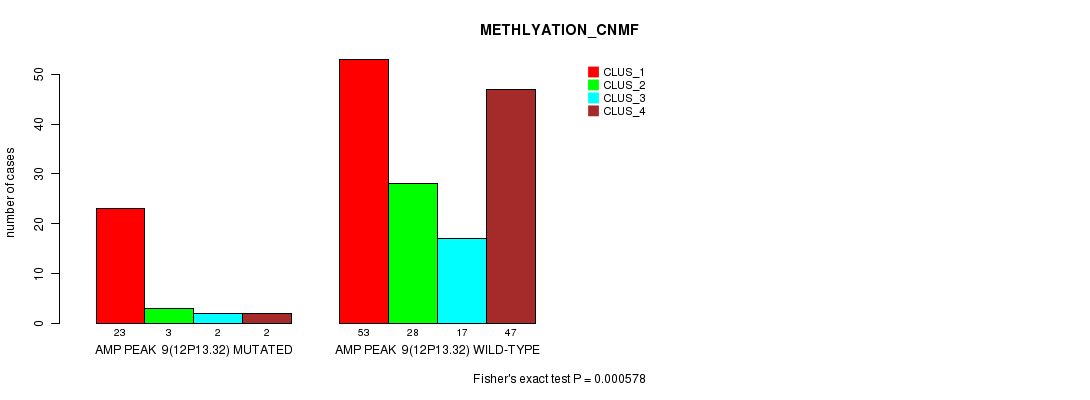
Amp Peak 9(12p13.32) cnvs correlated to 'CN_CNMF' and 'METHLYATION_CNMF'.
-
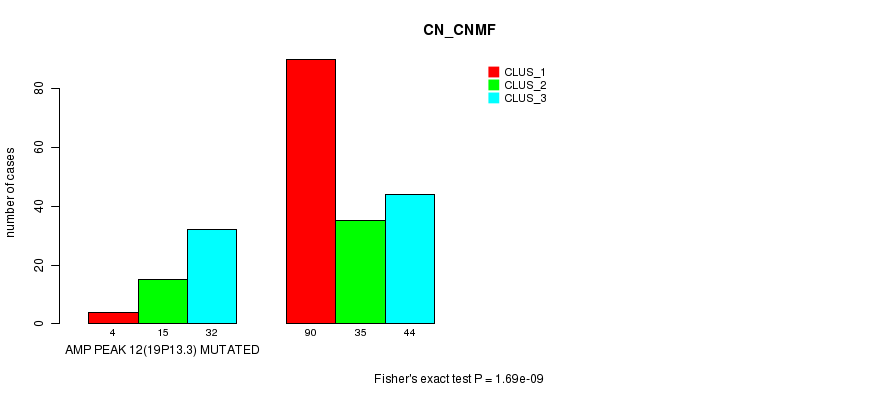
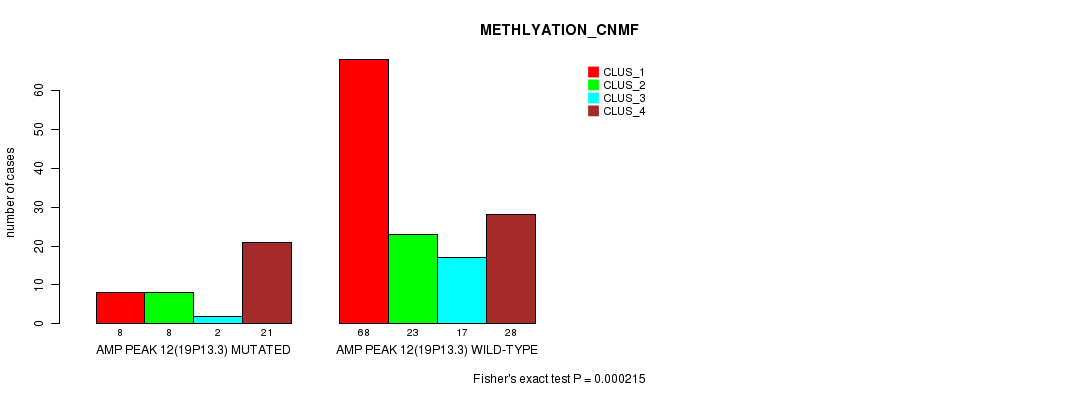
Amp Peak 12(19p13.3) cnvs correlated to 'CN_CNMF' and 'METHLYATION_CNMF'.
-
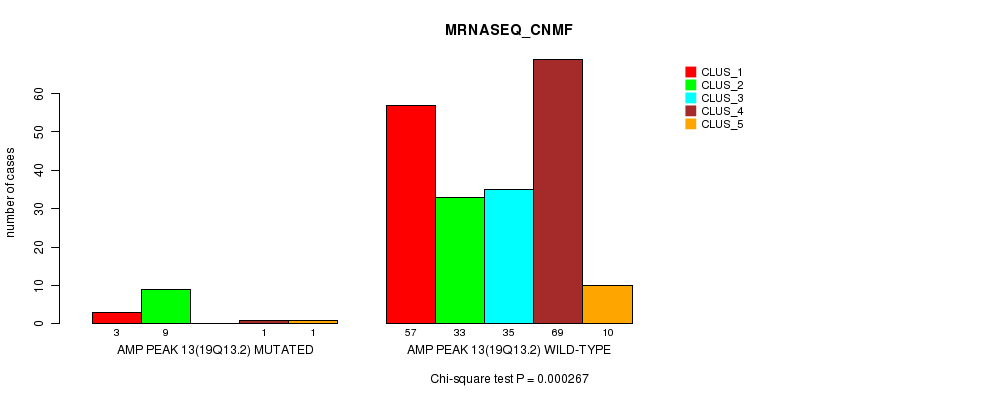
Amp Peak 13(19q13.2) cnvs correlated to 'CN_CNMF' and 'MRNASEQ_CNMF'.
-
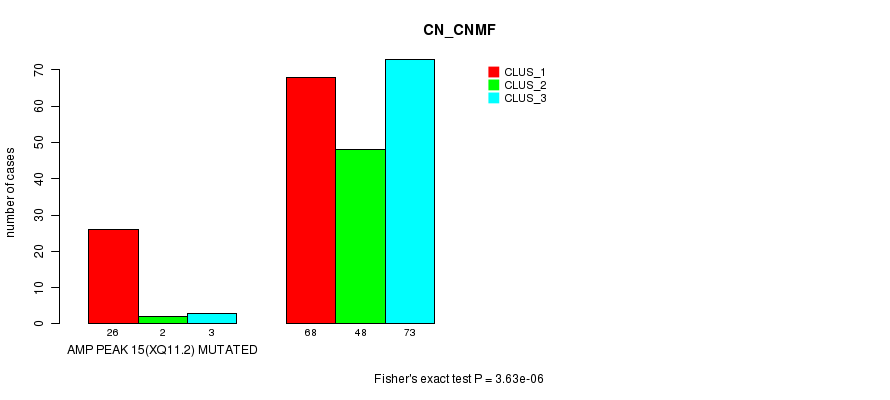
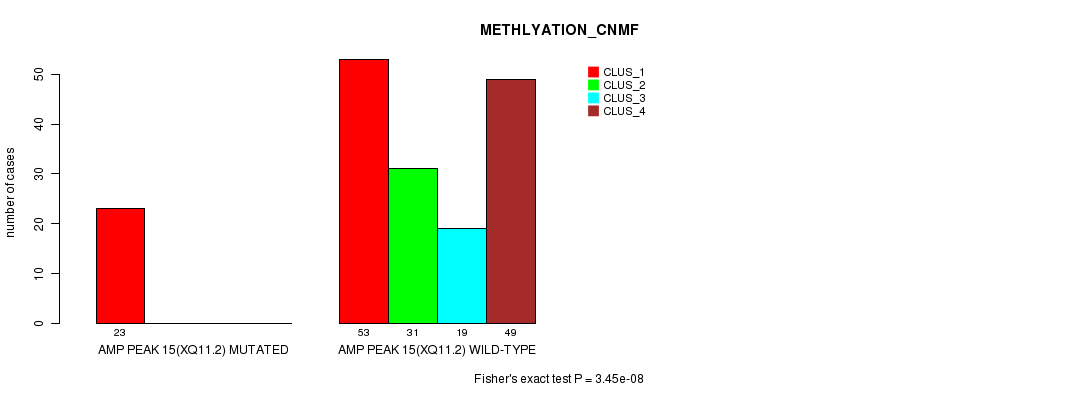
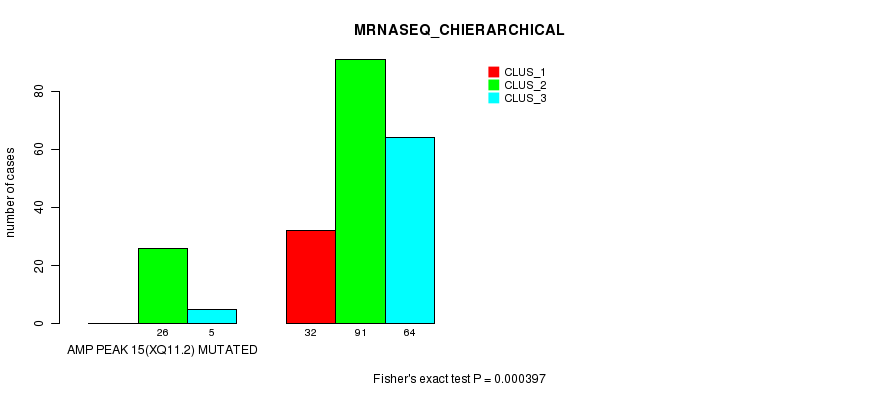
Amp Peak 15(Xq11.2) cnvs correlated to 'CN_CNMF', 'METHLYATION_CNMF', and 'MRNASEQ_CHIERARCHICAL'.
-
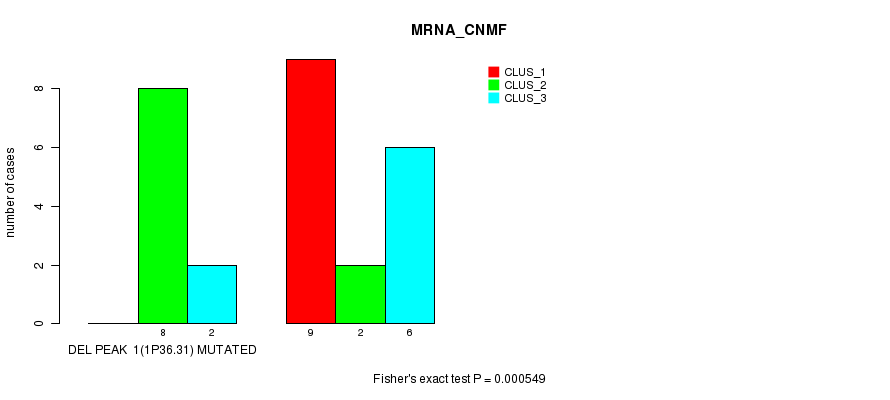
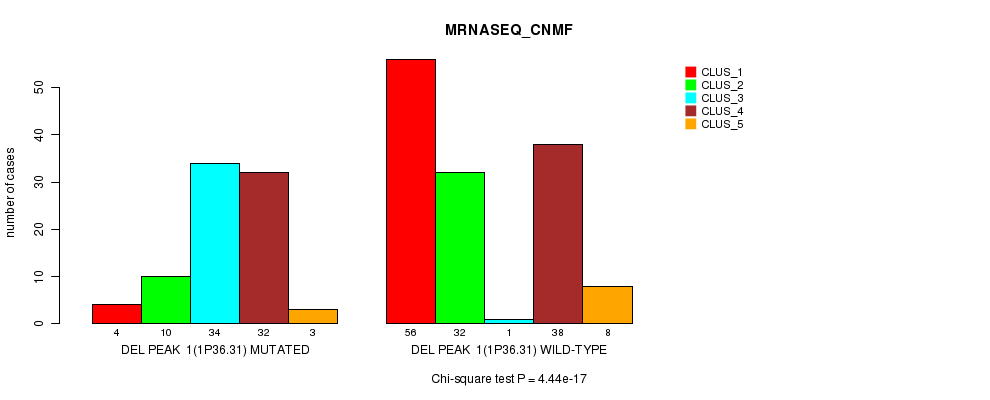
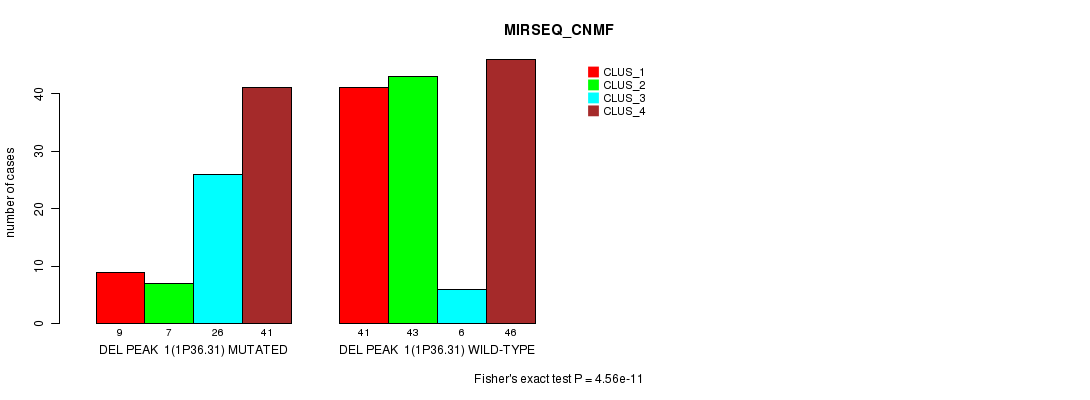
Del Peak 1(1p36.31) cnvs correlated to 'MRNA_CNMF', 'CN_CNMF', 'METHLYATION_CNMF', 'MRNASEQ_CNMF', 'MRNASEQ_CHIERARCHICAL', and 'MIRSEQ_CNMF'.
-
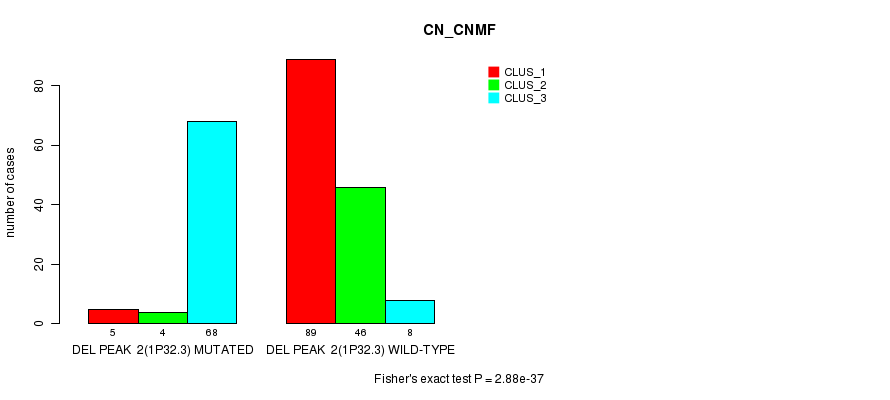
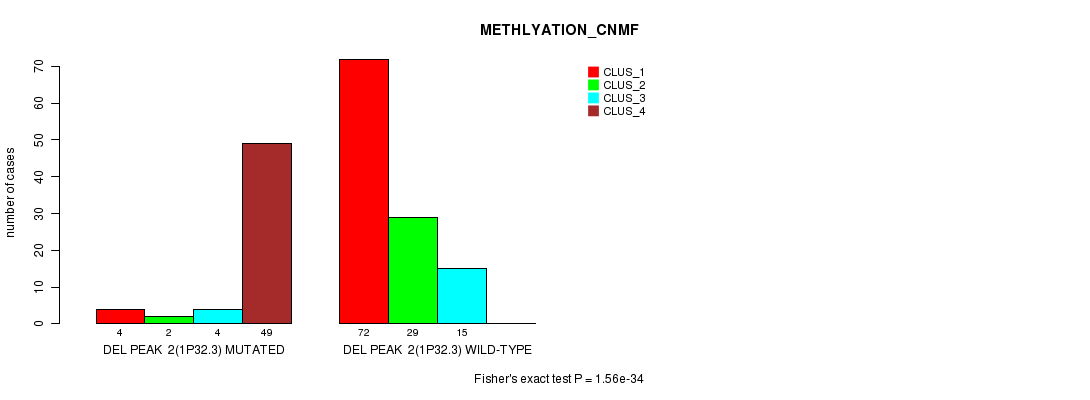
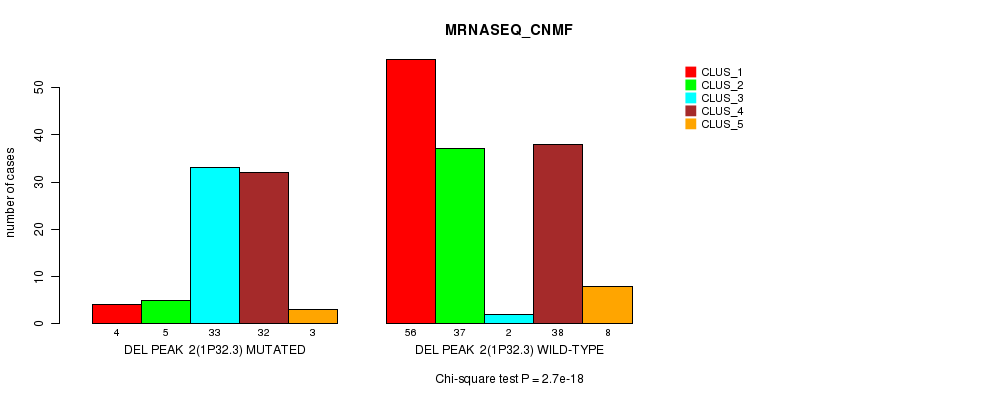
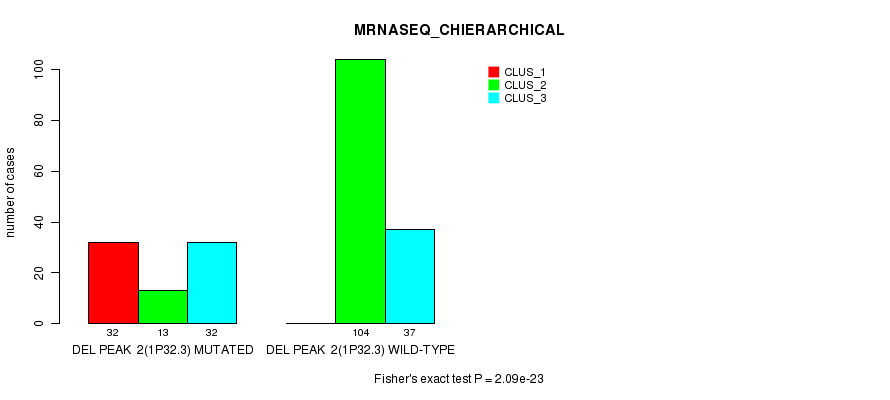
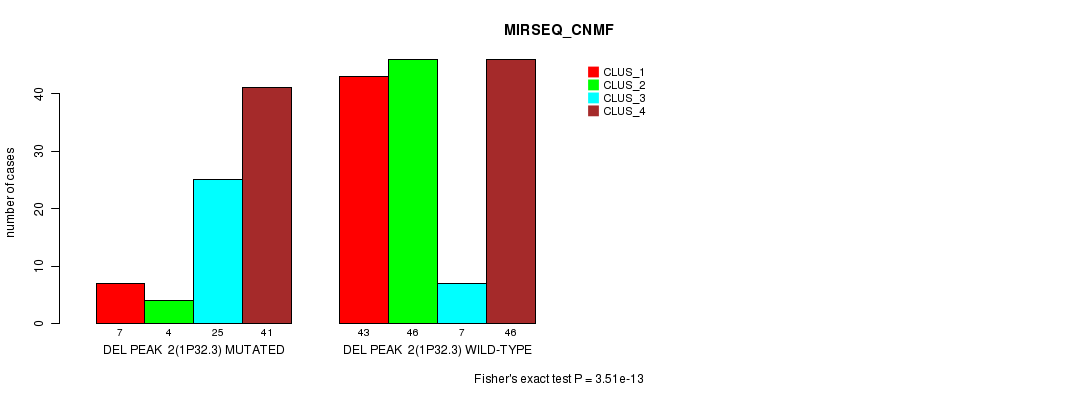
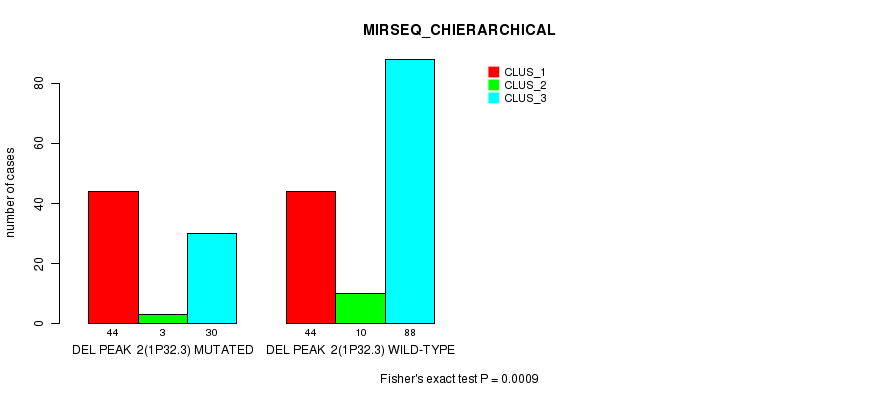
Del Peak 2(1p32.3) cnvs correlated to 'CN_CNMF', 'METHLYATION_CNMF', 'MRNASEQ_CNMF', 'MRNASEQ_CHIERARCHICAL', 'MIRSEQ_CNMF', and 'MIRSEQ_CHIERARCHICAL'.
-
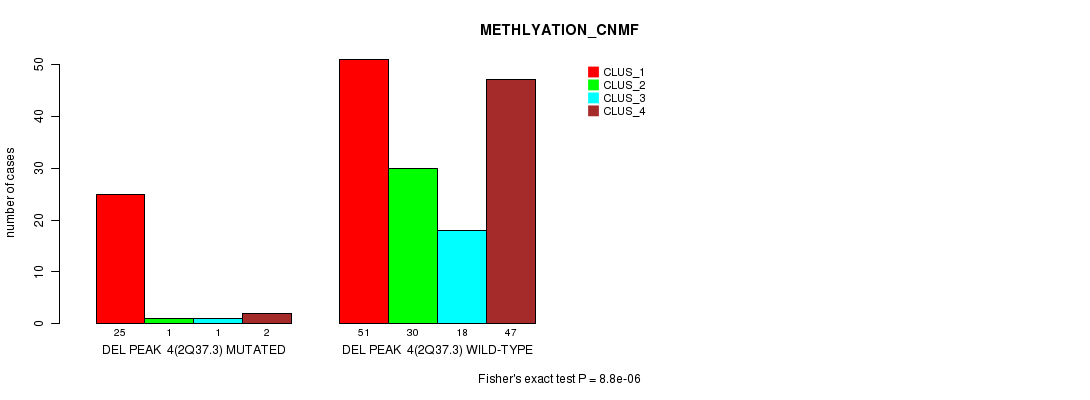
Del Peak 4(2q37.3) cnvs correlated to 'METHLYATION_CNMF'.
-
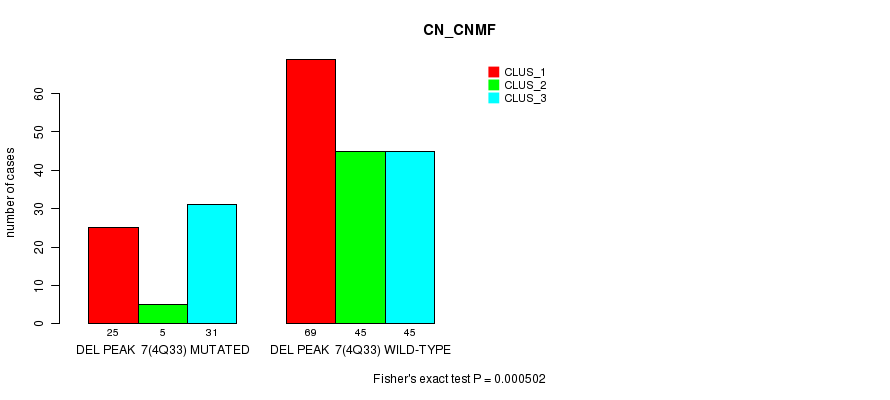
Del Peak 7(4q33) cnvs correlated to 'CN_CNMF'.
-
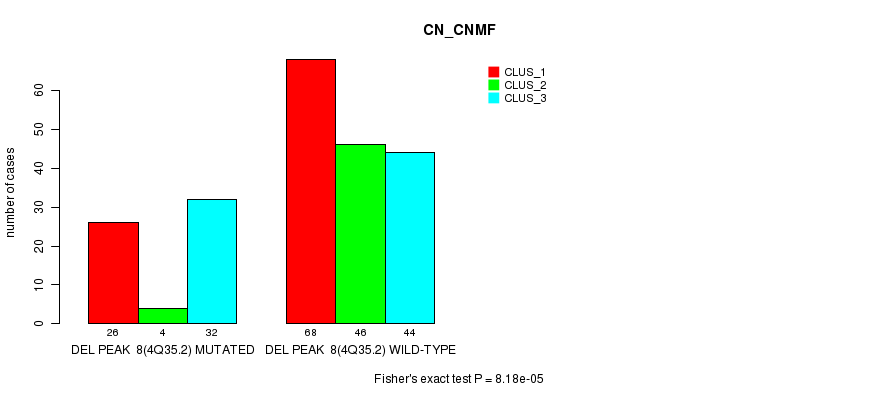
Del Peak 8(4q35.2) cnvs correlated to 'CN_CNMF' and 'METHLYATION_CNMF'.
-
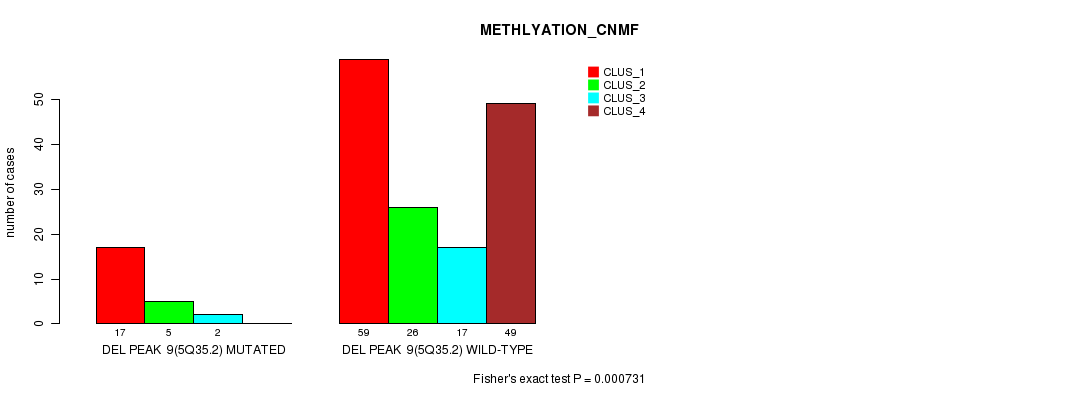
Del Peak 9(5q35.2) cnvs correlated to 'METHLYATION_CNMF'.
-
Del Peak 13(9p21.3) cnvs correlated to 'CN_CNMF' and 'METHLYATION_CNMF'.
-
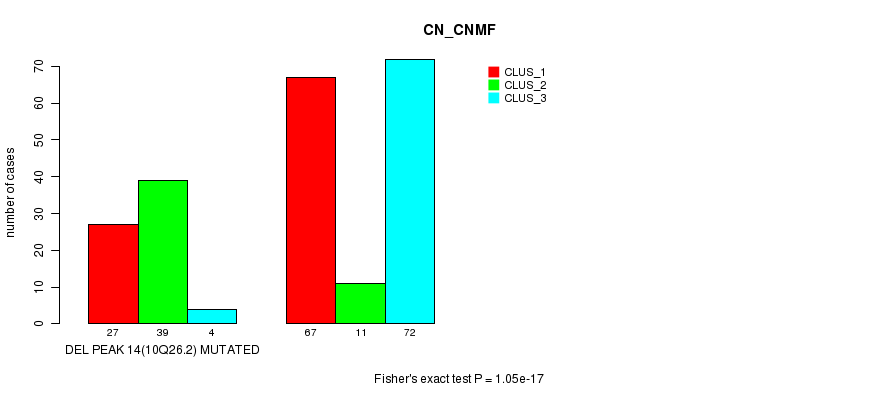
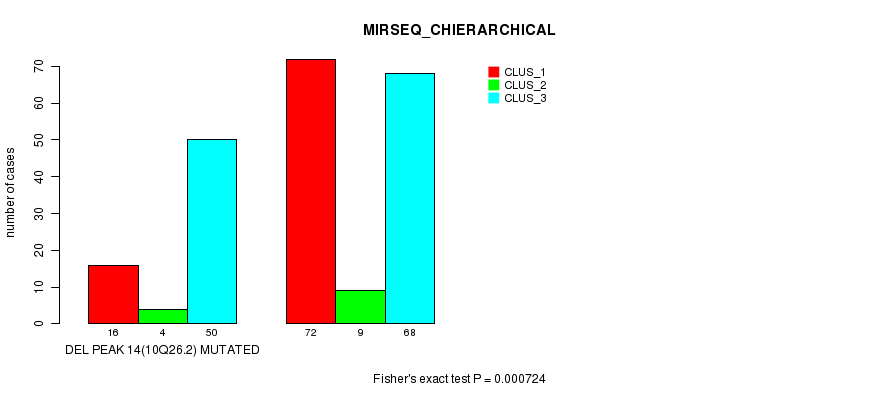
Del Peak 14(10q26.2) cnvs correlated to 'CN_CNMF', 'METHLYATION_CNMF', 'MRNASEQ_CNMF', 'MRNASEQ_CHIERARCHICAL', 'MIRSEQ_CNMF', and 'MIRSEQ_CHIERARCHICAL'.
-
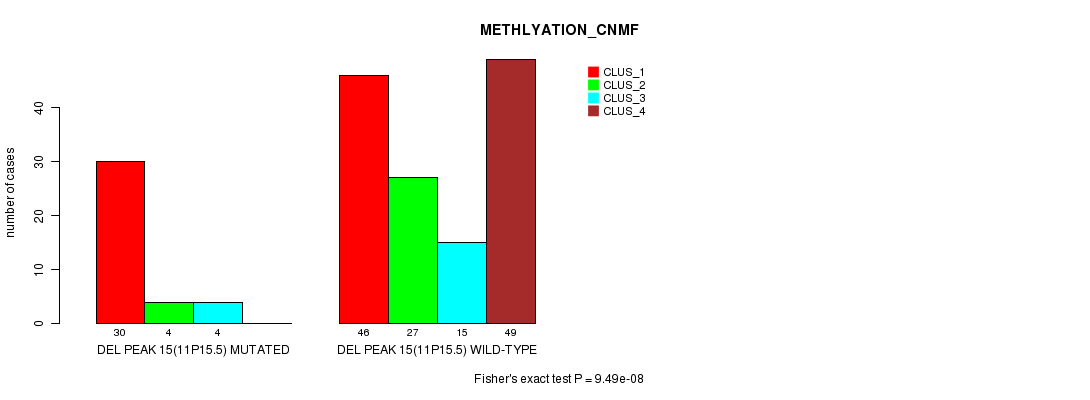
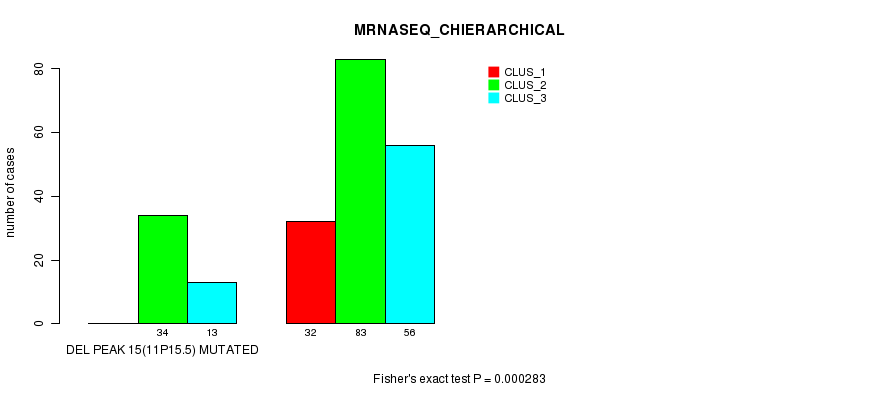
Del Peak 15(11p15.5) cnvs correlated to 'CN_CNMF', 'METHLYATION_CNMF', and 'MRNASEQ_CHIERARCHICAL'.
-
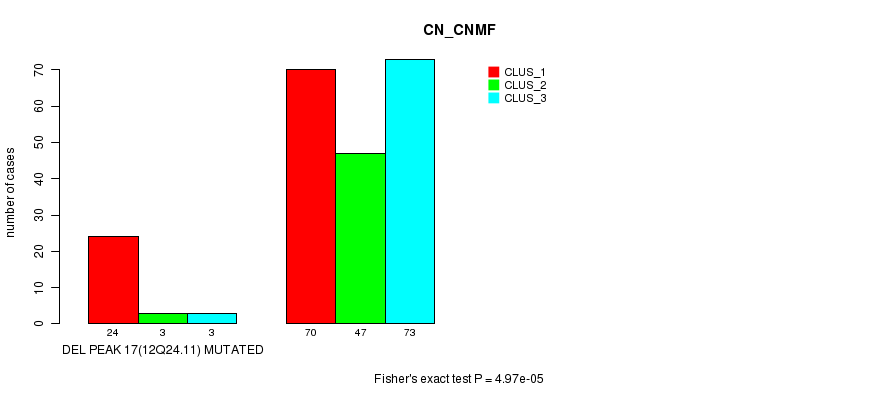
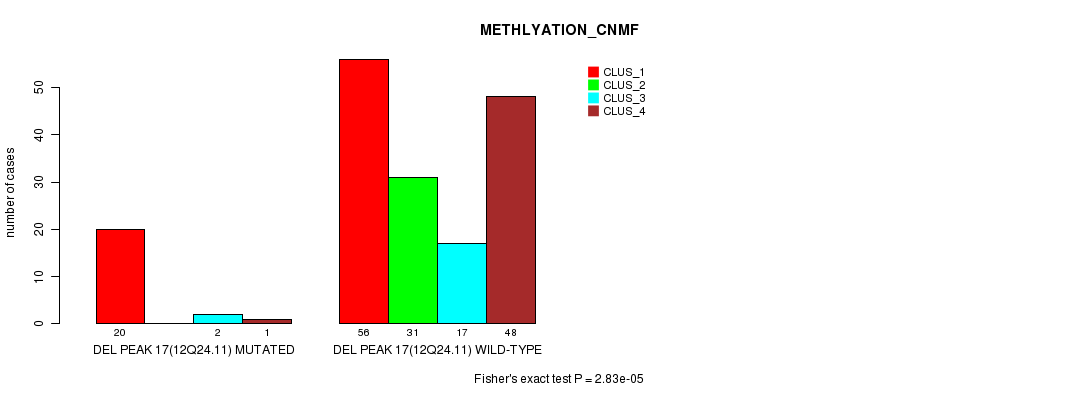
Del Peak 17(12q24.11) cnvs correlated to 'CN_CNMF' and 'METHLYATION_CNMF'.
-
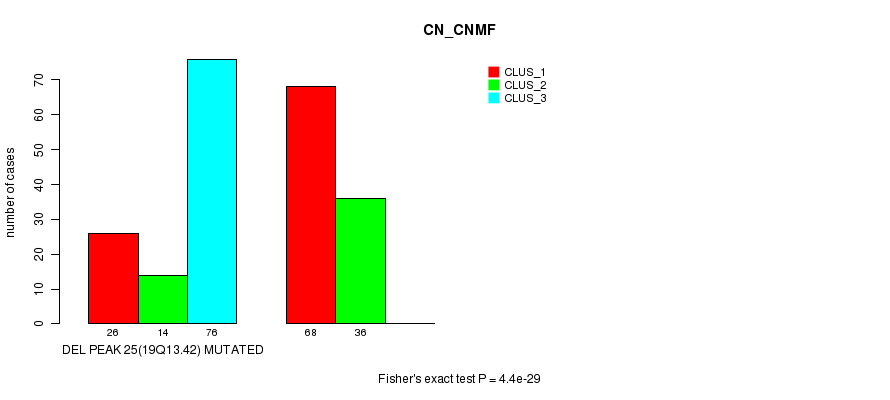
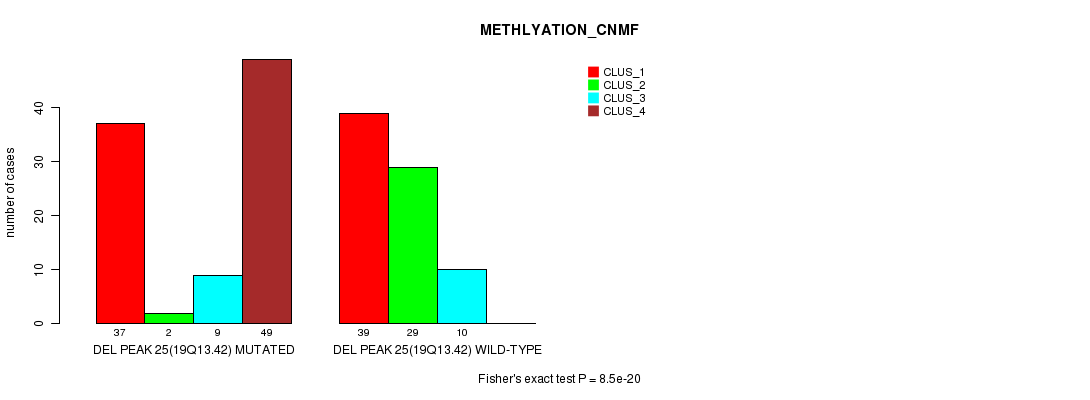
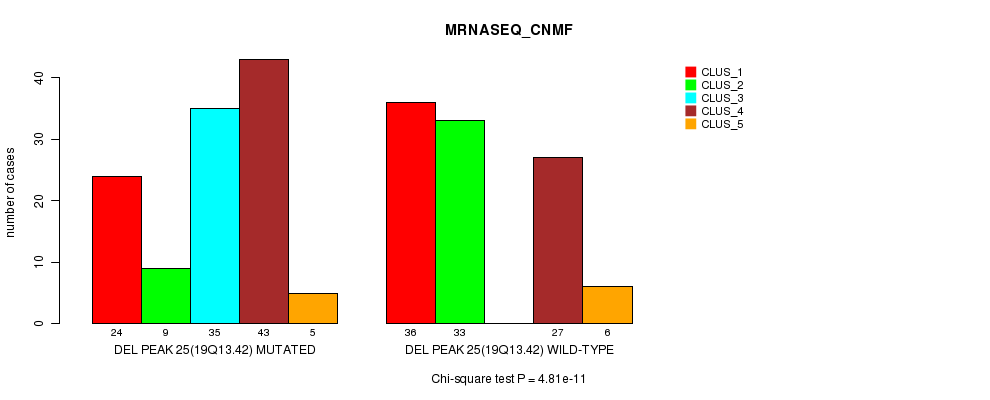
Del Peak 25(19q13.42) cnvs correlated to 'CN_CNMF', 'METHLYATION_CNMF', 'MRNASEQ_CNMF', 'MRNASEQ_CHIERARCHICAL', and 'MIRSEQ_CNMF'.
-
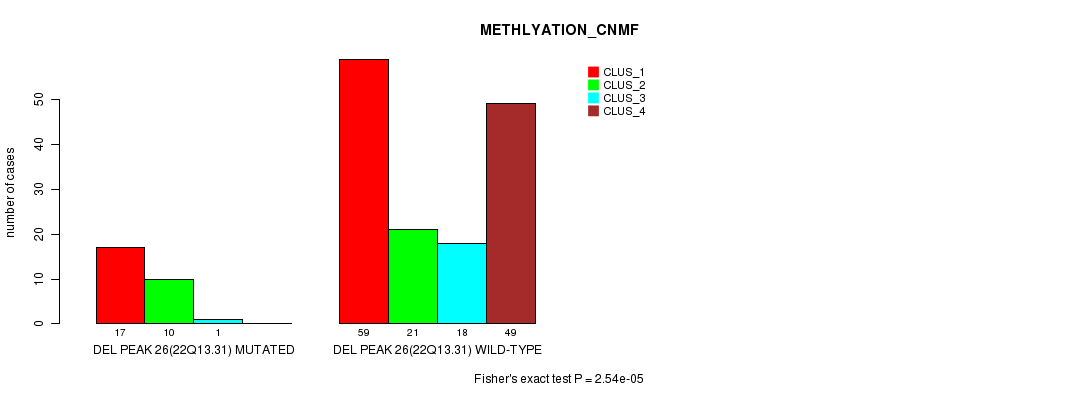
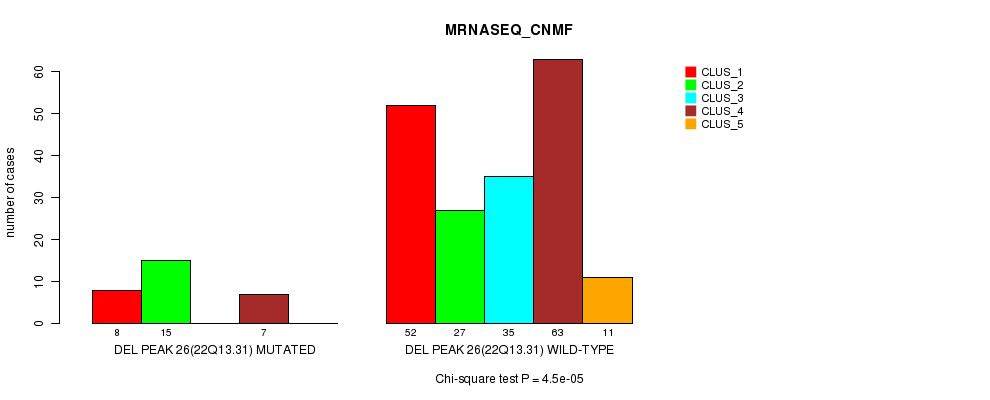
Del Peak 26(22q13.31) cnvs correlated to 'CN_CNMF', 'METHLYATION_CNMF', and 'MRNASEQ_CNMF'.
-
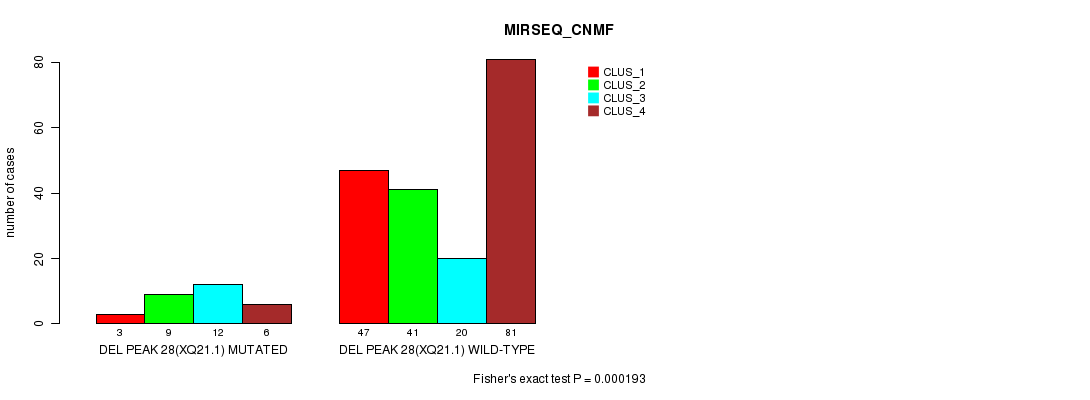
Del Peak 28(Xq21.1) cnvs correlated to 'MIRSEQ_CNMF'.
Table 1. Get Full Table Overview of the association between significant copy number variation of 43 regions and 8 molecular subtypes. Shown in the table are P values (Q values). Thresholded by Q value < 0.25, 62 significant findings detected.
|
Molecular subtypes |
MRNA CNMF |
MRNA CHIERARCHICAL |
CN CNMF |
METHLYATION CNMF |
MRNASEQ CNMF |
MRNASEQ CHIERARCHICAL |
MIRSEQ CNMF |
MIRSEQ CHIERARCHICAL |
||
| nCNV (%) | nWild-Type | Fisher's exact test | Fisher's exact test | Fisher's exact test | Fisher's exact test | Chi-square test | Fisher's exact test | Fisher's exact test | Fisher's exact test | |
| Del Peak 1(1p36 31) | 83 (38%) | 137 |
0.000549 (0.149) |
0.00201 (0.512) |
3.69e-31 (1.2e-28) |
9.32e-30 (3.01e-27) |
4.44e-17 (1.4e-14) |
7.5e-20 (2.4e-17) |
4.56e-11 (1.41e-08) |
0.00939 (1.00) |
| Del Peak 2(1p32 3) | 77 (35%) | 143 |
0.0286 (1.00) |
0.0635 (1.00) |
2.88e-37 (9.38e-35) |
1.56e-34 (5.08e-32) |
2.7e-18 (8.55e-16) |
2.09e-23 (6.71e-21) |
3.51e-13 (1.1e-10) |
0.0009 (0.238) |
| Del Peak 14(10q26 2) | 70 (32%) | 150 |
0.179 (1.00) |
0.257 (1.00) |
1.05e-17 (3.33e-15) |
1.02e-12 (3.18e-10) |
1.09e-13 (3.4e-11) |
2.8e-08 (8.44e-06) |
3.44e-06 (0.00101) |
0.000724 (0.193) |
| Del Peak 25(19q13 42) | 116 (53%) | 104 |
0.0353 (1.00) |
0.0105 (1.00) |
4.4e-29 (1.42e-26) |
8.5e-20 (2.71e-17) |
4.81e-11 (1.48e-08) |
3.35e-12 (1.04e-09) |
6.67e-10 (2.05e-07) |
0.112 (1.00) |
| Amp Peak 1(1q32 1) | 23 (10%) | 197 |
7.81e-07 (0.000231) |
0.000595 (0.16) |
1.9e-05 (0.00547) |
0.378 (1.00) |
0.639 (1.00) |
0.416 (1.00) |
||
| Amp Peak 3(7p11 2) | 55 (25%) | 165 |
0.864 (1.00) |
0.86 (1.00) |
1.1e-18 (3.49e-16) |
6.49e-09 (1.97e-06) |
1.17e-09 (3.57e-07) |
0.0172 (1.00) |
0.00108 (0.284) |
0.0182 (1.00) |
| Amp Peak 4(7q32 3) | 77 (35%) | 143 |
0.764 (1.00) |
0.575 (1.00) |
8.39e-17 (2.63e-14) |
0.000304 (0.0833) |
2.53e-05 (0.00722) |
0.0286 (1.00) |
0.0551 (1.00) |
0.207 (1.00) |
| Amp Peak 6(10p15 1) | 35 (16%) | 185 |
0.467 (1.00) |
0.468 (1.00) |
2.61e-09 (7.95e-07) |
6.67e-07 (0.000198) |
0.00335 (0.83) |
0.00473 (1.00) |
0.000613 (0.164) |
0.869 (1.00) |
| Amp Peak 15(Xq11 2) | 31 (14%) | 189 |
0.282 (1.00) |
0.803 (1.00) |
3.63e-06 (0.00106) |
3.45e-08 (1.04e-05) |
0.0118 (1.00) |
0.000397 (0.108) |
0.124 (1.00) |
0.373 (1.00) |
| Del Peak 15(11p15 5) | 48 (22%) | 172 |
0.642 (1.00) |
0.184 (1.00) |
1.98e-07 (5.91e-05) |
9.49e-08 (2.85e-05) |
0.0248 (1.00) |
0.000283 (0.0777) |
0.206 (1.00) |
0.428 (1.00) |
| Del Peak 26(22q13 31) | 31 (14%) | 189 |
0.25 (1.00) |
0.144 (1.00) |
2.21e-06 (0.00065) |
2.54e-05 (0.00724) |
4.5e-05 (0.0127) |
0.00189 (0.487) |
0.00961 (1.00) |
0.119 (1.00) |
| Amp Peak 5(8q24 21) | 44 (20%) | 176 |
0.37 (1.00) |
1 (1.00) |
6.87e-06 (0.002) |
3.75e-05 (0.0106) |
0.00114 (0.299) |
0.00189 (0.487) |
0.0201 (1.00) |
0.11 (1.00) |
| Amp Peak 9(12p13 32) | 34 (15%) | 186 |
0.864 (1.00) |
0.86 (1.00) |
1e-05 (0.00289) |
0.000578 (0.156) |
0.0134 (1.00) |
0.000959 (0.253) |
0.00802 (1.00) |
0.00986 (1.00) |
| Amp Peak 12(19p13 3) | 51 (23%) | 169 |
0.186 (1.00) |
0.272 (1.00) |
1.69e-09 (5.16e-07) |
0.000215 (0.0597) |
0.00459 (1.00) |
0.00296 (0.741) |
0.113 (1.00) |
0.546 (1.00) |
| Amp Peak 13(19q13 2) | 15 (7%) | 205 |
0.369 (1.00) |
0.327 (1.00) |
1.02e-06 (3e-04) |
0.00611 (1.00) |
0.000267 (0.0736) |
0.0101 (1.00) |
0.0341 (1.00) |
0.0081 (1.00) |
| Del Peak 8(4q35 2) | 62 (28%) | 158 |
1 (1.00) |
0.784 (1.00) |
8.18e-05 (0.0229) |
0.000207 (0.0574) |
0.019 (1.00) |
0.0166 (1.00) |
0.00505 (1.00) |
0.262 (1.00) |
| Del Peak 13(9p21 3) | 78 (35%) | 142 |
0.333 (1.00) |
0.272 (1.00) |
2.4e-07 (7.15e-05) |
1.3e-05 (0.00374) |
0.00679 (1.00) |
0.0465 (1.00) |
0.256 (1.00) |
0.15 (1.00) |
| Del Peak 17(12q24 11) | 30 (14%) | 190 |
1 (1.00) |
0.388 (1.00) |
4.97e-05 (0.014) |
2.83e-05 (0.00804) |
0.312 (1.00) |
0.00896 (1.00) |
0.0154 (1.00) |
0.766 (1.00) |
| Del Peak 4(2q37 3) | 32 (15%) | 188 |
0.18 (1.00) |
0.547 (1.00) |
0.00134 (0.348) |
8.8e-06 (0.00255) |
0.0218 (1.00) |
0.0217 (1.00) |
0.063 (1.00) |
0.204 (1.00) |
| Del Peak 7(4q33) | 61 (28%) | 159 |
1 (1.00) |
0.784 (1.00) |
0.000502 (0.137) |
0.00117 (0.305) |
0.0319 (1.00) |
0.0186 (1.00) |
0.00194 (0.496) |
0.362 (1.00) |
| Del Peak 9(5q35 2) | 28 (13%) | 192 |
0.446 (1.00) |
0.61 (1.00) |
0.00261 (0.654) |
0.000731 (0.195) |
0.0301 (1.00) |
0.0054 (1.00) |
0.0269 (1.00) |
0.0798 (1.00) |
| Del Peak 28(Xq21 1) | 30 (14%) | 190 |
0.73 (1.00) |
0.504 (1.00) |
0.468 (1.00) |
0.0673 (1.00) |
0.00838 (1.00) |
0.0258 (1.00) |
0.000193 (0.0538) |
0.363 (1.00) |
| Amp Peak 2(4q12) | 10 (5%) | 210 |
0.503 (1.00) |
0.153 (1.00) |
0.393 (1.00) |
0.543 (1.00) |
0.812 (1.00) |
0.393 (1.00) |
||
| Amp Peak 7(10q11 21) | 5 (2%) | 215 |
0.2 (1.00) |
0.426 (1.00) |
0.213 (1.00) |
0.176 (1.00) |
0.00949 (1.00) |
0.556 (1.00) |
||
| Amp Peak 8(11q23 3) | 38 (17%) | 182 |
0.0708 (1.00) |
0.0162 (1.00) |
0.922 (1.00) |
0.158 (1.00) |
0.217 (1.00) |
0.23 (1.00) |
0.479 (1.00) |
0.591 (1.00) |
| Amp Peak 10(12p11 22) | 21 (10%) | 199 |
1 (1.00) |
0.388 (1.00) |
0.0212 (1.00) |
0.0379 (1.00) |
0.142 (1.00) |
0.00329 (0.82) |
0.00209 (0.531) |
0.0355 (1.00) |
| Amp Peak 11(12q14 1) | 14 (6%) | 206 |
0.122 (1.00) |
0.653 (1.00) |
0.029 (1.00) |
0.328 (1.00) |
0.94 (1.00) |
0.909 (1.00) |
||
| Amp Peak 14(Xp22 33) | 15 (7%) | 205 |
0.00248 (0.624) |
0.00755 (1.00) |
0.323 (1.00) |
0.0905 (1.00) |
0.121 (1.00) |
1 (1.00) |
||
| Del Peak 3(1q43) | 13 (6%) | 207 |
0.666 (1.00) |
0.0484 (1.00) |
0.202 (1.00) |
0.0861 (1.00) |
0.343 (1.00) |
0.296 (1.00) |
||
| Del Peak 5(3p21 1) | 20 (9%) | 200 |
1 (1.00) |
0.413 (1.00) |
0.359 (1.00) |
0.0114 (1.00) |
0.94 (1.00) |
0.0143 (1.00) |
0.0566 (1.00) |
0.00812 (1.00) |
| Del Peak 6(3q29) | 21 (10%) | 199 |
0.175 (1.00) |
1 (1.00) |
0.00982 (1.00) |
0.0087 (1.00) |
0.114 (1.00) |
0.074 (1.00) |
0.54 (1.00) |
0.136 (1.00) |
| Del Peak 10(6p24 1) | 21 (10%) | 199 |
0.131 (1.00) |
0.111 (1.00) |
0.436 (1.00) |
0.233 (1.00) |
0.252 (1.00) |
0.45 (1.00) |
||
| Del Peak 11(6q24 3) | 33 (15%) | 187 |
0.0479 (1.00) |
0.0407 (1.00) |
0.0158 (1.00) |
0.0115 (1.00) |
0.269 (1.00) |
0.0519 (1.00) |
0.0189 (1.00) |
0.449 (1.00) |
| Del Peak 12(8p23 2) | 11 (5%) | 209 |
1 (1.00) |
0.388 (1.00) |
0.00696 (1.00) |
0.0377 (1.00) |
0.136 (1.00) |
0.36 (1.00) |
0.634 (1.00) |
0.23 (1.00) |
| Del Peak 16(11q25) | 15 (7%) | 205 |
0.00183 (0.475) |
0.0377 (1.00) |
0.126 (1.00) |
0.0905 (1.00) |
0.633 (1.00) |
0.118 (1.00) |
||
| Del Peak 18(13q14 2) | 65 (30%) | 155 |
0.18 (1.00) |
0.0733 (1.00) |
0.054 (1.00) |
0.0417 (1.00) |
0.482 (1.00) |
0.202 (1.00) |
0.214 (1.00) |
0.548 (1.00) |
| Del Peak 19(13q34) | 50 (23%) | 170 |
0.508 (1.00) |
0.526 (1.00) |
0.244 (1.00) |
0.529 (1.00) |
0.242 (1.00) |
0.156 (1.00) |
0.106 (1.00) |
0.316 (1.00) |
| Del Peak 20(14q24 3) | 51 (23%) | 169 |
0.303 (1.00) |
0.341 (1.00) |
0.00236 (0.596) |
0.0469 (1.00) |
0.0253 (1.00) |
0.118 (1.00) |
0.00879 (1.00) |
0.0141 (1.00) |
| Del Peak 21(15q21 3) | 27 (12%) | 193 |
0.839 (1.00) |
0.828 (1.00) |
0.0596 (1.00) |
0.479 (1.00) |
0.00699 (1.00) |
0.247 (1.00) |
0.34 (1.00) |
0.841 (1.00) |
| Del Peak 22(17q25 3) | 15 (7%) | 205 |
0.0206 (1.00) |
0.453 (1.00) |
0.658 (1.00) |
0.367 (1.00) |
0.354 (1.00) |
0.755 (1.00) |
||
| Del Peak 23(18p11 32) | 32 (15%) | 188 |
0.321 (1.00) |
0.388 (1.00) |
0.552 (1.00) |
0.425 (1.00) |
0.481 (1.00) |
0.648 (1.00) |
0.68 (1.00) |
0.38 (1.00) |
| Del Peak 24(18q23) | 35 (16%) | 185 |
0.321 (1.00) |
0.388 (1.00) |
0.918 (1.00) |
0.374 (1.00) |
0.489 (1.00) |
0.875 (1.00) |
0.756 (1.00) |
0.54 (1.00) |
| Del Peak 27(Xp22 31) | 51 (23%) | 169 |
0.73 (1.00) |
0.61 (1.00) |
0.517 (1.00) |
0.0898 (1.00) |
0.548 (1.00) |
0.0926 (1.00) |
0.0789 (1.00) |
0.0865 (1.00) |
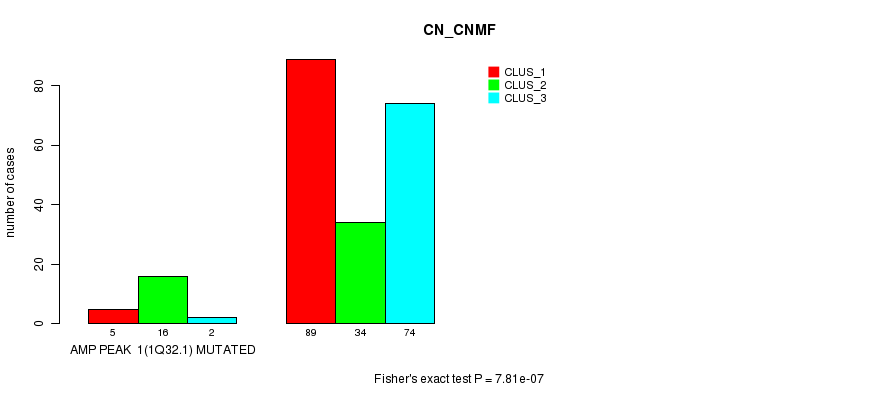
P value = 7.81e-07 (Fisher's exact test), Q value = 0.00023
Table S1. Gene #1: 'Amp Peak 1(1q32.1) mutation analysis' versus Clinical Feature #3: 'CN_CNMF'
| nPatients | CLUS_1 | CLUS_2 | CLUS_3 |
|---|---|---|---|
| ALL | 94 | 50 | 76 |
| AMP PEAK 1(1Q32.1) MUTATED | 5 | 16 | 2 |
| AMP PEAK 1(1Q32.1) WILD-TYPE | 89 | 34 | 74 |
Figure S1. Get High-res Image Gene #1: 'Amp Peak 1(1q32.1) mutation analysis' versus Clinical Feature #3: 'CN_CNMF'
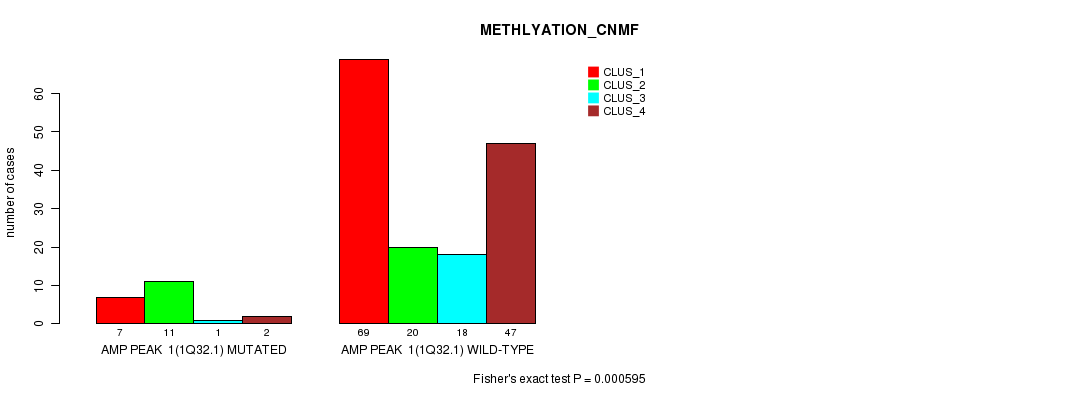
P value = 0.000595 (Fisher's exact test), Q value = 0.16
Table S2. Gene #1: 'Amp Peak 1(1q32.1) mutation analysis' versus Clinical Feature #4: 'METHLYATION_CNMF'
| nPatients | CLUS_1 | CLUS_2 | CLUS_3 | CLUS_4 |
|---|---|---|---|---|
| ALL | 76 | 31 | 19 | 49 |
| AMP PEAK 1(1Q32.1) MUTATED | 7 | 11 | 1 | 2 |
| AMP PEAK 1(1Q32.1) WILD-TYPE | 69 | 20 | 18 | 47 |
Figure S2. Get High-res Image Gene #1: 'Amp Peak 1(1q32.1) mutation analysis' versus Clinical Feature #4: 'METHLYATION_CNMF'
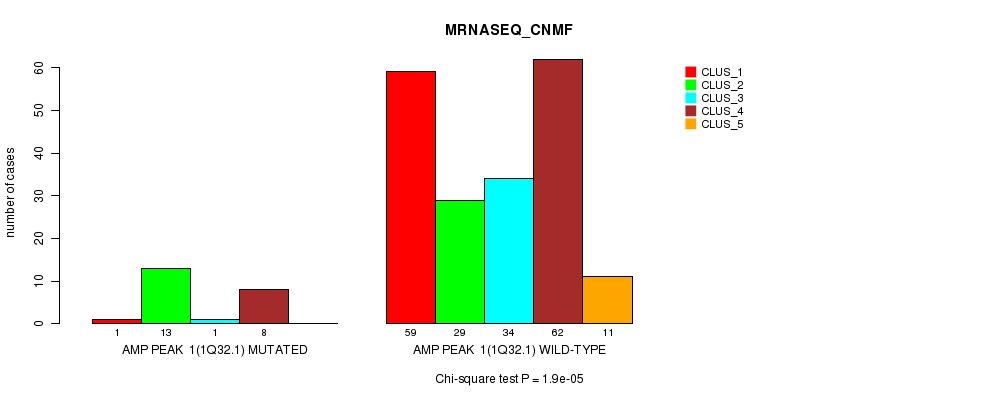
P value = 1.9e-05 (Chi-square test), Q value = 0.0055
Table S3. Gene #1: 'Amp Peak 1(1q32.1) mutation analysis' versus Clinical Feature #5: 'MRNASEQ_CNMF'
| nPatients | CLUS_1 | CLUS_2 | CLUS_3 | CLUS_4 | CLUS_5 |
|---|---|---|---|---|---|
| ALL | 60 | 42 | 35 | 70 | 11 |
| AMP PEAK 1(1Q32.1) MUTATED | 1 | 13 | 1 | 8 | 0 |
| AMP PEAK 1(1Q32.1) WILD-TYPE | 59 | 29 | 34 | 62 | 11 |
Figure S3. Get High-res Image Gene #1: 'Amp Peak 1(1q32.1) mutation analysis' versus Clinical Feature #5: 'MRNASEQ_CNMF'
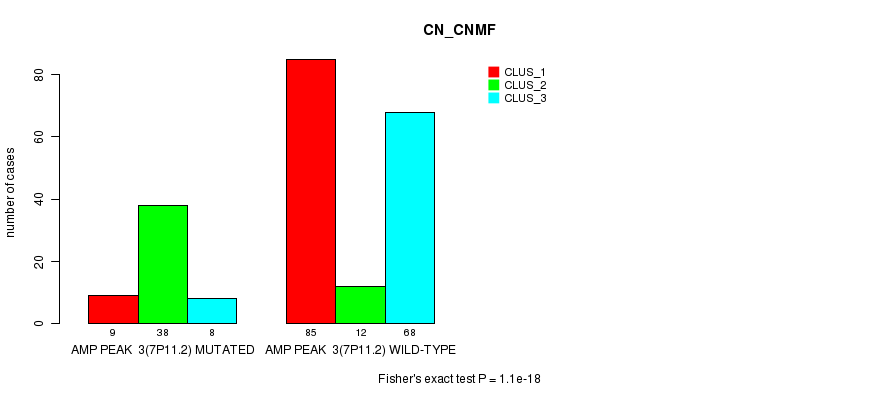
P value = 1.1e-18 (Fisher's exact test), Q value = 3.5e-16
Table S4. Gene #3: 'Amp Peak 3(7p11.2) mutation analysis' versus Clinical Feature #3: 'CN_CNMF'
| nPatients | CLUS_1 | CLUS_2 | CLUS_3 |
|---|---|---|---|
| ALL | 94 | 50 | 76 |
| AMP PEAK 3(7P11.2) MUTATED | 9 | 38 | 8 |
| AMP PEAK 3(7P11.2) WILD-TYPE | 85 | 12 | 68 |
Figure S4. Get High-res Image Gene #3: 'Amp Peak 3(7p11.2) mutation analysis' versus Clinical Feature #3: 'CN_CNMF'
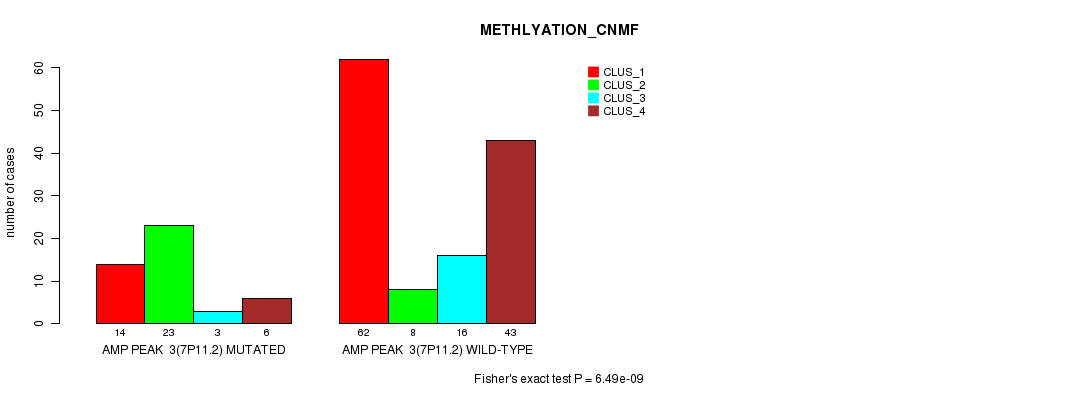
P value = 6.49e-09 (Fisher's exact test), Q value = 2e-06
Table S5. Gene #3: 'Amp Peak 3(7p11.2) mutation analysis' versus Clinical Feature #4: 'METHLYATION_CNMF'
| nPatients | CLUS_1 | CLUS_2 | CLUS_3 | CLUS_4 |
|---|---|---|---|---|
| ALL | 76 | 31 | 19 | 49 |
| AMP PEAK 3(7P11.2) MUTATED | 14 | 23 | 3 | 6 |
| AMP PEAK 3(7P11.2) WILD-TYPE | 62 | 8 | 16 | 43 |
Figure S5. Get High-res Image Gene #3: 'Amp Peak 3(7p11.2) mutation analysis' versus Clinical Feature #4: 'METHLYATION_CNMF'
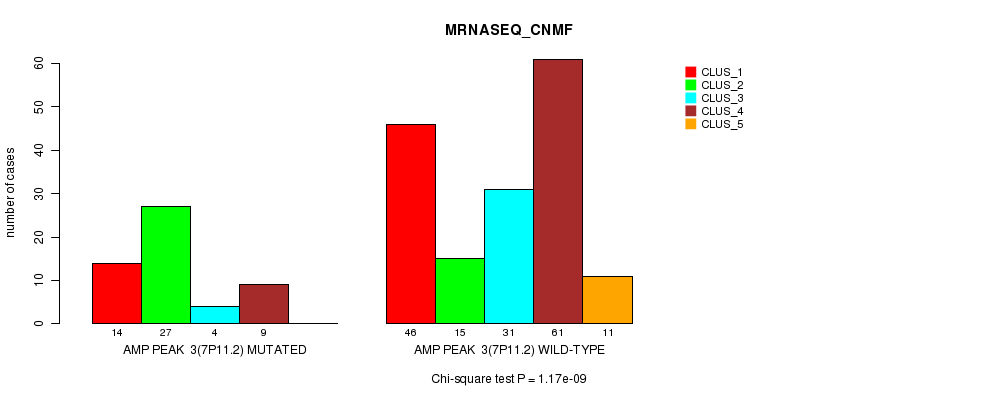
P value = 1.17e-09 (Chi-square test), Q value = 3.6e-07
Table S6. Gene #3: 'Amp Peak 3(7p11.2) mutation analysis' versus Clinical Feature #5: 'MRNASEQ_CNMF'
| nPatients | CLUS_1 | CLUS_2 | CLUS_3 | CLUS_4 | CLUS_5 |
|---|---|---|---|---|---|
| ALL | 60 | 42 | 35 | 70 | 11 |
| AMP PEAK 3(7P11.2) MUTATED | 14 | 27 | 4 | 9 | 0 |
| AMP PEAK 3(7P11.2) WILD-TYPE | 46 | 15 | 31 | 61 | 11 |
Figure S6. Get High-res Image Gene #3: 'Amp Peak 3(7p11.2) mutation analysis' versus Clinical Feature #5: 'MRNASEQ_CNMF'
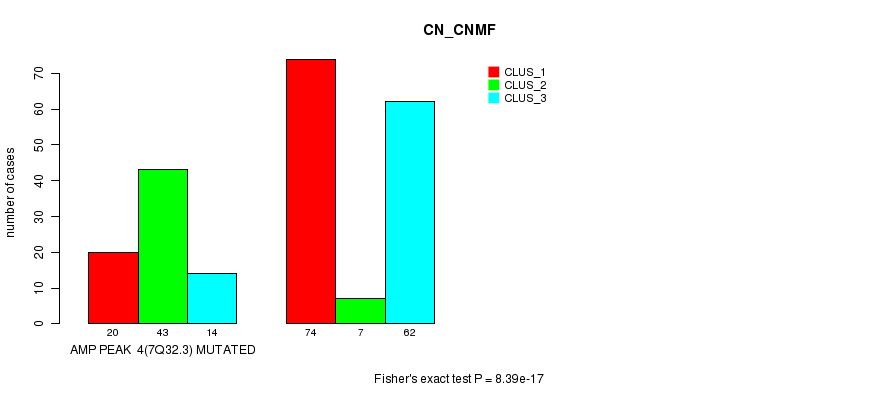
P value = 8.39e-17 (Fisher's exact test), Q value = 2.6e-14
Table S7. Gene #4: 'Amp Peak 4(7q32.3) mutation analysis' versus Clinical Feature #3: 'CN_CNMF'
| nPatients | CLUS_1 | CLUS_2 | CLUS_3 |
|---|---|---|---|
| ALL | 94 | 50 | 76 |
| AMP PEAK 4(7Q32.3) MUTATED | 20 | 43 | 14 |
| AMP PEAK 4(7Q32.3) WILD-TYPE | 74 | 7 | 62 |
Figure S7. Get High-res Image Gene #4: 'Amp Peak 4(7q32.3) mutation analysis' versus Clinical Feature #3: 'CN_CNMF'
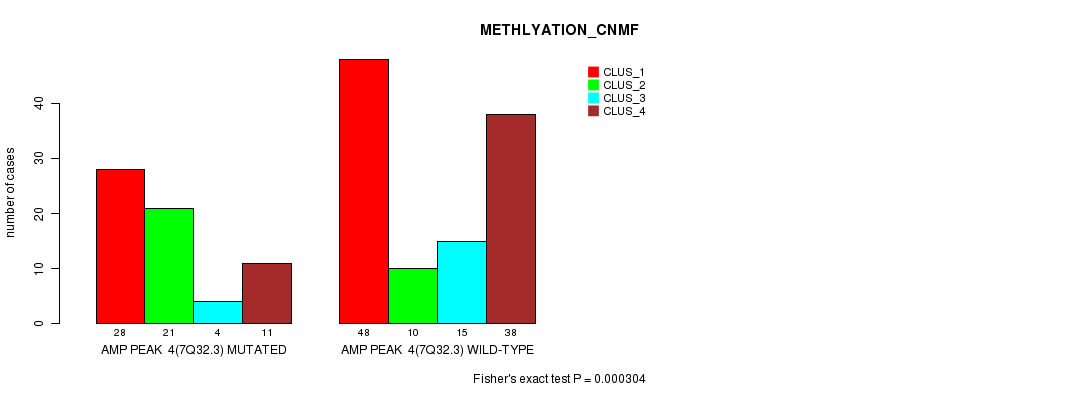
P value = 0.000304 (Fisher's exact test), Q value = 0.083
Table S8. Gene #4: 'Amp Peak 4(7q32.3) mutation analysis' versus Clinical Feature #4: 'METHLYATION_CNMF'
| nPatients | CLUS_1 | CLUS_2 | CLUS_3 | CLUS_4 |
|---|---|---|---|---|
| ALL | 76 | 31 | 19 | 49 |
| AMP PEAK 4(7Q32.3) MUTATED | 28 | 21 | 4 | 11 |
| AMP PEAK 4(7Q32.3) WILD-TYPE | 48 | 10 | 15 | 38 |
Figure S8. Get High-res Image Gene #4: 'Amp Peak 4(7q32.3) mutation analysis' versus Clinical Feature #4: 'METHLYATION_CNMF'
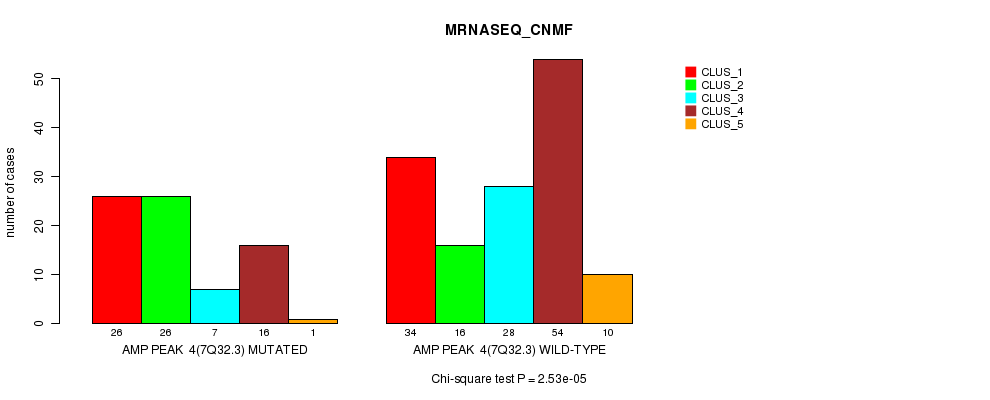
P value = 2.53e-05 (Chi-square test), Q value = 0.0072
Table S9. Gene #4: 'Amp Peak 4(7q32.3) mutation analysis' versus Clinical Feature #5: 'MRNASEQ_CNMF'
| nPatients | CLUS_1 | CLUS_2 | CLUS_3 | CLUS_4 | CLUS_5 |
|---|---|---|---|---|---|
| ALL | 60 | 42 | 35 | 70 | 11 |
| AMP PEAK 4(7Q32.3) MUTATED | 26 | 26 | 7 | 16 | 1 |
| AMP PEAK 4(7Q32.3) WILD-TYPE | 34 | 16 | 28 | 54 | 10 |
Figure S9. Get High-res Image Gene #4: 'Amp Peak 4(7q32.3) mutation analysis' versus Clinical Feature #5: 'MRNASEQ_CNMF'
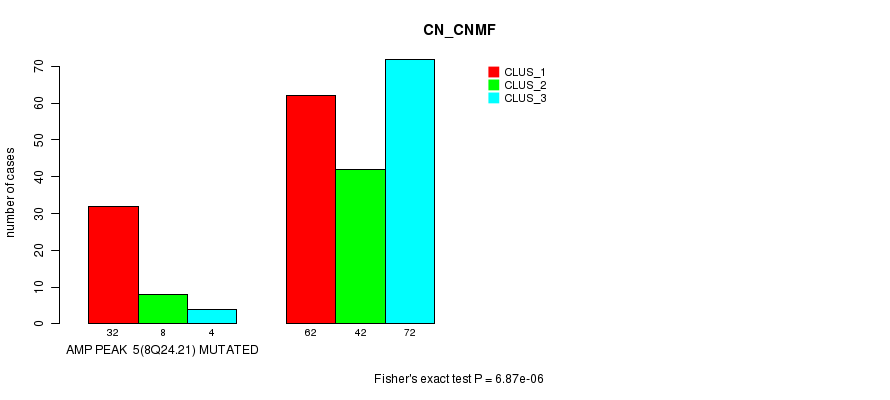
P value = 6.87e-06 (Fisher's exact test), Q value = 0.002
Table S10. Gene #5: 'Amp Peak 5(8q24.21) mutation analysis' versus Clinical Feature #3: 'CN_CNMF'
| nPatients | CLUS_1 | CLUS_2 | CLUS_3 |
|---|---|---|---|
| ALL | 94 | 50 | 76 |
| AMP PEAK 5(8Q24.21) MUTATED | 32 | 8 | 4 |
| AMP PEAK 5(8Q24.21) WILD-TYPE | 62 | 42 | 72 |
Figure S10. Get High-res Image Gene #5: 'Amp Peak 5(8q24.21) mutation analysis' versus Clinical Feature #3: 'CN_CNMF'
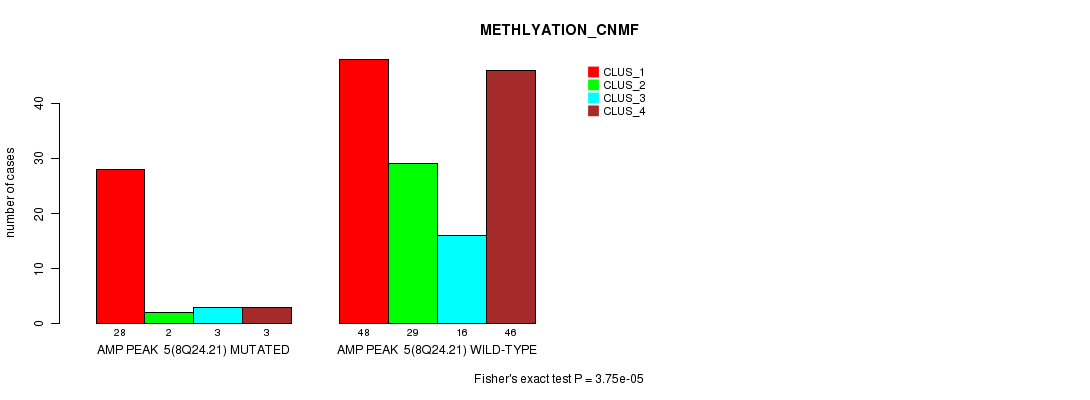
P value = 3.75e-05 (Fisher's exact test), Q value = 0.011
Table S11. Gene #5: 'Amp Peak 5(8q24.21) mutation analysis' versus Clinical Feature #4: 'METHLYATION_CNMF'
| nPatients | CLUS_1 | CLUS_2 | CLUS_3 | CLUS_4 |
|---|---|---|---|---|
| ALL | 76 | 31 | 19 | 49 |
| AMP PEAK 5(8Q24.21) MUTATED | 28 | 2 | 3 | 3 |
| AMP PEAK 5(8Q24.21) WILD-TYPE | 48 | 29 | 16 | 46 |
Figure S11. Get High-res Image Gene #5: 'Amp Peak 5(8q24.21) mutation analysis' versus Clinical Feature #4: 'METHLYATION_CNMF'
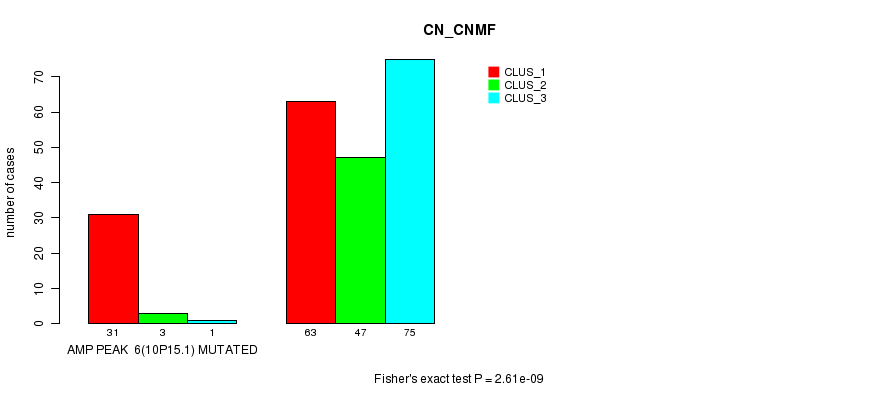
P value = 2.61e-09 (Fisher's exact test), Q value = 7.9e-07
Table S12. Gene #6: 'Amp Peak 6(10p15.1) mutation analysis' versus Clinical Feature #3: 'CN_CNMF'
| nPatients | CLUS_1 | CLUS_2 | CLUS_3 |
|---|---|---|---|
| ALL | 94 | 50 | 76 |
| AMP PEAK 6(10P15.1) MUTATED | 31 | 3 | 1 |
| AMP PEAK 6(10P15.1) WILD-TYPE | 63 | 47 | 75 |
Figure S12. Get High-res Image Gene #6: 'Amp Peak 6(10p15.1) mutation analysis' versus Clinical Feature #3: 'CN_CNMF'
P value = 6.67e-07 (Fisher's exact test), Q value = 2e-04
Table S13. Gene #6: 'Amp Peak 6(10p15.1) mutation analysis' versus Clinical Feature #4: 'METHLYATION_CNMF'
| nPatients | CLUS_1 | CLUS_2 | CLUS_3 | CLUS_4 |
|---|---|---|---|---|
| ALL | 76 | 31 | 19 | 49 |
| AMP PEAK 6(10P15.1) MUTATED | 24 | 1 | 4 | 0 |
| AMP PEAK 6(10P15.1) WILD-TYPE | 52 | 30 | 15 | 49 |
Figure S13. Get High-res Image Gene #6: 'Amp Peak 6(10p15.1) mutation analysis' versus Clinical Feature #4: 'METHLYATION_CNMF'
P value = 0.000613 (Fisher's exact test), Q value = 0.16
Table S14. Gene #6: 'Amp Peak 6(10p15.1) mutation analysis' versus Clinical Feature #7: 'MIRSEQ_CNMF'
| nPatients | CLUS_1 | CLUS_2 | CLUS_3 | CLUS_4 |
|---|---|---|---|---|
| ALL | 50 | 50 | 32 | 87 |
| AMP PEAK 6(10P15.1) MUTATED | 8 | 16 | 0 | 11 |
| AMP PEAK 6(10P15.1) WILD-TYPE | 42 | 34 | 32 | 76 |
Figure S14. Get High-res Image Gene #6: 'Amp Peak 6(10p15.1) mutation analysis' versus Clinical Feature #7: 'MIRSEQ_CNMF'
P value = 1e-05 (Fisher's exact test), Q value = 0.0029
Table S15. Gene #9: 'Amp Peak 9(12p13.32) mutation analysis' versus Clinical Feature #3: 'CN_CNMF'
| nPatients | CLUS_1 | CLUS_2 | CLUS_3 |
|---|---|---|---|
| ALL | 94 | 50 | 76 |
| AMP PEAK 9(12P13.32) MUTATED | 27 | 4 | 3 |
| AMP PEAK 9(12P13.32) WILD-TYPE | 67 | 46 | 73 |
Figure S15. Get High-res Image Gene #9: 'Amp Peak 9(12p13.32) mutation analysis' versus Clinical Feature #3: 'CN_CNMF'
P value = 0.000578 (Fisher's exact test), Q value = 0.16
Table S16. Gene #9: 'Amp Peak 9(12p13.32) mutation analysis' versus Clinical Feature #4: 'METHLYATION_CNMF'
| nPatients | CLUS_1 | CLUS_2 | CLUS_3 | CLUS_4 |
|---|---|---|---|---|
| ALL | 76 | 31 | 19 | 49 |
| AMP PEAK 9(12P13.32) MUTATED | 23 | 3 | 2 | 2 |
| AMP PEAK 9(12P13.32) WILD-TYPE | 53 | 28 | 17 | 47 |
Figure S16. Get High-res Image Gene #9: 'Amp Peak 9(12p13.32) mutation analysis' versus Clinical Feature #4: 'METHLYATION_CNMF'
P value = 1.69e-09 (Fisher's exact test), Q value = 5.2e-07
Table S17. Gene #12: 'Amp Peak 12(19p13.3) mutation analysis' versus Clinical Feature #3: 'CN_CNMF'
| nPatients | CLUS_1 | CLUS_2 | CLUS_3 |
|---|---|---|---|
| ALL | 94 | 50 | 76 |
| AMP PEAK 12(19P13.3) MUTATED | 4 | 15 | 32 |
| AMP PEAK 12(19P13.3) WILD-TYPE | 90 | 35 | 44 |
Figure S17. Get High-res Image Gene #12: 'Amp Peak 12(19p13.3) mutation analysis' versus Clinical Feature #3: 'CN_CNMF'
P value = 0.000215 (Fisher's exact test), Q value = 0.06
Table S18. Gene #12: 'Amp Peak 12(19p13.3) mutation analysis' versus Clinical Feature #4: 'METHLYATION_CNMF'
| nPatients | CLUS_1 | CLUS_2 | CLUS_3 | CLUS_4 |
|---|---|---|---|---|
| ALL | 76 | 31 | 19 | 49 |
| AMP PEAK 12(19P13.3) MUTATED | 8 | 8 | 2 | 21 |
| AMP PEAK 12(19P13.3) WILD-TYPE | 68 | 23 | 17 | 28 |
Figure S18. Get High-res Image Gene #12: 'Amp Peak 12(19p13.3) mutation analysis' versus Clinical Feature #4: 'METHLYATION_CNMF'
P value = 1.02e-06 (Fisher's exact test), Q value = 3e-04
Table S19. Gene #13: 'Amp Peak 13(19q13.2) mutation analysis' versus Clinical Feature #3: 'CN_CNMF'
| nPatients | CLUS_1 | CLUS_2 | CLUS_3 |
|---|---|---|---|
| ALL | 94 | 50 | 76 |
| AMP PEAK 13(19Q13.2) MUTATED | 1 | 12 | 2 |
| AMP PEAK 13(19Q13.2) WILD-TYPE | 93 | 38 | 74 |
Figure S19. Get High-res Image Gene #13: 'Amp Peak 13(19q13.2) mutation analysis' versus Clinical Feature #3: 'CN_CNMF'

P value = 0.000267 (Chi-square test), Q value = 0.074
Table S20. Gene #13: 'Amp Peak 13(19q13.2) mutation analysis' versus Clinical Feature #5: 'MRNASEQ_CNMF'
| nPatients | CLUS_1 | CLUS_2 | CLUS_3 | CLUS_4 | CLUS_5 |
|---|---|---|---|---|---|
| ALL | 60 | 42 | 35 | 70 | 11 |
| AMP PEAK 13(19Q13.2) MUTATED | 3 | 9 | 0 | 1 | 1 |
| AMP PEAK 13(19Q13.2) WILD-TYPE | 57 | 33 | 35 | 69 | 10 |
Figure S20. Get High-res Image Gene #13: 'Amp Peak 13(19q13.2) mutation analysis' versus Clinical Feature #5: 'MRNASEQ_CNMF'
P value = 3.63e-06 (Fisher's exact test), Q value = 0.0011
Table S21. Gene #15: 'Amp Peak 15(Xq11.2) mutation analysis' versus Clinical Feature #3: 'CN_CNMF'
| nPatients | CLUS_1 | CLUS_2 | CLUS_3 |
|---|---|---|---|
| ALL | 94 | 50 | 76 |
| AMP PEAK 15(XQ11.2) MUTATED | 26 | 2 | 3 |
| AMP PEAK 15(XQ11.2) WILD-TYPE | 68 | 48 | 73 |
Figure S21. Get High-res Image Gene #15: 'Amp Peak 15(Xq11.2) mutation analysis' versus Clinical Feature #3: 'CN_CNMF'
P value = 3.45e-08 (Fisher's exact test), Q value = 1e-05
Table S22. Gene #15: 'Amp Peak 15(Xq11.2) mutation analysis' versus Clinical Feature #4: 'METHLYATION_CNMF'
| nPatients | CLUS_1 | CLUS_2 | CLUS_3 | CLUS_4 |
|---|---|---|---|---|
| ALL | 76 | 31 | 19 | 49 |
| AMP PEAK 15(XQ11.2) MUTATED | 23 | 0 | 0 | 0 |
| AMP PEAK 15(XQ11.2) WILD-TYPE | 53 | 31 | 19 | 49 |
Figure S22. Get High-res Image Gene #15: 'Amp Peak 15(Xq11.2) mutation analysis' versus Clinical Feature #4: 'METHLYATION_CNMF'
P value = 0.000397 (Fisher's exact test), Q value = 0.11
Table S23. Gene #15: 'Amp Peak 15(Xq11.2) mutation analysis' versus Clinical Feature #6: 'MRNASEQ_CHIERARCHICAL'
| nPatients | CLUS_1 | CLUS_2 | CLUS_3 |
|---|---|---|---|
| ALL | 32 | 117 | 69 |
| AMP PEAK 15(XQ11.2) MUTATED | 0 | 26 | 5 |
| AMP PEAK 15(XQ11.2) WILD-TYPE | 32 | 91 | 64 |
Figure S23. Get High-res Image Gene #15: 'Amp Peak 15(Xq11.2) mutation analysis' versus Clinical Feature #6: 'MRNASEQ_CHIERARCHICAL'
P value = 0.000549 (Fisher's exact test), Q value = 0.15
Table S24. Gene #16: 'Del Peak 1(1p36.31) mutation analysis' versus Clinical Feature #1: 'MRNA_CNMF'
| nPatients | CLUS_1 | CLUS_2 | CLUS_3 |
|---|---|---|---|
| ALL | 9 | 10 | 8 |
| DEL PEAK 1(1P36.31) MUTATED | 0 | 8 | 2 |
| DEL PEAK 1(1P36.31) WILD-TYPE | 9 | 2 | 6 |
Figure S24. Get High-res Image Gene #16: 'Del Peak 1(1p36.31) mutation analysis' versus Clinical Feature #1: 'MRNA_CNMF'
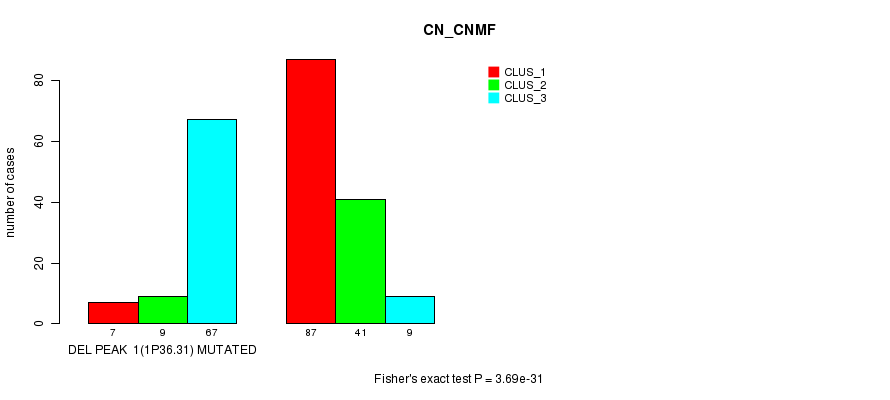
P value = 3.69e-31 (Fisher's exact test), Q value = 1.2e-28
Table S25. Gene #16: 'Del Peak 1(1p36.31) mutation analysis' versus Clinical Feature #3: 'CN_CNMF'
| nPatients | CLUS_1 | CLUS_2 | CLUS_3 |
|---|---|---|---|
| ALL | 94 | 50 | 76 |
| DEL PEAK 1(1P36.31) MUTATED | 7 | 9 | 67 |
| DEL PEAK 1(1P36.31) WILD-TYPE | 87 | 41 | 9 |
Figure S25. Get High-res Image Gene #16: 'Del Peak 1(1p36.31) mutation analysis' versus Clinical Feature #3: 'CN_CNMF'
P value = 9.32e-30 (Fisher's exact test), Q value = 3e-27
Table S26. Gene #16: 'Del Peak 1(1p36.31) mutation analysis' versus Clinical Feature #4: 'METHLYATION_CNMF'
| nPatients | CLUS_1 | CLUS_2 | CLUS_3 | CLUS_4 |
|---|---|---|---|---|
| ALL | 76 | 31 | 19 | 49 |
| DEL PEAK 1(1P36.31) MUTATED | 6 | 7 | 4 | 49 |
| DEL PEAK 1(1P36.31) WILD-TYPE | 70 | 24 | 15 | 0 |
Figure S26. Get High-res Image Gene #16: 'Del Peak 1(1p36.31) mutation analysis' versus Clinical Feature #4: 'METHLYATION_CNMF'

P value = 4.44e-17 (Chi-square test), Q value = 1.4e-14
Table S27. Gene #16: 'Del Peak 1(1p36.31) mutation analysis' versus Clinical Feature #5: 'MRNASEQ_CNMF'
| nPatients | CLUS_1 | CLUS_2 | CLUS_3 | CLUS_4 | CLUS_5 |
|---|---|---|---|---|---|
| ALL | 60 | 42 | 35 | 70 | 11 |
| DEL PEAK 1(1P36.31) MUTATED | 4 | 10 | 34 | 32 | 3 |
| DEL PEAK 1(1P36.31) WILD-TYPE | 56 | 32 | 1 | 38 | 8 |
Figure S27. Get High-res Image Gene #16: 'Del Peak 1(1p36.31) mutation analysis' versus Clinical Feature #5: 'MRNASEQ_CNMF'
P value = 7.5e-20 (Fisher's exact test), Q value = 2.4e-17
Table S28. Gene #16: 'Del Peak 1(1p36.31) mutation analysis' versus Clinical Feature #6: 'MRNASEQ_CHIERARCHICAL'
| nPatients | CLUS_1 | CLUS_2 | CLUS_3 |
|---|---|---|---|
| ALL | 32 | 117 | 69 |
| DEL PEAK 1(1P36.31) MUTATED | 32 | 19 | 32 |
| DEL PEAK 1(1P36.31) WILD-TYPE | 0 | 98 | 37 |
Figure S28. Get High-res Image Gene #16: 'Del Peak 1(1p36.31) mutation analysis' versus Clinical Feature #6: 'MRNASEQ_CHIERARCHICAL'

P value = 4.56e-11 (Fisher's exact test), Q value = 1.4e-08
Table S29. Gene #16: 'Del Peak 1(1p36.31) mutation analysis' versus Clinical Feature #7: 'MIRSEQ_CNMF'
| nPatients | CLUS_1 | CLUS_2 | CLUS_3 | CLUS_4 |
|---|---|---|---|---|
| ALL | 50 | 50 | 32 | 87 |
| DEL PEAK 1(1P36.31) MUTATED | 9 | 7 | 26 | 41 |
| DEL PEAK 1(1P36.31) WILD-TYPE | 41 | 43 | 6 | 46 |
Figure S29. Get High-res Image Gene #16: 'Del Peak 1(1p36.31) mutation analysis' versus Clinical Feature #7: 'MIRSEQ_CNMF'
P value = 2.88e-37 (Fisher's exact test), Q value = 9.4e-35
Table S30. Gene #17: 'Del Peak 2(1p32.3) mutation analysis' versus Clinical Feature #3: 'CN_CNMF'
| nPatients | CLUS_1 | CLUS_2 | CLUS_3 |
|---|---|---|---|
| ALL | 94 | 50 | 76 |
| DEL PEAK 2(1P32.3) MUTATED | 5 | 4 | 68 |
| DEL PEAK 2(1P32.3) WILD-TYPE | 89 | 46 | 8 |
Figure S30. Get High-res Image Gene #17: 'Del Peak 2(1p32.3) mutation analysis' versus Clinical Feature #3: 'CN_CNMF'
P value = 1.56e-34 (Fisher's exact test), Q value = 5.1e-32
Table S31. Gene #17: 'Del Peak 2(1p32.3) mutation analysis' versus Clinical Feature #4: 'METHLYATION_CNMF'
| nPatients | CLUS_1 | CLUS_2 | CLUS_3 | CLUS_4 |
|---|---|---|---|---|
| ALL | 76 | 31 | 19 | 49 |
| DEL PEAK 2(1P32.3) MUTATED | 4 | 2 | 4 | 49 |
| DEL PEAK 2(1P32.3) WILD-TYPE | 72 | 29 | 15 | 0 |
Figure S31. Get High-res Image Gene #17: 'Del Peak 2(1p32.3) mutation analysis' versus Clinical Feature #4: 'METHLYATION_CNMF'
P value = 2.7e-18 (Chi-square test), Q value = 8.6e-16
Table S32. Gene #17: 'Del Peak 2(1p32.3) mutation analysis' versus Clinical Feature #5: 'MRNASEQ_CNMF'
| nPatients | CLUS_1 | CLUS_2 | CLUS_3 | CLUS_4 | CLUS_5 |
|---|---|---|---|---|---|
| ALL | 60 | 42 | 35 | 70 | 11 |
| DEL PEAK 2(1P32.3) MUTATED | 4 | 5 | 33 | 32 | 3 |
| DEL PEAK 2(1P32.3) WILD-TYPE | 56 | 37 | 2 | 38 | 8 |
Figure S32. Get High-res Image Gene #17: 'Del Peak 2(1p32.3) mutation analysis' versus Clinical Feature #5: 'MRNASEQ_CNMF'
P value = 2.09e-23 (Fisher's exact test), Q value = 6.7e-21
Table S33. Gene #17: 'Del Peak 2(1p32.3) mutation analysis' versus Clinical Feature #6: 'MRNASEQ_CHIERARCHICAL'
| nPatients | CLUS_1 | CLUS_2 | CLUS_3 |
|---|---|---|---|
| ALL | 32 | 117 | 69 |
| DEL PEAK 2(1P32.3) MUTATED | 32 | 13 | 32 |
| DEL PEAK 2(1P32.3) WILD-TYPE | 0 | 104 | 37 |
Figure S33. Get High-res Image Gene #17: 'Del Peak 2(1p32.3) mutation analysis' versus Clinical Feature #6: 'MRNASEQ_CHIERARCHICAL'
P value = 3.51e-13 (Fisher's exact test), Q value = 1.1e-10
Table S34. Gene #17: 'Del Peak 2(1p32.3) mutation analysis' versus Clinical Feature #7: 'MIRSEQ_CNMF'
| nPatients | CLUS_1 | CLUS_2 | CLUS_3 | CLUS_4 |
|---|---|---|---|---|
| ALL | 50 | 50 | 32 | 87 |
| DEL PEAK 2(1P32.3) MUTATED | 7 | 4 | 25 | 41 |
| DEL PEAK 2(1P32.3) WILD-TYPE | 43 | 46 | 7 | 46 |
Figure S34. Get High-res Image Gene #17: 'Del Peak 2(1p32.3) mutation analysis' versus Clinical Feature #7: 'MIRSEQ_CNMF'
P value = 9e-04 (Fisher's exact test), Q value = 0.24
Table S35. Gene #17: 'Del Peak 2(1p32.3) mutation analysis' versus Clinical Feature #8: 'MIRSEQ_CHIERARCHICAL'
| nPatients | CLUS_1 | CLUS_2 | CLUS_3 |
|---|---|---|---|
| ALL | 88 | 13 | 118 |
| DEL PEAK 2(1P32.3) MUTATED | 44 | 3 | 30 |
| DEL PEAK 2(1P32.3) WILD-TYPE | 44 | 10 | 88 |
Figure S35. Get High-res Image Gene #17: 'Del Peak 2(1p32.3) mutation analysis' versus Clinical Feature #8: 'MIRSEQ_CHIERARCHICAL'
P value = 8.8e-06 (Fisher's exact test), Q value = 0.0026
Table S36. Gene #19: 'Del Peak 4(2q37.3) mutation analysis' versus Clinical Feature #4: 'METHLYATION_CNMF'
| nPatients | CLUS_1 | CLUS_2 | CLUS_3 | CLUS_4 |
|---|---|---|---|---|
| ALL | 76 | 31 | 19 | 49 |
| DEL PEAK 4(2Q37.3) MUTATED | 25 | 1 | 1 | 2 |
| DEL PEAK 4(2Q37.3) WILD-TYPE | 51 | 30 | 18 | 47 |
Figure S36. Get High-res Image Gene #19: 'Del Peak 4(2q37.3) mutation analysis' versus Clinical Feature #4: 'METHLYATION_CNMF'
P value = 0.000502 (Fisher's exact test), Q value = 0.14
Table S37. Gene #22: 'Del Peak 7(4q33) mutation analysis' versus Clinical Feature #3: 'CN_CNMF'
| nPatients | CLUS_1 | CLUS_2 | CLUS_3 |
|---|---|---|---|
| ALL | 94 | 50 | 76 |
| DEL PEAK 7(4Q33) MUTATED | 25 | 5 | 31 |
| DEL PEAK 7(4Q33) WILD-TYPE | 69 | 45 | 45 |
Figure S37. Get High-res Image Gene #22: 'Del Peak 7(4q33) mutation analysis' versus Clinical Feature #3: 'CN_CNMF'
P value = 8.18e-05 (Fisher's exact test), Q value = 0.023
Table S38. Gene #23: 'Del Peak 8(4q35.2) mutation analysis' versus Clinical Feature #3: 'CN_CNMF'
| nPatients | CLUS_1 | CLUS_2 | CLUS_3 |
|---|---|---|---|
| ALL | 94 | 50 | 76 |
| DEL PEAK 8(4Q35.2) MUTATED | 26 | 4 | 32 |
| DEL PEAK 8(4Q35.2) WILD-TYPE | 68 | 46 | 44 |
Figure S38. Get High-res Image Gene #23: 'Del Peak 8(4q35.2) mutation analysis' versus Clinical Feature #3: 'CN_CNMF'
P value = 0.000207 (Fisher's exact test), Q value = 0.057
Table S39. Gene #23: 'Del Peak 8(4q35.2) mutation analysis' versus Clinical Feature #4: 'METHLYATION_CNMF'
| nPatients | CLUS_1 | CLUS_2 | CLUS_3 | CLUS_4 |
|---|---|---|---|---|
| ALL | 76 | 31 | 19 | 49 |
| DEL PEAK 8(4Q35.2) MUTATED | 31 | 3 | 2 | 23 |
| DEL PEAK 8(4Q35.2) WILD-TYPE | 45 | 28 | 17 | 26 |
Figure S39. Get High-res Image Gene #23: 'Del Peak 8(4q35.2) mutation analysis' versus Clinical Feature #4: 'METHLYATION_CNMF'

P value = 0.000731 (Fisher's exact test), Q value = 0.19
Table S40. Gene #24: 'Del Peak 9(5q35.2) mutation analysis' versus Clinical Feature #4: 'METHLYATION_CNMF'
| nPatients | CLUS_1 | CLUS_2 | CLUS_3 | CLUS_4 |
|---|---|---|---|---|
| ALL | 76 | 31 | 19 | 49 |
| DEL PEAK 9(5Q35.2) MUTATED | 17 | 5 | 2 | 0 |
| DEL PEAK 9(5Q35.2) WILD-TYPE | 59 | 26 | 17 | 49 |
Figure S40. Get High-res Image Gene #24: 'Del Peak 9(5q35.2) mutation analysis' versus Clinical Feature #4: 'METHLYATION_CNMF'
P value = 2.4e-07 (Fisher's exact test), Q value = 7.1e-05
Table S41. Gene #28: 'Del Peak 13(9p21.3) mutation analysis' versus Clinical Feature #3: 'CN_CNMF'
| nPatients | CLUS_1 | CLUS_2 | CLUS_3 |
|---|---|---|---|
| ALL | 94 | 50 | 76 |
| DEL PEAK 13(9P21.3) MUTATED | 28 | 34 | 16 |
| DEL PEAK 13(9P21.3) WILD-TYPE | 66 | 16 | 60 |
Figure S41. Get High-res Image Gene #28: 'Del Peak 13(9p21.3) mutation analysis' versus Clinical Feature #3: 'CN_CNMF'

P value = 1.3e-05 (Fisher's exact test), Q value = 0.0037
Table S42. Gene #28: 'Del Peak 13(9p21.3) mutation analysis' versus Clinical Feature #4: 'METHLYATION_CNMF'
| nPatients | CLUS_1 | CLUS_2 | CLUS_3 | CLUS_4 |
|---|---|---|---|---|
| ALL | 76 | 31 | 19 | 49 |
| DEL PEAK 13(9P21.3) MUTATED | 33 | 20 | 1 | 11 |
| DEL PEAK 13(9P21.3) WILD-TYPE | 43 | 11 | 18 | 38 |
Figure S42. Get High-res Image Gene #28: 'Del Peak 13(9p21.3) mutation analysis' versus Clinical Feature #4: 'METHLYATION_CNMF'

P value = 1.05e-17 (Fisher's exact test), Q value = 3.3e-15
Table S43. Gene #29: 'Del Peak 14(10q26.2) mutation analysis' versus Clinical Feature #3: 'CN_CNMF'
| nPatients | CLUS_1 | CLUS_2 | CLUS_3 |
|---|---|---|---|
| ALL | 94 | 50 | 76 |
| DEL PEAK 14(10Q26.2) MUTATED | 27 | 39 | 4 |
| DEL PEAK 14(10Q26.2) WILD-TYPE | 67 | 11 | 72 |
Figure S43. Get High-res Image Gene #29: 'Del Peak 14(10q26.2) mutation analysis' versus Clinical Feature #3: 'CN_CNMF'
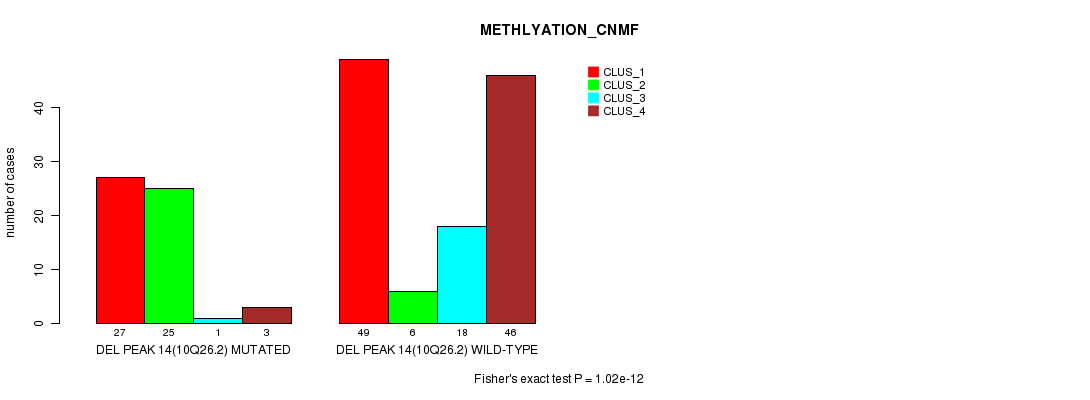
P value = 1.02e-12 (Fisher's exact test), Q value = 3.2e-10
Table S44. Gene #29: 'Del Peak 14(10q26.2) mutation analysis' versus Clinical Feature #4: 'METHLYATION_CNMF'
| nPatients | CLUS_1 | CLUS_2 | CLUS_3 | CLUS_4 |
|---|---|---|---|---|
| ALL | 76 | 31 | 19 | 49 |
| DEL PEAK 14(10Q26.2) MUTATED | 27 | 25 | 1 | 3 |
| DEL PEAK 14(10Q26.2) WILD-TYPE | 49 | 6 | 18 | 46 |
Figure S44. Get High-res Image Gene #29: 'Del Peak 14(10q26.2) mutation analysis' versus Clinical Feature #4: 'METHLYATION_CNMF'
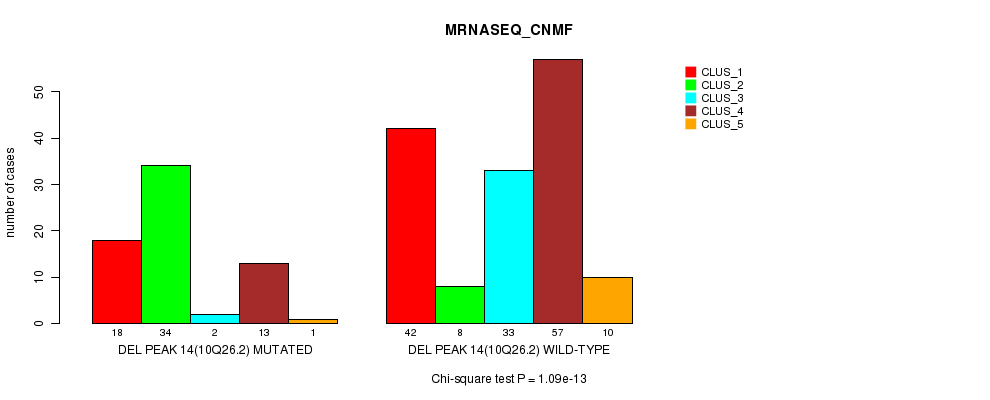
P value = 1.09e-13 (Chi-square test), Q value = 3.4e-11
Table S45. Gene #29: 'Del Peak 14(10q26.2) mutation analysis' versus Clinical Feature #5: 'MRNASEQ_CNMF'
| nPatients | CLUS_1 | CLUS_2 | CLUS_3 | CLUS_4 | CLUS_5 |
|---|---|---|---|---|---|
| ALL | 60 | 42 | 35 | 70 | 11 |
| DEL PEAK 14(10Q26.2) MUTATED | 18 | 34 | 2 | 13 | 1 |
| DEL PEAK 14(10Q26.2) WILD-TYPE | 42 | 8 | 33 | 57 | 10 |
Figure S45. Get High-res Image Gene #29: 'Del Peak 14(10q26.2) mutation analysis' versus Clinical Feature #5: 'MRNASEQ_CNMF'
P value = 2.8e-08 (Fisher's exact test), Q value = 8.4e-06
Table S46. Gene #29: 'Del Peak 14(10q26.2) mutation analysis' versus Clinical Feature #6: 'MRNASEQ_CHIERARCHICAL'
| nPatients | CLUS_1 | CLUS_2 | CLUS_3 |
|---|---|---|---|
| ALL | 32 | 117 | 69 |
| DEL PEAK 14(10Q26.2) MUTATED | 1 | 55 | 12 |
| DEL PEAK 14(10Q26.2) WILD-TYPE | 31 | 62 | 57 |
Figure S46. Get High-res Image Gene #29: 'Del Peak 14(10q26.2) mutation analysis' versus Clinical Feature #6: 'MRNASEQ_CHIERARCHICAL'

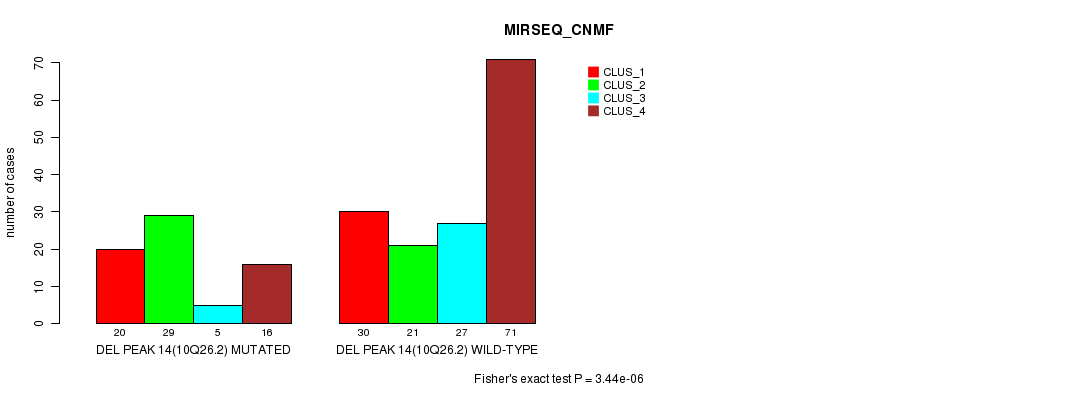
P value = 3.44e-06 (Fisher's exact test), Q value = 0.001
Table S47. Gene #29: 'Del Peak 14(10q26.2) mutation analysis' versus Clinical Feature #7: 'MIRSEQ_CNMF'
| nPatients | CLUS_1 | CLUS_2 | CLUS_3 | CLUS_4 |
|---|---|---|---|---|
| ALL | 50 | 50 | 32 | 87 |
| DEL PEAK 14(10Q26.2) MUTATED | 20 | 29 | 5 | 16 |
| DEL PEAK 14(10Q26.2) WILD-TYPE | 30 | 21 | 27 | 71 |
Figure S47. Get High-res Image Gene #29: 'Del Peak 14(10q26.2) mutation analysis' versus Clinical Feature #7: 'MIRSEQ_CNMF'
P value = 0.000724 (Fisher's exact test), Q value = 0.19
Table S48. Gene #29: 'Del Peak 14(10q26.2) mutation analysis' versus Clinical Feature #8: 'MIRSEQ_CHIERARCHICAL'
| nPatients | CLUS_1 | CLUS_2 | CLUS_3 |
|---|---|---|---|
| ALL | 88 | 13 | 118 |
| DEL PEAK 14(10Q26.2) MUTATED | 16 | 4 | 50 |
| DEL PEAK 14(10Q26.2) WILD-TYPE | 72 | 9 | 68 |
Figure S48. Get High-res Image Gene #29: 'Del Peak 14(10q26.2) mutation analysis' versus Clinical Feature #8: 'MIRSEQ_CHIERARCHICAL'
P value = 1.98e-07 (Fisher's exact test), Q value = 5.9e-05
Table S49. Gene #30: 'Del Peak 15(11p15.5) mutation analysis' versus Clinical Feature #3: 'CN_CNMF'
| nPatients | CLUS_1 | CLUS_2 | CLUS_3 |
|---|---|---|---|
| ALL | 94 | 50 | 76 |
| DEL PEAK 15(11P15.5) MUTATED | 35 | 10 | 3 |
| DEL PEAK 15(11P15.5) WILD-TYPE | 59 | 40 | 73 |
Figure S49. Get High-res Image Gene #30: 'Del Peak 15(11p15.5) mutation analysis' versus Clinical Feature #3: 'CN_CNMF'

P value = 9.49e-08 (Fisher's exact test), Q value = 2.8e-05
Table S50. Gene #30: 'Del Peak 15(11p15.5) mutation analysis' versus Clinical Feature #4: 'METHLYATION_CNMF'
| nPatients | CLUS_1 | CLUS_2 | CLUS_3 | CLUS_4 |
|---|---|---|---|---|
| ALL | 76 | 31 | 19 | 49 |
| DEL PEAK 15(11P15.5) MUTATED | 30 | 4 | 4 | 0 |
| DEL PEAK 15(11P15.5) WILD-TYPE | 46 | 27 | 15 | 49 |
Figure S50. Get High-res Image Gene #30: 'Del Peak 15(11p15.5) mutation analysis' versus Clinical Feature #4: 'METHLYATION_CNMF'
P value = 0.000283 (Fisher's exact test), Q value = 0.078
Table S51. Gene #30: 'Del Peak 15(11p15.5) mutation analysis' versus Clinical Feature #6: 'MRNASEQ_CHIERARCHICAL'
| nPatients | CLUS_1 | CLUS_2 | CLUS_3 |
|---|---|---|---|
| ALL | 32 | 117 | 69 |
| DEL PEAK 15(11P15.5) MUTATED | 0 | 34 | 13 |
| DEL PEAK 15(11P15.5) WILD-TYPE | 32 | 83 | 56 |
Figure S51. Get High-res Image Gene #30: 'Del Peak 15(11p15.5) mutation analysis' versus Clinical Feature #6: 'MRNASEQ_CHIERARCHICAL'
P value = 4.97e-05 (Fisher's exact test), Q value = 0.014
Table S52. Gene #32: 'Del Peak 17(12q24.11) mutation analysis' versus Clinical Feature #3: 'CN_CNMF'
| nPatients | CLUS_1 | CLUS_2 | CLUS_3 |
|---|---|---|---|
| ALL | 94 | 50 | 76 |
| DEL PEAK 17(12Q24.11) MUTATED | 24 | 3 | 3 |
| DEL PEAK 17(12Q24.11) WILD-TYPE | 70 | 47 | 73 |
Figure S52. Get High-res Image Gene #32: 'Del Peak 17(12q24.11) mutation analysis' versus Clinical Feature #3: 'CN_CNMF'
P value = 2.83e-05 (Fisher's exact test), Q value = 0.008
Table S53. Gene #32: 'Del Peak 17(12q24.11) mutation analysis' versus Clinical Feature #4: 'METHLYATION_CNMF'
| nPatients | CLUS_1 | CLUS_2 | CLUS_3 | CLUS_4 |
|---|---|---|---|---|
| ALL | 76 | 31 | 19 | 49 |
| DEL PEAK 17(12Q24.11) MUTATED | 20 | 0 | 2 | 1 |
| DEL PEAK 17(12Q24.11) WILD-TYPE | 56 | 31 | 17 | 48 |
Figure S53. Get High-res Image Gene #32: 'Del Peak 17(12q24.11) mutation analysis' versus Clinical Feature #4: 'METHLYATION_CNMF'
P value = 4.4e-29 (Fisher's exact test), Q value = 1.4e-26
Table S54. Gene #40: 'Del Peak 25(19q13.42) mutation analysis' versus Clinical Feature #3: 'CN_CNMF'
| nPatients | CLUS_1 | CLUS_2 | CLUS_3 |
|---|---|---|---|
| ALL | 94 | 50 | 76 |
| DEL PEAK 25(19Q13.42) MUTATED | 26 | 14 | 76 |
| DEL PEAK 25(19Q13.42) WILD-TYPE | 68 | 36 | 0 |
Figure S54. Get High-res Image Gene #40: 'Del Peak 25(19q13.42) mutation analysis' versus Clinical Feature #3: 'CN_CNMF'
P value = 8.5e-20 (Fisher's exact test), Q value = 2.7e-17
Table S55. Gene #40: 'Del Peak 25(19q13.42) mutation analysis' versus Clinical Feature #4: 'METHLYATION_CNMF'
| nPatients | CLUS_1 | CLUS_2 | CLUS_3 | CLUS_4 |
|---|---|---|---|---|
| ALL | 76 | 31 | 19 | 49 |
| DEL PEAK 25(19Q13.42) MUTATED | 37 | 2 | 9 | 49 |
| DEL PEAK 25(19Q13.42) WILD-TYPE | 39 | 29 | 10 | 0 |
Figure S55. Get High-res Image Gene #40: 'Del Peak 25(19q13.42) mutation analysis' versus Clinical Feature #4: 'METHLYATION_CNMF'
P value = 4.81e-11 (Chi-square test), Q value = 1.5e-08
Table S56. Gene #40: 'Del Peak 25(19q13.42) mutation analysis' versus Clinical Feature #5: 'MRNASEQ_CNMF'
| nPatients | CLUS_1 | CLUS_2 | CLUS_3 | CLUS_4 | CLUS_5 |
|---|---|---|---|---|---|
| ALL | 60 | 42 | 35 | 70 | 11 |
| DEL PEAK 25(19Q13.42) MUTATED | 24 | 9 | 35 | 43 | 5 |
| DEL PEAK 25(19Q13.42) WILD-TYPE | 36 | 33 | 0 | 27 | 6 |
Figure S56. Get High-res Image Gene #40: 'Del Peak 25(19q13.42) mutation analysis' versus Clinical Feature #5: 'MRNASEQ_CNMF'
P value = 3.35e-12 (Fisher's exact test), Q value = 1e-09
Table S57. Gene #40: 'Del Peak 25(19q13.42) mutation analysis' versus Clinical Feature #6: 'MRNASEQ_CHIERARCHICAL'
| nPatients | CLUS_1 | CLUS_2 | CLUS_3 |
|---|---|---|---|
| ALL | 32 | 117 | 69 |
| DEL PEAK 25(19Q13.42) MUTATED | 32 | 42 | 42 |
| DEL PEAK 25(19Q13.42) WILD-TYPE | 0 | 75 | 27 |
Figure S57. Get High-res Image Gene #40: 'Del Peak 25(19q13.42) mutation analysis' versus Clinical Feature #6: 'MRNASEQ_CHIERARCHICAL'

P value = 6.67e-10 (Fisher's exact test), Q value = 2e-07
Table S58. Gene #40: 'Del Peak 25(19q13.42) mutation analysis' versus Clinical Feature #7: 'MIRSEQ_CNMF'
| nPatients | CLUS_1 | CLUS_2 | CLUS_3 | CLUS_4 |
|---|---|---|---|---|
| ALL | 50 | 50 | 32 | 87 |
| DEL PEAK 25(19Q13.42) MUTATED | 22 | 12 | 30 | 52 |
| DEL PEAK 25(19Q13.42) WILD-TYPE | 28 | 38 | 2 | 35 |
Figure S58. Get High-res Image Gene #40: 'Del Peak 25(19q13.42) mutation analysis' versus Clinical Feature #7: 'MIRSEQ_CNMF'

P value = 2.21e-06 (Fisher's exact test), Q value = 0.00065
Table S59. Gene #41: 'Del Peak 26(22q13.31) mutation analysis' versus Clinical Feature #3: 'CN_CNMF'
| nPatients | CLUS_1 | CLUS_2 | CLUS_3 |
|---|---|---|---|
| ALL | 94 | 50 | 76 |
| DEL PEAK 26(22Q13.31) MUTATED | 14 | 16 | 1 |
| DEL PEAK 26(22Q13.31) WILD-TYPE | 80 | 34 | 75 |
Figure S59. Get High-res Image Gene #41: 'Del Peak 26(22q13.31) mutation analysis' versus Clinical Feature #3: 'CN_CNMF'

P value = 2.54e-05 (Fisher's exact test), Q value = 0.0072
Table S60. Gene #41: 'Del Peak 26(22q13.31) mutation analysis' versus Clinical Feature #4: 'METHLYATION_CNMF'
| nPatients | CLUS_1 | CLUS_2 | CLUS_3 | CLUS_4 |
|---|---|---|---|---|
| ALL | 76 | 31 | 19 | 49 |
| DEL PEAK 26(22Q13.31) MUTATED | 17 | 10 | 1 | 0 |
| DEL PEAK 26(22Q13.31) WILD-TYPE | 59 | 21 | 18 | 49 |
Figure S60. Get High-res Image Gene #41: 'Del Peak 26(22q13.31) mutation analysis' versus Clinical Feature #4: 'METHLYATION_CNMF'
P value = 4.5e-05 (Chi-square test), Q value = 0.013
Table S61. Gene #41: 'Del Peak 26(22q13.31) mutation analysis' versus Clinical Feature #5: 'MRNASEQ_CNMF'
| nPatients | CLUS_1 | CLUS_2 | CLUS_3 | CLUS_4 | CLUS_5 |
|---|---|---|---|---|---|
| ALL | 60 | 42 | 35 | 70 | 11 |
| DEL PEAK 26(22Q13.31) MUTATED | 8 | 15 | 0 | 7 | 0 |
| DEL PEAK 26(22Q13.31) WILD-TYPE | 52 | 27 | 35 | 63 | 11 |
Figure S61. Get High-res Image Gene #41: 'Del Peak 26(22q13.31) mutation analysis' versus Clinical Feature #5: 'MRNASEQ_CNMF'
P value = 0.000193 (Fisher's exact test), Q value = 0.054
Table S62. Gene #43: 'Del Peak 28(Xq21.1) mutation analysis' versus Clinical Feature #7: 'MIRSEQ_CNMF'
| nPatients | CLUS_1 | CLUS_2 | CLUS_3 | CLUS_4 |
|---|---|---|---|---|
| ALL | 50 | 50 | 32 | 87 |
| DEL PEAK 28(XQ21.1) MUTATED | 3 | 9 | 12 | 6 |
| DEL PEAK 28(XQ21.1) WILD-TYPE | 47 | 41 | 20 | 81 |
Figure S62. Get High-res Image Gene #43: 'Del Peak 28(Xq21.1) mutation analysis' versus Clinical Feature #7: 'MIRSEQ_CNMF'
-
Copy number data file = All Lesions File (all_lesions.conf_##.txt, where ## is the confidence level). The all lesions file is from GISTIC pipeline and summarizes the results from the GISTIC run. It contains data about the significant regions of amplification and deletion as well as which samples are amplified or deleted in each of these regions. The identified regions are listed down the first column, and the samples are listed across the first row, starting in column 10.
-
Molecular subtype file = LGG-TP.transferedmergedcluster.txt
-
Number of patients = 220
-
Number of copy number variation regions = 43
-
Number of molecular subtypes = 8
-
Exclude regions that fewer than K tumors have alterations, K = 3
For binary or multi-class clinical features (nominal or ordinal), two-tailed Fisher's exact tests (Fisher 1922) were used to estimate the P values using the 'fisher.test' function in R
For multi-class clinical features (nominal or ordinal), Chi-square tests (Greenwood and Nikulin 1996) were used to estimate the P values using the 'chisq.test' function in R
For multiple hypothesis correction, Q value is the False Discovery Rate (FDR) analogue of the P value (Benjamini and Hochberg 1995), defined as the minimum FDR at which the test may be called significant. We used the 'Benjamini and Hochberg' method of 'p.adjust' function in R to convert P values into Q values.
This is an experimental feature. The full results of the analysis summarized in this report can be downloaded from the TCGA Data Coordination Center.