This pipeline uses various statistical tests to identify genes whose promoter methylation levels correlated to selected clinical features.
Testing the association between 16950 genes and 7 clinical features across 30 samples, statistically thresholded by Q value < 0.05, 4 clinical features related to at least one genes.
-
1 gene correlated to 'AGE'.
-
HGF
-
7 genes correlated to 'DISTANT.METASTASIS'.
-
SCYL3 , C5ORF42 , ZNF540 , GOLGA7 , TBC1D15 , ...
-
8 genes correlated to 'COMPLETENESS.OF.RESECTION'.
-
SCYL3 , C5ORF42 , ZNF540 , PRPF39 , TBC1D15 , ...
-
62 genes correlated to 'NEOPLASM.DISEASESTAGE'.
-
C3ORF31 , DGCR5 , SP110 , EFR3B , DDX60L , ...
-
No genes correlated to 'Time to Death', 'GENDER', and 'LYMPH.NODE.METASTASIS'.
Complete statistical result table is provided in Supplement Table 1
Table 1. Get Full Table This table shows the clinical features, statistical methods used, and the number of genes that are significantly associated with each clinical feature at Q value < 0.05.
| Clinical feature | Statistical test | Significant genes | Associated with | Associated with | ||
|---|---|---|---|---|---|---|
| Time to Death | Cox regression test | N=0 | ||||
| AGE | Spearman correlation test | N=1 | older | N=0 | younger | N=1 |
| GENDER | t test | N=0 | ||||
| DISTANT METASTASIS | ANOVA test | N=7 | ||||
| LYMPH NODE METASTASIS | t test | N=0 | ||||
| COMPLETENESS OF RESECTION | ANOVA test | N=8 | ||||
| NEOPLASM DISEASESTAGE | ANOVA test | N=62 |
Table S1. Basic characteristics of clinical feature: 'Time to Death'
| Time to Death | Duration (Months) | 0.1-83.6 (median=16.7) |
| censored | N = 11 | |
| death | N = 15 | |
| Significant markers | N = 0 |
Table S2. Basic characteristics of clinical feature: 'AGE'
| AGE | Mean (SD) | 57.89 (18) |
| Significant markers | N = 1 | |
| pos. correlated | 0 | |
| neg. correlated | 1 |
Table S3. Get Full Table List of one gene significantly correlated to 'AGE' by Spearman correlation test
| SpearmanCorr | corrP | Q | |
|---|---|---|---|
| HGF | -0.7726 | 2.337e-06 | 0.0396 |
Figure S1. Get High-res Image As an example, this figure shows the association of HGF to 'AGE'. P value = 2.34e-06 with Spearman correlation analysis. The straight line presents the best linear regression.

Table S4. Basic characteristics of clinical feature: 'GENDER'
| GENDER | Labels | N |
| FEMALE | 8 | |
| MALE | 22 | |
| Significant markers | N = 0 |
Table S5. Basic characteristics of clinical feature: 'DISTANT.METASTASIS'
| DISTANT.METASTASIS | Labels | N |
| M0 | 21 | |
| M1 | 1 | |
| MX | 8 | |
| Significant markers | N = 7 |
Table S6. Get Full Table List of 7 genes differentially expressed by 'DISTANT.METASTASIS'
| ANOVA_P | Q | |
|---|---|---|
| SCYL3 | 1.662e-19 | 2.82e-15 |
| C5ORF42 | 9.327e-15 | 1.58e-10 |
| ZNF540 | 6.979e-10 | 1.18e-05 |
| GOLGA7 | 2.051e-08 | 0.000348 |
| TBC1D15 | 4.501e-08 | 0.000763 |
| MRPL11 | 1.356e-07 | 0.0023 |
| NPIPL3 | 7.932e-07 | 0.0134 |
Figure S2. Get High-res Image As an example, this figure shows the association of SCYL3 to 'DISTANT.METASTASIS'. P value = 1.66e-19 with ANOVA analysis.
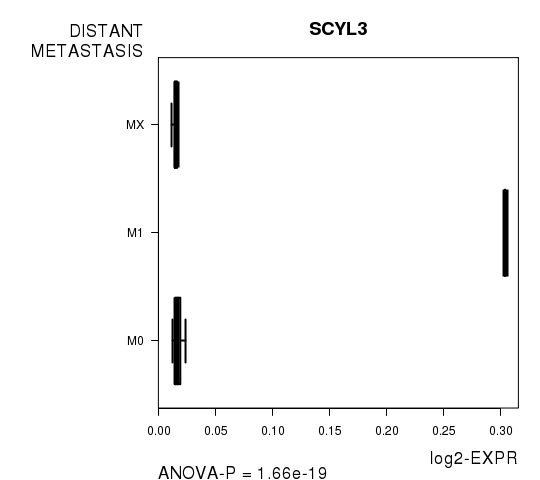
Table S7. Basic characteristics of clinical feature: 'LYMPH.NODE.METASTASIS'
| LYMPH.NODE.METASTASIS | Labels | N |
| N0 | 22 | |
| NX | 7 | |
| Significant markers | N = 0 |
Table S8. Basic characteristics of clinical feature: 'COMPLETENESS.OF.RESECTION'
| COMPLETENESS.OF.RESECTION | Labels | N |
| R0 | 18 | |
| R1 | 3 | |
| R2 | 1 | |
| RX | 6 | |
| Significant markers | N = 8 |
Table S9. Get Full Table List of 8 genes differentially expressed by 'COMPLETENESS.OF.RESECTION'
| ANOVA_P | Q | |
|---|---|---|
| SCYL3 | 8.427e-17 | 1.43e-12 |
| C5ORF42 | 6.407e-13 | 1.09e-08 |
| ZNF540 | 3.613e-10 | 6.12e-06 |
| PRPF39 | 2.311e-07 | 0.00392 |
| TBC1D15 | 3.215e-07 | 0.00545 |
| GOLGA7 | 4.365e-07 | 0.0074 |
| LSR | 1.293e-06 | 0.0219 |
| MRPL11 | 2.865e-06 | 0.0485 |
Figure S3. Get High-res Image As an example, this figure shows the association of SCYL3 to 'COMPLETENESS.OF.RESECTION'. P value = 8.43e-17 with ANOVA analysis.

Table S10. Basic characteristics of clinical feature: 'NEOPLASM.DISEASESTAGE'
| NEOPLASM.DISEASESTAGE | Labels | N |
| STAGE I | 10 | |
| STAGE II | 5 | |
| STAGE III | 2 | |
| STAGE IIIA | 5 | |
| STAGE IIIB | 1 | |
| STAGE IVB | 1 | |
| Significant markers | N = 62 |
Table S11. Get Full Table List of top 10 genes differentially expressed by 'NEOPLASM.DISEASESTAGE'
| ANOVA_P | Q | |
|---|---|---|
| C3ORF31 | 4.694e-21 | 7.96e-17 |
| DGCR5 | 4.999e-21 | 8.47e-17 |
| SP110 | 2.135e-20 | 3.62e-16 |
| EFR3B | 5.112e-19 | 8.66e-15 |
| DDX60L | 1.029e-18 | 1.74e-14 |
| COPB1 | 5.776e-18 | 9.79e-14 |
| PNRC1 | 3.155e-17 | 5.35e-13 |
| TRIM5 | 1.279e-16 | 2.17e-12 |
| TLR3 | 3.268e-16 | 5.54e-12 |
| UFD1L | 2.856e-14 | 4.84e-10 |
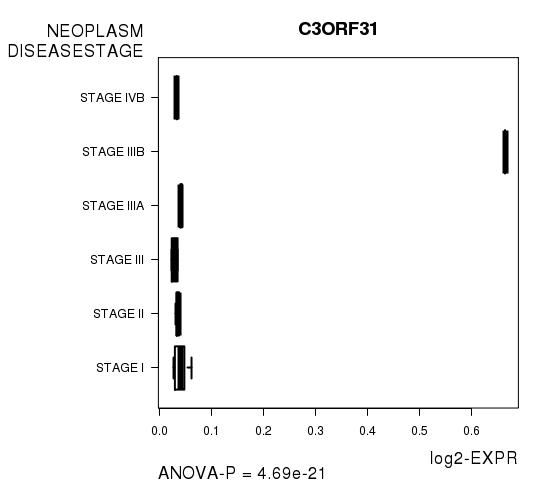
Figure S4. Get High-res Image As an example, this figure shows the association of C3ORF31 to 'NEOPLASM.DISEASESTAGE'. P value = 4.69e-21 with ANOVA analysis.
-
Expresson data file = LIHC-TP.meth.for_correlation.filtered_data.txt
-
Clinical data file = LIHC-TP.clin.merged.picked.txt
-
Number of patients = 30
-
Number of genes = 16950
-
Number of clinical features = 7
For survival clinical features, Wald's test in univariate Cox regression analysis with proportional hazards model (Andersen and Gill 1982) was used to estimate the P values using the 'coxph' function in R. Kaplan-Meier survival curves were plot using the four quartile subgroups of patients based on expression levels
For continuous numerical clinical features, Spearman's rank correlation coefficients (Spearman 1904) and two-tailed P values were estimated using 'cor.test' function in R
For two-class clinical features, two-tailed Student's t test with unequal variance (Lehmann and Romano 2005) was applied to compare the log2-expression levels between the two clinical classes using 't.test' function in R
For multi-class clinical features (ordinal or nominal), one-way analysis of variance (Howell 2002) was applied to compare the log2-expression levels between different clinical classes using 'anova' function in R
For multiple hypothesis correction, Q value is the False Discovery Rate (FDR) analogue of the P value (Benjamini and Hochberg 1995), defined as the minimum FDR at which the test may be called significant. We used the 'Benjamini and Hochberg' method of 'p.adjust' function in R to convert P values into Q values.
This is an experimental feature. The full results of the analysis summarized in this report can be downloaded from the TCGA Data Coordination Center.