This pipeline uses various statistical tests to identify mRNAs whose expression levels correlated to selected clinical features.
Testing the association between 17911 genes and 7 clinical features across 33 samples, statistically thresholded by Q value < 0.05, 5 clinical features related to at least one genes.
-
1 gene correlated to 'AGE'.
-
KRT6B|3854
-
5 genes correlated to 'GENDER'.
-
EDA|1896 , PPARGC1A|10891 , NLGN4Y|22829 , PRKY|5616 , TMED4|222068
-
3 genes correlated to 'DISTANT.METASTASIS'.
-
ZNF689|115509 , MARCH8|220972 , TNPO3|23534
-
6 genes correlated to 'COMPLETENESS.OF.RESECTION'.
-
MARCH8|220972 , ZNF689|115509 , TNPO3|23534 , MAPK8|5599 , MGRN1|23295 , ...
-
3 genes correlated to 'NEOPLASM.DISEASESTAGE'.
-
L3MBTL4|91133 , MARCH8|220972 , THNSL2|55258
-
No genes correlated to 'Time to Death', and 'LYMPH.NODE.METASTASIS'.
Complete statistical result table is provided in Supplement Table 1
Table 1. Get Full Table This table shows the clinical features, statistical methods used, and the number of genes that are significantly associated with each clinical feature at Q value < 0.05.
| Clinical feature | Statistical test | Significant genes | Associated with | Associated with | ||
|---|---|---|---|---|---|---|
| Time to Death | Cox regression test | N=0 | ||||
| AGE | Spearman correlation test | N=1 | older | N=1 | younger | N=0 |
| GENDER | t test | N=5 | male | N=2 | female | N=3 |
| DISTANT METASTASIS | ANOVA test | N=3 | ||||
| LYMPH NODE METASTASIS | t test | N=0 | ||||
| COMPLETENESS OF RESECTION | ANOVA test | N=6 | ||||
| NEOPLASM DISEASESTAGE | ANOVA test | N=3 |
Table S1. Basic characteristics of clinical feature: 'Time to Death'
| Time to Death | Duration (Months) | 0.1-83.6 (median=19.8) |
| censored | N = 12 | |
| death | N = 17 | |
| Significant markers | N = 0 |
Table S2. Basic characteristics of clinical feature: 'AGE'
| AGE | Mean (SD) | 59.4 (18) |
| Significant markers | N = 1 | |
| pos. correlated | 1 | |
| neg. correlated | 0 |
Table S3. Get Full Table List of one gene significantly correlated to 'AGE' by Spearman correlation test
| SpearmanCorr | corrP | Q | |
|---|---|---|---|
| KRT6B|3854 | 0.95 | 0 | 0 |
Figure S1. Get High-res Image As an example, this figure shows the association of KRT6B|3854 to 'AGE'. P value = 0 with Spearman correlation analysis. The straight line presents the best linear regression.
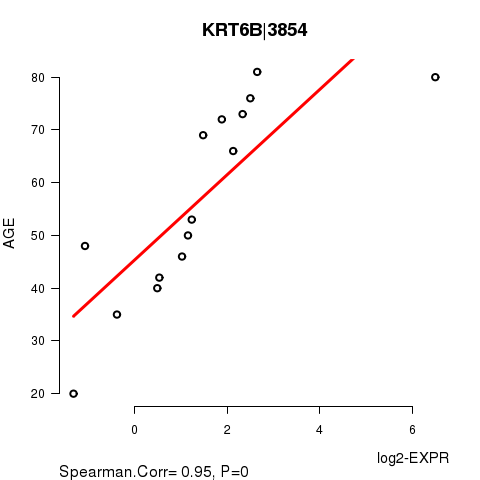
Table S4. Basic characteristics of clinical feature: 'GENDER'
| GENDER | Labels | N |
| FEMALE | 10 | |
| MALE | 23 | |
| Significant markers | N = 5 | |
| Higher in MALE | 2 | |
| Higher in FEMALE | 3 |
Table S5. Get Full Table List of 5 genes differentially expressed by 'GENDER'
| T(pos if higher in 'MALE') | ttestP | Q | AUC | |
|---|---|---|---|---|
| EDA|1896 | -6.98 | 8.388e-08 | 0.00149 | 0.9565 |
| PPARGC1A|10891 | -6.39 | 4.098e-07 | 0.00726 | 0.9522 |
| NLGN4Y|22829 | 11.05 | 9.292e-07 | 0.0165 | 1 |
| PRKY|5616 | 14.16 | 1.216e-06 | 0.0215 | 1 |
| TMED4|222068 | -5.82 | 2.59e-06 | 0.0459 | 0.9478 |
Figure S2. Get High-res Image As an example, this figure shows the association of EDA|1896 to 'GENDER'. P value = 8.39e-08 with T-test analysis.

Table S6. Basic characteristics of clinical feature: 'DISTANT.METASTASIS'
| DISTANT.METASTASIS | Labels | N |
| M0 | 22 | |
| M1 | 1 | |
| MX | 10 | |
| Significant markers | N = 3 |
Table S7. Get Full Table List of 3 genes differentially expressed by 'DISTANT.METASTASIS'
| ANOVA_P | Q | |
|---|---|---|
| ZNF689|115509 | 6.031e-09 | 0.000108 |
| MARCH8|220972 | 9.157e-08 | 0.00164 |
| TNPO3|23534 | 2.08e-07 | 0.00373 |
Figure S3. Get High-res Image As an example, this figure shows the association of ZNF689|115509 to 'DISTANT.METASTASIS'. P value = 6.03e-09 with ANOVA analysis.

Table S8. Basic characteristics of clinical feature: 'LYMPH.NODE.METASTASIS'
| LYMPH.NODE.METASTASIS | Labels | N |
| N0 | 24 | |
| NX | 8 | |
| Significant markers | N = 0 |
Table S9. Basic characteristics of clinical feature: 'COMPLETENESS.OF.RESECTION'
| COMPLETENESS.OF.RESECTION | Labels | N |
| R0 | 18 | |
| R1 | 6 | |
| R2 | 1 | |
| RX | 6 | |
| Significant markers | N = 6 |
Table S10. Get Full Table List of 6 genes differentially expressed by 'COMPLETENESS.OF.RESECTION'
| ANOVA_P | Q | |
|---|---|---|
| MARCH8|220972 | 3.319e-08 | 0.000594 |
| ZNF689|115509 | 8.656e-08 | 0.00155 |
| TNPO3|23534 | 2.004e-07 | 0.00359 |
| MAPK8|5599 | 7.24e-07 | 0.013 |
| MGRN1|23295 | 1.454e-06 | 0.026 |
| AP2A1|160 | 2.778e-06 | 0.0497 |
Figure S4. Get High-res Image As an example, this figure shows the association of MARCH8|220972 to 'COMPLETENESS.OF.RESECTION'. P value = 3.32e-08 with ANOVA analysis.

Table S11. Basic characteristics of clinical feature: 'NEOPLASM.DISEASESTAGE'
| NEOPLASM.DISEASESTAGE | Labels | N |
| STAGE I | 10 | |
| STAGE II | 5 | |
| STAGE III | 2 | |
| STAGE IIIA | 7 | |
| STAGE IIIB | 1 | |
| STAGE IVB | 1 | |
| Significant markers | N = 3 |
Table S12. Get Full Table List of 3 genes differentially expressed by 'NEOPLASM.DISEASESTAGE'
| ANOVA_P | Q | |
|---|---|---|
| L3MBTL4|91133 | 6.568e-07 | 0.0118 |
| MARCH8|220972 | 1.672e-06 | 0.0299 |
| THNSL2|55258 | 1.776e-06 | 0.0318 |
Figure S5. Get High-res Image As an example, this figure shows the association of L3MBTL4|91133 to 'NEOPLASM.DISEASESTAGE'. P value = 6.57e-07 with ANOVA analysis.

-
Expresson data file = LIHC-TP.uncv2.mRNAseq_RSEM_normalized_log2.txt
-
Clinical data file = LIHC-TP.clin.merged.picked.txt
-
Number of patients = 33
-
Number of genes = 17911
-
Number of clinical features = 7
For survival clinical features, Wald's test in univariate Cox regression analysis with proportional hazards model (Andersen and Gill 1982) was used to estimate the P values using the 'coxph' function in R. Kaplan-Meier survival curves were plot using the four quartile subgroups of patients based on expression levels
For continuous numerical clinical features, Spearman's rank correlation coefficients (Spearman 1904) and two-tailed P values were estimated using 'cor.test' function in R
For two-class clinical features, two-tailed Student's t test with unequal variance (Lehmann and Romano 2005) was applied to compare the log2-expression levels between the two clinical classes using 't.test' function in R
For multi-class clinical features (ordinal or nominal), one-way analysis of variance (Howell 2002) was applied to compare the log2-expression levels between different clinical classes using 'anova' function in R
For multiple hypothesis correction, Q value is the False Discovery Rate (FDR) analogue of the P value (Benjamini and Hochberg 1995), defined as the minimum FDR at which the test may be called significant. We used the 'Benjamini and Hochberg' method of 'p.adjust' function in R to convert P values into Q values.
This is an experimental feature. The full results of the analysis summarized in this report can be downloaded from the TCGA Data Coordination Center.