This pipeline computes the correlation between significant arm-level copy number variations (cnvs) and subtypes.
Testing the association between copy number variation 71 arm-level results and 6 molecular subtypes across 97 patients, 3 significant findings detected with Q value < 0.25.
-
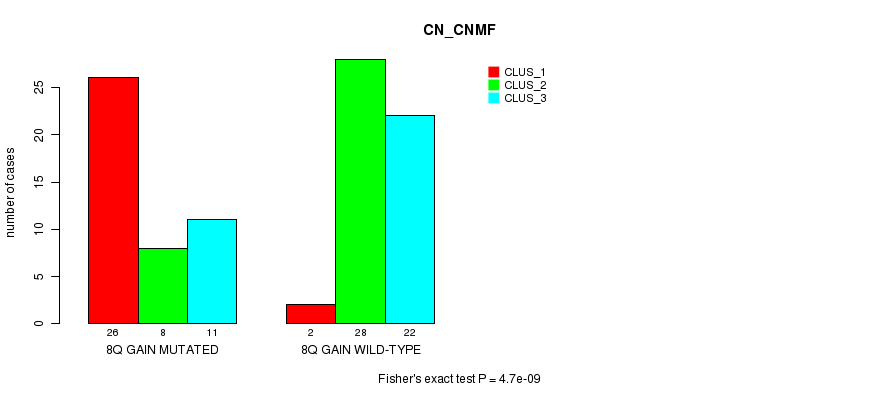
8q gain cnv correlated to 'CN_CNMF'.
-
19q gain cnv correlated to 'MRNASEQ_CHIERARCHICAL'.
-
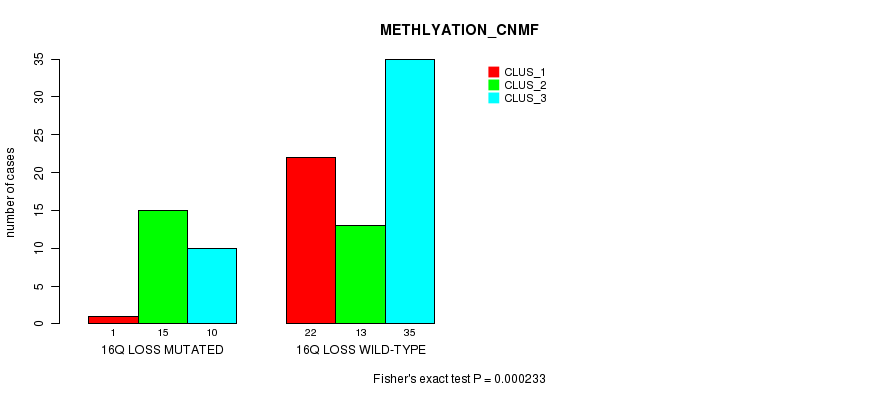
16q loss cnv correlated to 'METHLYATION_CNMF'.
Table 1. Get Full Table Overview of the association between significant copy number variation of 71 arm-level results and 6 molecular subtypes. Shown in the table are P values (Q values). Thresholded by Q value < 0.25, 3 significant findings detected.
|
Molecular subtypes |
CN CNMF |
METHLYATION CNMF |
MRNASEQ CNMF |
MRNASEQ CHIERARCHICAL |
MIRSEQ CNMF |
MIRSEQ CHIERARCHICAL |
||
| nCNV (%) | nWild-Type | Fisher's exact test | Fisher's exact test | Fisher's exact test | Fisher's exact test | Fisher's exact test | Fisher's exact test | |
| 8q gain | 45 (46%) | 52 |
4.7e-09 (1.86e-06) |
0.75 (1.00) |
1 (1.00) |
0.807 (1.00) |
0.287 (1.00) |
0.302 (1.00) |
| 19q gain | 10 (10%) | 87 |
0.489 (1.00) |
0.00543 (1.00) |
0.0445 (1.00) |
0.000615 (0.242) |
0.242 (1.00) |
0.395 (1.00) |
| 16q loss | 27 (28%) | 70 |
0.00429 (1.00) |
0.000233 (0.0919) |
0.708 (1.00) |
0.529 (1.00) |
0.0707 (1.00) |
0.00246 (0.959) |
| 1p gain | 10 (10%) | 87 |
0.54 (1.00) |
0.392 (1.00) |
1 (1.00) |
0.677 (1.00) |
0.611 (1.00) |
0.558 (1.00) |
| 1q gain | 51 (53%) | 46 |
0.00386 (1.00) |
0.0464 (1.00) |
0.732 (1.00) |
0.312 (1.00) |
0.463 (1.00) |
0.625 (1.00) |
| 2p gain | 8 (8%) | 89 |
0.586 (1.00) |
0.137 (1.00) |
0.601 (1.00) |
0.484 (1.00) |
0.0104 (1.00) |
0.793 (1.00) |
| 2q gain | 7 (7%) | 90 |
0.618 (1.00) |
0.0561 (1.00) |
0.227 (1.00) |
0.156 (1.00) |
0.0228 (1.00) |
0.84 (1.00) |
| 3p gain | 7 (7%) | 90 |
0.377 (1.00) |
0.758 (1.00) |
1 (1.00) |
0.272 (1.00) |
0.714 (1.00) |
|
| 3q gain | 7 (7%) | 90 |
0.377 (1.00) |
0.758 (1.00) |
1 (1.00) |
0.272 (1.00) |
0.714 (1.00) |
|
| 4p gain | 6 (6%) | 91 |
0.766 (1.00) |
0.101 (1.00) |
0.103 (1.00) |
0.00507 (1.00) |
0.319 (1.00) |
0.714 (1.00) |
| 5p gain | 28 (29%) | 69 |
0.0381 (1.00) |
0.247 (1.00) |
1 (1.00) |
0.562 (1.00) |
0.624 (1.00) |
0.564 (1.00) |
| 5q gain | 20 (21%) | 77 |
0.129 (1.00) |
0.523 (1.00) |
1 (1.00) |
0.674 (1.00) |
0.36 (1.00) |
0.81 (1.00) |
| 6p gain | 18 (19%) | 79 |
0.00474 (1.00) |
0.00692 (1.00) |
1 (1.00) |
1 (1.00) |
0.238 (1.00) |
0.919 (1.00) |
| 6q gain | 11 (11%) | 86 |
0.0806 (1.00) |
0.0922 (1.00) |
0.601 (1.00) |
0.484 (1.00) |
0.397 (1.00) |
0.726 (1.00) |
| 7p gain | 26 (27%) | 71 |
0.0589 (1.00) |
0.195 (1.00) |
0.141 (1.00) |
0.212 (1.00) |
0.105 (1.00) |
0.188 (1.00) |
| 7q gain | 26 (27%) | 71 |
0.103 (1.00) |
0.00982 (1.00) |
0.259 (1.00) |
0.318 (1.00) |
0.31 (1.00) |
0.192 (1.00) |
| 8p gain | 14 (14%) | 83 |
0.338 (1.00) |
0.458 (1.00) |
0.656 (1.00) |
0.519 (1.00) |
0.676 (1.00) |
0.359 (1.00) |
| 9p gain | 4 (4%) | 93 |
0.201 (1.00) |
0.571 (1.00) |
1 (1.00) |
0.172 (1.00) |
0.564 (1.00) |
|
| 9q gain | 3 (3%) | 94 |
0.633 (1.00) |
0.797 (1.00) |
1 (1.00) |
0.29 (1.00) |
1 (1.00) |
|
| 10p gain | 7 (7%) | 90 |
0.433 (1.00) |
0.553 (1.00) |
0.103 (1.00) |
0.0373 (1.00) |
0.668 (1.00) |
0.594 (1.00) |
| 10q gain | 4 (4%) | 93 |
0.258 (1.00) |
0.444 (1.00) |
1 (1.00) |
0.172 (1.00) |
0.491 (1.00) |
|
| 11q gain | 3 (3%) | 94 |
0.192 (1.00) |
0.325 (1.00) |
0.767 (1.00) |
1 (1.00) |
||
| 12p gain | 4 (4%) | 93 |
0.201 (1.00) |
0.688 (1.00) |
1 (1.00) |
0.826 (1.00) |
1 (1.00) |
|
| 12q gain | 5 (5%) | 92 |
0.0736 (1.00) |
0.85 (1.00) |
1 (1.00) |
0.71 (1.00) |
1 (1.00) |
|
| 13q gain | 5 (5%) | 92 |
0.0508 (1.00) |
0.595 (1.00) |
1 (1.00) |
0.845 (1.00) |
0.603 (1.00) |
|
| 14q gain | 5 (5%) | 92 |
0.374 (1.00) |
0.36 (1.00) |
1 (1.00) |
0.921 (1.00) |
||
| 15q gain | 5 (5%) | 92 |
0.315 (1.00) |
0.264 (1.00) |
1 (1.00) |
0.71 (1.00) |
0.781 (1.00) |
|
| 16p gain | 4 (4%) | 93 |
0.201 (1.00) |
0.571 (1.00) |
0.485 (1.00) |
0.519 (1.00) |
0.564 (1.00) |
|
| 17p gain | 5 (5%) | 92 |
0.315 (1.00) |
0.0992 (1.00) |
1 (1.00) |
0.71 (1.00) |
0.781 (1.00) |
|
| 17q gain | 20 (21%) | 77 |
0.0406 (1.00) |
0.947 (1.00) |
0.225 (1.00) |
0.0144 (1.00) |
0.673 (1.00) |
0.886 (1.00) |
| 18p gain | 3 (3%) | 94 |
0.192 (1.00) |
0.444 (1.00) |
0.485 (1.00) |
0.767 (1.00) |
1 (1.00) |
|
| 18q gain | 4 (4%) | 93 |
0.258 (1.00) |
0.144 (1.00) |
0.485 (1.00) |
0.519 (1.00) |
1 (1.00) |
|
| 19p gain | 9 (9%) | 88 |
0.223 (1.00) |
0.0144 (1.00) |
0.103 (1.00) |
0.00507 (1.00) |
0.0431 (1.00) |
0.615 (1.00) |
| 20p gain | 20 (21%) | 77 |
0.376 (1.00) |
0.427 (1.00) |
0.0854 (1.00) |
0.0458 (1.00) |
0.743 (1.00) |
0.946 (1.00) |
| 20q gain | 21 (22%) | 76 |
0.263 (1.00) |
0.399 (1.00) |
0.225 (1.00) |
0.137 (1.00) |
0.57 (1.00) |
0.932 (1.00) |
| 21q gain | 6 (6%) | 91 |
0.316 (1.00) |
0.254 (1.00) |
1 (1.00) |
1 (1.00) |
0.547 (1.00) |
|
| 22q gain | 8 (8%) | 89 |
0.238 (1.00) |
0.35 (1.00) |
0.601 (1.00) |
0.275 (1.00) |
0.541 (1.00) |
0.42 (1.00) |
| Xq gain | 5 (5%) | 92 |
0.126 (1.00) |
0.08 (1.00) |
0.227 (1.00) |
0.27 (1.00) |
0.198 (1.00) |
0.13 (1.00) |
| 1p loss | 15 (15%) | 82 |
0.496 (1.00) |
0.0422 (1.00) |
1 (1.00) |
0.038 (1.00) |
0.293 (1.00) |
0.723 (1.00) |
| 1q loss | 5 (5%) | 92 |
0.315 (1.00) |
0.188 (1.00) |
1 (1.00) |
0.489 (1.00) |
0.848 (1.00) |
|
| 2p loss | 3 (3%) | 94 |
0.385 (1.00) |
0.603 (1.00) |
1 (1.00) |
0.41 (1.00) |
0.481 (1.00) |
|
| 2q loss | 4 (4%) | 93 |
0.144 (1.00) |
0.458 (1.00) |
1 (1.00) |
0.311 (1.00) |
0.272 (1.00) |
|
| 3p loss | 8 (8%) | 89 |
0.181 (1.00) |
0.147 (1.00) |
0.103 (1.00) |
0.0373 (1.00) |
0.268 (1.00) |
0.56 (1.00) |
| 3q loss | 3 (3%) | 94 |
0.192 (1.00) |
0.0353 (1.00) |
0.227 (1.00) |
0.0585 (1.00) |
1 (1.00) |
1 (1.00) |
| 4p loss | 9 (9%) | 88 |
0.021 (1.00) |
0.492 (1.00) |
1 (1.00) |
0.562 (1.00) |
1 (1.00) |
0.486 (1.00) |
| 4q loss | 18 (19%) | 79 |
0.00105 (0.413) |
0.591 (1.00) |
1 (1.00) |
1 (1.00) |
0.535 (1.00) |
0.552 (1.00) |
| 5q loss | 5 (5%) | 92 |
0.0736 (1.00) |
0.571 (1.00) |
0.485 (1.00) |
0.255 (1.00) |
0.921 (1.00) |
|
| 6q loss | 20 (21%) | 77 |
0.513 (1.00) |
1 (1.00) |
0.688 (1.00) |
0.65 (1.00) |
0.743 (1.00) |
0.615 (1.00) |
| 7p loss | 5 (5%) | 92 |
0.0508 (1.00) |
0.85 (1.00) |
0.845 (1.00) |
0.848 (1.00) |
||
| 7q loss | 7 (7%) | 90 |
0.0337 (1.00) |
1 (1.00) |
1 (1.00) |
0.761 (1.00) |
0.145 (1.00) |
|
| 8p loss | 41 (42%) | 56 |
0.00184 (0.718) |
0.641 (1.00) |
1 (1.00) |
0.716 (1.00) |
0.601 (1.00) |
0.133 (1.00) |
| 8q loss | 6 (6%) | 91 |
0.0015 (0.589) |
0.472 (1.00) |
1 (1.00) |
0.319 (1.00) |
0.714 (1.00) |
|
| 9p loss | 20 (21%) | 77 |
0.465 (1.00) |
0.85 (1.00) |
1 (1.00) |
0.333 (1.00) |
0.399 (1.00) |
0.673 (1.00) |
| 9q loss | 19 (20%) | 78 |
0.499 (1.00) |
0.427 (1.00) |
1 (1.00) |
0.196 (1.00) |
0.697 (1.00) |
0.942 (1.00) |
| 10p loss | 6 (6%) | 91 |
0.204 (1.00) |
1 (1.00) |
1 (1.00) |
0.562 (1.00) |
0.854 (1.00) |
0.766 (1.00) |
| 10q loss | 17 (18%) | 80 |
0.0534 (1.00) |
0.255 (1.00) |
0.118 (1.00) |
0.0512 (1.00) |
0.255 (1.00) |
0.102 (1.00) |
| 11p loss | 6 (6%) | 91 |
0.316 (1.00) |
0.553 (1.00) |
0.601 (1.00) |
0.484 (1.00) |
0.854 (1.00) |
0.766 (1.00) |
| 11q loss | 8 (8%) | 89 |
0.238 (1.00) |
1 (1.00) |
0.0184 (1.00) |
0.00466 (1.00) |
0.346 (1.00) |
0.402 (1.00) |
| 12p loss | 8 (8%) | 89 |
0.337 (1.00) |
0.00863 (1.00) |
0.463 (1.00) |
0.245 (1.00) |
||
| 13q loss | 30 (31%) | 67 |
0.0219 (1.00) |
0.115 (1.00) |
0.728 (1.00) |
0.475 (1.00) |
0.0619 (1.00) |
0.506 (1.00) |
| 14q loss | 26 (27%) | 71 |
0.0114 (1.00) |
0.508 (1.00) |
0.141 (1.00) |
0.072 (1.00) |
0.713 (1.00) |
0.592 (1.00) |
| 15q loss | 9 (9%) | 88 |
0.00523 (1.00) |
0.492 (1.00) |
1 (1.00) |
1 (1.00) |
0.469 (1.00) |
0.506 (1.00) |
| 16p loss | 20 (21%) | 77 |
0.0776 (1.00) |
0.0149 (1.00) |
1 (1.00) |
0.729 (1.00) |
0.0542 (1.00) |
0.002 (0.779) |
| 17p loss | 41 (42%) | 56 |
0.00899 (1.00) |
0.018 (1.00) |
0.494 (1.00) |
0.236 (1.00) |
0.152 (1.00) |
0.0428 (1.00) |
| 17q loss | 6 (6%) | 91 |
0.766 (1.00) |
0.078 (1.00) |
1 (1.00) |
0.406 (1.00) |
0.854 (1.00) |
1 (1.00) |
| 18p loss | 10 (10%) | 87 |
0.191 (1.00) |
0.029 (1.00) |
0.601 (1.00) |
0.275 (1.00) |
0.911 (1.00) |
0.665 (1.00) |
| 18q loss | 11 (11%) | 86 |
0.0245 (1.00) |
0.0938 (1.00) |
0.601 (1.00) |
0.275 (1.00) |
0.837 (1.00) |
0.518 (1.00) |
| 19p loss | 5 (5%) | 92 |
0.52 (1.00) |
0.198 (1.00) |
1 (1.00) |
1 (1.00) |
0.452 (1.00) |
|
| 20p loss | 5 (5%) | 92 |
0.734 (1.00) |
0.595 (1.00) |
1 (1.00) |
0.026 (1.00) |
0.288 (1.00) |
|
| 21q loss | 16 (16%) | 81 |
0.357 (1.00) |
0.563 (1.00) |
1 (1.00) |
0.519 (1.00) |
0.298 (1.00) |
0.0897 (1.00) |
| 22q loss | 10 (10%) | 87 |
0.374 (1.00) |
0.473 (1.00) |
0.335 (1.00) |
0.288 (1.00) |
0.911 (1.00) |
0.627 (1.00) |
P value = 4.7e-09 (Fisher's exact test), Q value = 1.9e-06
Table S1. Gene #15: '8q gain mutation analysis' versus Clinical Feature #1: 'CN_CNMF'
| nPatients | CLUS_1 | CLUS_2 | CLUS_3 |
|---|---|---|---|
| ALL | 28 | 36 | 33 |
| 8Q GAIN MUTATED | 26 | 8 | 11 |
| 8Q GAIN WILD-TYPE | 2 | 28 | 22 |
Figure S1. Get High-res Image Gene #15: '8q gain mutation analysis' versus Clinical Feature #1: 'CN_CNMF'
P value = 0.000615 (Fisher's exact test), Q value = 0.24
Table S2. Gene #32: '19q gain mutation analysis' versus Clinical Feature #4: 'MRNASEQ_CHIERARCHICAL'
| nPatients | CLUS_1 | CLUS_2 | CLUS_3 |
|---|---|---|---|
| ALL | 11 | 6 | 17 |
| 19Q GAIN MUTATED | 1 | 4 | 0 |
| 19Q GAIN WILD-TYPE | 10 | 2 | 17 |
Figure S2. Get High-res Image Gene #32: '19q gain mutation analysis' versus Clinical Feature #4: 'MRNASEQ_CHIERARCHICAL'

P value = 0.000233 (Fisher's exact test), Q value = 0.092
Table S3. Gene #63: '16q loss mutation analysis' versus Clinical Feature #2: 'METHLYATION_CNMF'
| nPatients | CLUS_1 | CLUS_2 | CLUS_3 |
|---|---|---|---|
| ALL | 23 | 28 | 45 |
| 16Q LOSS MUTATED | 1 | 15 | 10 |
| 16Q LOSS WILD-TYPE | 22 | 13 | 35 |
Figure S3. Get High-res Image Gene #63: '16q loss mutation analysis' versus Clinical Feature #2: 'METHLYATION_CNMF'
-
Mutation data file = broad_values_by_arm.mutsig.cluster.txt
-
Molecular subtypes file = LIHC-TP.transferedmergedcluster.txt
-
Number of patients = 97
-
Number of significantly arm-level cnvs = 71
-
Number of molecular subtypes = 6
-
Exclude genes that fewer than K tumors have mutations, K = 3
For binary or multi-class clinical features (nominal or ordinal), two-tailed Fisher's exact tests (Fisher 1922) were used to estimate the P values using the 'fisher.test' function in R
For multiple hypothesis correction, Q value is the False Discovery Rate (FDR) analogue of the P value (Benjamini and Hochberg 1995), defined as the minimum FDR at which the test may be called significant. We used the 'Benjamini and Hochberg' method of 'p.adjust' function in R to convert P values into Q values.
This is an experimental feature. The full results of the analysis summarized in this report can be downloaded from the TCGA Data Coordination Center.