This pipeline computes the correlation between significantly recurrent gene mutations and molecular subtypes.
Testing the association between mutation status of 13 genes and 6 molecular subtypes across 83 patients, one significant finding detected with P value < 0.05 and Q value < 0.25.
-
SPOP mutation correlated to 'CN_CNMF'.
Table 1. Get Full Table Overview of the association between mutation status of 13 genes and 6 molecular subtypes. Shown in the table are P values (Q values). Thresholded by P value < 0.05 and Q value < 0.25, one significant finding detected.
|
Clinical Features |
CN CNMF |
METHLYATION CNMF |
MRNASEQ CNMF |
MRNASEQ CHIERARCHICAL |
MIRSEQ CNMF |
MIRSEQ CHIERARCHICAL |
||
| nMutated (%) | nWild-Type | Fisher's exact test | Fisher's exact test | Fisher's exact test | Fisher's exact test | Fisher's exact test | Fisher's exact test | |
| SPOP | 4 (5%) | 79 |
0.00264 (0.195) |
0.0499 (1.00) |
0.1 (1.00) |
0.226 (1.00) |
0.565 (1.00) |
1 (1.00) |
| NKX3-1 | 5 (6%) | 78 |
0.351 (1.00) |
0.248 (1.00) |
0.546 (1.00) |
0.166 (1.00) |
0.118 (1.00) |
0.14 (1.00) |
| TP53 | 5 (6%) | 78 |
0.00525 (0.383) |
0.248 (1.00) |
0.376 (1.00) |
0.121 (1.00) |
0.494 (1.00) |
1 (1.00) |
| FRG1 | 4 (5%) | 79 |
0.262 (1.00) |
0.2 (1.00) |
0.494 (1.00) |
0.781 (1.00) |
0.565 (1.00) |
1 (1.00) |
| YBX1 | 3 (4%) | 80 |
0.709 (1.00) |
0.0945 (1.00) |
0.277 (1.00) |
0.252 (1.00) |
1 (1.00) |
0.594 (1.00) |
| CCNF | 3 (4%) | 80 |
1 (1.00) |
0.791 (1.00) |
0.773 (1.00) |
1 (1.00) |
1 (1.00) |
1 (1.00) |
| CLSTN1 | 3 (4%) | 80 |
1 (1.00) |
0.457 (1.00) |
0.494 (1.00) |
0.781 (1.00) |
0.707 (1.00) |
0.325 (1.00) |
| PRR21 | 4 (5%) | 79 |
0.709 (1.00) |
0.353 (1.00) |
0.494 (1.00) |
0.178 (1.00) |
0.194 (1.00) |
1 (1.00) |
| AGT | 3 (4%) | 80 |
0.709 (1.00) |
1 (1.00) |
1 (1.00) |
1 (1.00) |
1 (1.00) |
0.16 (1.00) |
| CTNNB1 | 3 (4%) | 80 |
1 (1.00) |
0.602 (1.00) |
0.773 (1.00) |
0.343 (1.00) |
0.322 (1.00) |
0.325 (1.00) |
| DUSP27 | 3 (4%) | 80 |
0.544 (1.00) |
0.457 (1.00) |
0.707 (1.00) |
0.325 (1.00) |
||
| OR4D5 | 3 (4%) | 80 |
0.239 (1.00) |
1 (1.00) |
0.707 (1.00) |
1 (1.00) |
||
| OR6N1 | 3 (4%) | 80 |
0.384 (1.00) |
1 (1.00) |
1 (1.00) |
0.465 (1.00) |
0.0778 (1.00) |
0.594 (1.00) |
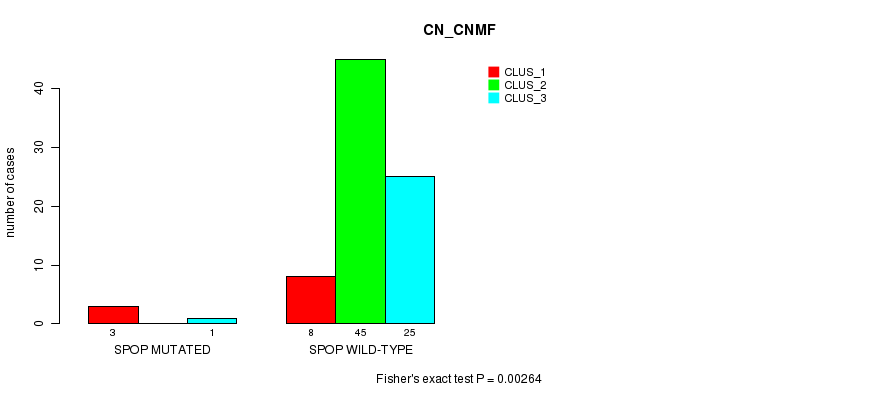
P value = 0.00264 (Fisher's exact test), Q value = 0.2
Table S1. Gene #4: 'SPOP MUTATION STATUS' versus Clinical Feature #1: 'CN_CNMF'
| nPatients | CLUS_1 | CLUS_2 | CLUS_3 |
|---|---|---|---|
| ALL | 11 | 45 | 26 |
| SPOP MUTATED | 3 | 0 | 1 |
| SPOP WILD-TYPE | 8 | 45 | 25 |
Figure S1. Get High-res Image Gene #4: 'SPOP MUTATION STATUS' versus Clinical Feature #1: 'CN_CNMF'
-
Mutation data file = PRAD-TP.mutsig.cluster.txt
-
Molecular subtypes file = PRAD-TP.transferedmergedcluster.txt
-
Number of patients = 83
-
Number of significantly mutated genes = 13
-
Number of Molecular subtypes = 6
-
Exclude genes that fewer than K tumors have mutations, K = 3
For binary or multi-class clinical features (nominal or ordinal), two-tailed Fisher's exact tests (Fisher 1922) were used to estimate the P values using the 'fisher.test' function in R
For multiple hypothesis correction, Q value is the False Discovery Rate (FDR) analogue of the P value (Benjamini and Hochberg 1995), defined as the minimum FDR at which the test may be called significant. We used the 'Benjamini and Hochberg' method of 'p.adjust' function in R to convert P values into Q values.
This is an experimental feature. The full results of the analysis summarized in this report can be downloaded from the TCGA Data Coordination Center.