This pipeline uses various statistical tests to identify mRNAs whose expression levels correlated to selected clinical features.
Testing the association between 17926 genes and 8 clinical features across 72 samples, statistically thresholded by Q value < 0.05, 3 clinical features related to at least one genes.
-
11 genes correlated to 'GENDER'.
-
XIST|7503 , NLGN4Y|22829 , TSIX|9383 , TMSB4Y|9087 , RPS4Y1|6192 , ...
-
54 genes correlated to 'HISTOLOGICAL.TYPE'.
-
EFNA5|1946 , B3GNT6|192134 , GNPNAT1|64841 , AGR3|155465 , AGR2|10551 , ...
-
7 genes correlated to 'PATHOLOGICSPREAD(M)'.
-
SCN2A|6326 , CTNNA2|1496 , C1ORF114|57821 , IGDCC3|9543 , MYBPH|4608 , ...
-
No genes correlated to 'Time to Death', 'AGE', 'PATHOLOGY.T', 'PATHOLOGY.N', and 'TUMOR.STAGE'.
Complete statistical result table is provided in Supplement Table 1
Table 1. Get Full Table This table shows the clinical features, statistical methods used, and the number of genes that are significantly associated with each clinical feature at Q value < 0.05.
| Clinical feature | Statistical test | Significant genes | Associated with | Associated with | ||
|---|---|---|---|---|---|---|
| Time to Death | Cox regression test | N=0 | ||||
| AGE | Spearman correlation test | N=0 | ||||
| GENDER | t test | N=11 | male | N=8 | female | N=3 |
| HISTOLOGICAL TYPE | t test | N=54 | rectal mucinous adenocarcinoma | N=41 | rectal adenocarcinoma | N=13 |
| PATHOLOGY T | Spearman correlation test | N=0 | ||||
| PATHOLOGY N | Spearman correlation test | N=0 | ||||
| PATHOLOGICSPREAD(M) | t test | N=7 | m1 | N=1 | m0 | N=6 |
| TUMOR STAGE | Spearman correlation test | N=0 |
Table S1. Basic characteristics of clinical feature: 'Time to Death'
| Time to Death | Duration (Months) | 0.9-72.1 (median=10.6) |
| censored | N = 39 | |
| death | N = 4 | |
| Significant markers | N = 0 |
Table S2. Basic characteristics of clinical feature: 'AGE'
| AGE | Mean (SD) | 66.75 (10) |
| Significant markers | N = 0 |
Table S3. Basic characteristics of clinical feature: 'GENDER'
| GENDER | Labels | N |
| FEMALE | 33 | |
| MALE | 39 | |
| Significant markers | N = 11 | |
| Higher in MALE | 8 | |
| Higher in FEMALE | 3 |
Table S4. Get Full Table List of top 10 genes differentially expressed by 'GENDER'
| T(pos if higher in 'MALE') | ttestP | Q | AUC | |
|---|---|---|---|---|
| XIST|7503 | -17.89 | 1.189e-20 | 2.13e-16 | 0.9987 |
| NLGN4Y|22829 | 12.07 | 6.01e-15 | 1.08e-10 | 0.9731 |
| TSIX|9383 | -11.07 | 8.536e-14 | 1.53e-09 | 0.9636 |
| TMSB4Y|9087 | 10.29 | 2.797e-13 | 5.01e-09 | 0.9556 |
| RPS4Y1|6192 | 11.83 | 1.894e-12 | 3.39e-08 | 0.996 |
| ZFY|7544 | 10.86 | 4.81e-11 | 8.62e-07 | 0.9803 |
| KDM5D|8284 | 10.84 | 4.932e-09 | 8.84e-05 | 0.998 |
| PRKY|5616 | 6.55 | 8.702e-09 | 0.000156 | 0.8547 |
| UTY|7404 | 9.96 | 8.461e-08 | 0.00152 | 0.9886 |
| DDX3Y|8653 | 9.82 | 2.865e-07 | 0.00513 | 0.9953 |
Figure S1. Get High-res Image As an example, this figure shows the association of XIST|7503 to 'GENDER'. P value = 1.19e-20 with T-test analysis.
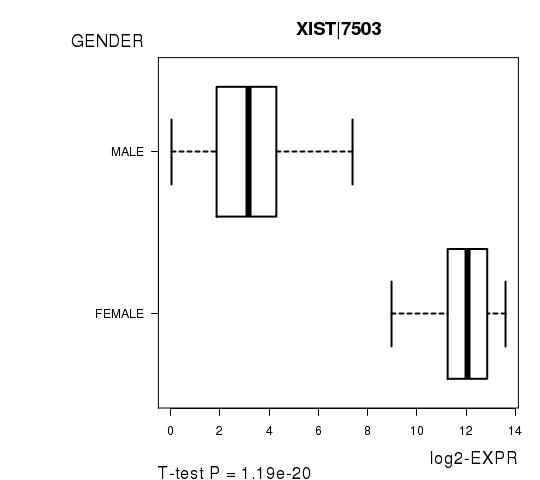
Table S5. Basic characteristics of clinical feature: 'HISTOLOGICAL.TYPE'
| HISTOLOGICAL.TYPE | Labels | N |
| RECTAL ADENOCARCINOMA | 60 | |
| RECTAL MUCINOUS ADENOCARCINOMA | 8 | |
| Significant markers | N = 54 | |
| Higher in RECTAL MUCINOUS ADENOCARCINOMA | 41 | |
| Higher in RECTAL ADENOCARCINOMA | 13 |
Table S6. Get Full Table List of top 10 genes differentially expressed by 'HISTOLOGICAL.TYPE'
| T(pos if higher in 'RECTAL MUCINOUS ADENOCARCINOMA') | ttestP | Q | AUC | |
|---|---|---|---|---|
| EFNA5|1946 | 10.01 | 3.79e-13 | 6.72e-09 | 0.8896 |
| B3GNT6|192134 | 9.68 | 1.746e-10 | 3.09e-06 | 0.9576 |
| GNPNAT1|64841 | 8.16 | 3.791e-10 | 6.72e-06 | 0.9292 |
| AGR3|155465 | 8 | 4.976e-10 | 8.82e-06 | 0.8958 |
| AGR2|10551 | 9.07 | 1.701e-08 | 0.000301 | 0.95 |
| SERPINA1|5265 | 8.67 | 3.548e-08 | 0.000628 | 0.9333 |
| SPDEF|25803 | 8.09 | 4.428e-08 | 0.000784 | 0.9438 |
| PNKD|25953 | -8.62 | 7.819e-08 | 0.00138 | 0.9562 |
| SNX20|124460 | 6.51 | 7.907e-08 | 0.0014 | 0.825 |
| ANG|283 | 7.8 | 8.451e-08 | 0.0015 | 0.9125 |
Figure S2. Get High-res Image As an example, this figure shows the association of EFNA5|1946 to 'HISTOLOGICAL.TYPE'. P value = 3.79e-13 with T-test analysis.
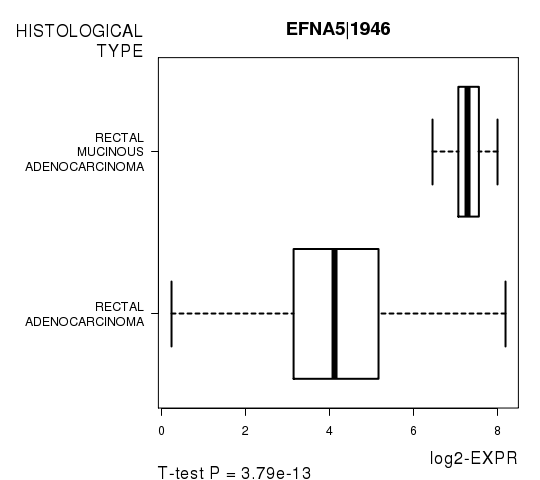
Table S7. Basic characteristics of clinical feature: 'PATHOLOGY.T'
| PATHOLOGY.T | Mean (SD) | 2.71 (0.68) |
| N | ||
| T1 | 5 | |
| T2 | 15 | |
| T3 | 48 | |
| T4 | 4 | |
| Significant markers | N = 0 |
Table S8. Basic characteristics of clinical feature: 'PATHOLOGY.N'
| PATHOLOGY.N | Mean (SD) | 0.56 (0.77) |
| N | ||
| N0 | 44 | |
| N1 | 16 | |
| N2 | 12 | |
| Significant markers | N = 0 |
Table S9. Basic characteristics of clinical feature: 'PATHOLOGICSPREAD(M)'
| PATHOLOGICSPREAD(M) | Labels | N |
| M0 | 61 | |
| M1 | 11 | |
| Significant markers | N = 7 | |
| Higher in M1 | 1 | |
| Higher in M0 | 6 |
Table S10. Get Full Table List of 7 genes differentially expressed by 'PATHOLOGICSPREAD(M)'
| T(pos if higher in 'M1') | ttestP | Q | AUC | |
|---|---|---|---|---|
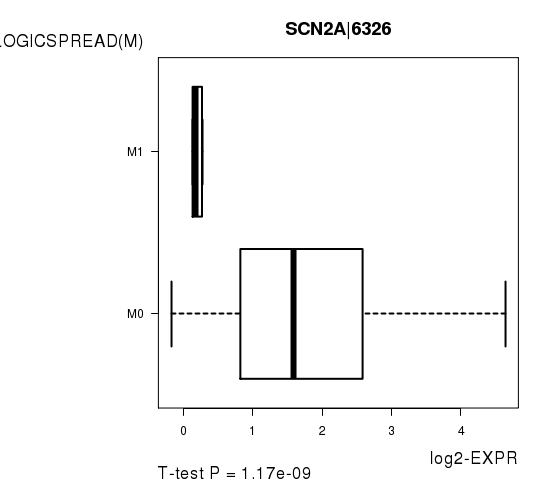
| SCN2A|6326 | -7.42 | 1.171e-09 | 2.09e-05 | 0.8819 |
| CTNNA2|1496 | -6.38 | 8.414e-08 | 0.0015 | 0.8827 |
| C1ORF114|57821 | -6.44 | 2.261e-07 | 0.00403 | 0.8429 |
| IGDCC3|9543 | -6.1 | 3.199e-07 | 0.0057 | 0.859 |
| MYBPH|4608 | -6.17 | 4.345e-07 | 0.00774 | 0.9412 |
| RNF214|257160 | 5.66 | 1.032e-06 | 0.0184 | 0.8659 |
| TMEM84|283673 | -5.91 | 1.052e-06 | 0.0187 | 0.8485 |
Figure S3. Get High-res Image As an example, this figure shows the association of SCN2A|6326 to 'PATHOLOGICSPREAD(M)'. P value = 1.17e-09 with T-test analysis.
-
Expresson data file = READ-TP.uncv2.mRNAseq_RSEM_normalized_log2.txt
-
Clinical data file = READ-TP.clin.merged.picked.txt
-
Number of patients = 72
-
Number of genes = 17926
-
Number of clinical features = 8
For survival clinical features, Wald's test in univariate Cox regression analysis with proportional hazards model (Andersen and Gill 1982) was used to estimate the P values using the 'coxph' function in R. Kaplan-Meier survival curves were plot using the four quartile subgroups of patients based on expression levels
For continuous numerical clinical features, Spearman's rank correlation coefficients (Spearman 1904) and two-tailed P values were estimated using 'cor.test' function in R
For two-class clinical features, two-tailed Student's t test with unequal variance (Lehmann and Romano 2005) was applied to compare the log2-expression levels between the two clinical classes using 't.test' function in R
For multiple hypothesis correction, Q value is the False Discovery Rate (FDR) analogue of the P value (Benjamini and Hochberg 1995), defined as the minimum FDR at which the test may be called significant. We used the 'Benjamini and Hochberg' method of 'p.adjust' function in R to convert P values into Q values.
This is an experimental feature. The full results of the analysis summarized in this report can be downloaded from the TCGA Data Coordination Center.