A TCGA sample is profiled to detect the copy number variations and expressions of genes. This pipeline attempts to correlate copy number and Rnaseq data of genes across samples to determine if the copy number variations also result in differential expressions. This report contains the calculated correlation coefficients based on measurements of genomic copy number (log2) values and RNAseq expression of the corresponding feature across patients. High positive/low negative correlation coefficients indicate that genomic alterations result in differences in the expressions of mRNAseq the genomic regions transcribe.
The correlation coefficients in 10, 20, 30, 40, 50, 60, 70, 80, 90 percentiles are 925.9, 2005, 2652, 3228, 3805, 4393.4, 4991, 5628, 6432.1, respectively.
Number of genes and samples used for the calculation are shown in Table 1. Figure 1 shows the distribution of calculated correlation coefficients and quantile-quantile plot of the calculated correlation coefficients against a normal distribution. Table 2 shows the top 20 features ordered by the value of correlation coefficients.
Table 1. Counts of mRNAseq and number of samples in copy number and expression data sets and common to both
| Category | Copy number | Expression | Common |
|---|---|---|---|
| Sample | 162 | 72 | 71 |
| Genes | 23778 | 17926 | 17840 |
Figure 1. Summary figures. Left: histogram showing the distribution of the calculated correlations across samples for all Genes. Right: QQ plot of the calculated correlations across samples. The QQ plot is used to plot the quantiles of the calculated correlation coefficients against that derived from a normal distribution. Points deviating from the blue line indicate deviation from normality.
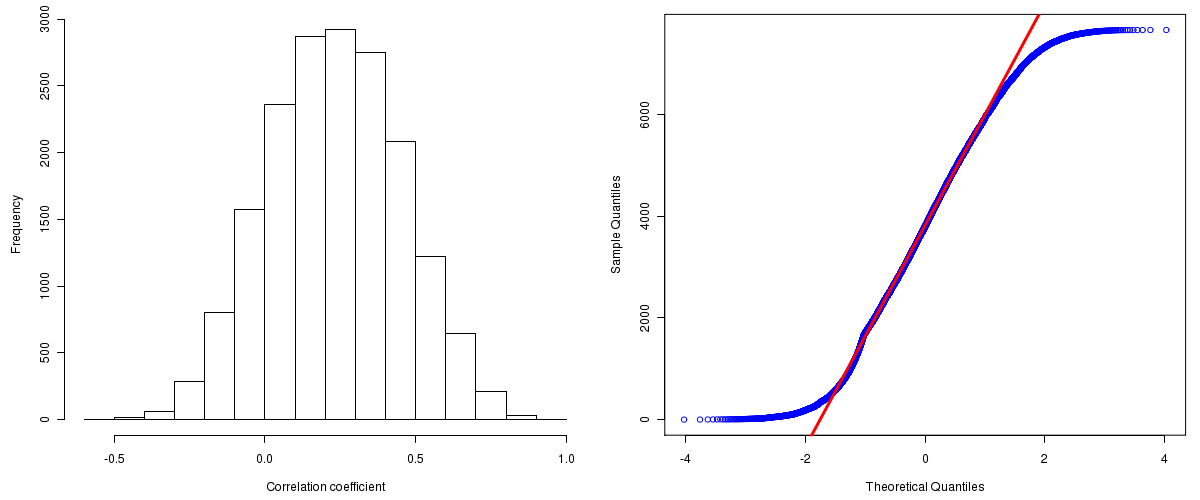
Table 2. Get Full Table Top 20 features (defined by the feature column) ranked by correlation coefficients
| Locus ID | Gene Symbol | Cytoband | cor | p-value | q-value |
|---|---|---|---|---|---|
| 57325 | CSRP2BP | 20p11.23 | 0.9002 | 0 | 0 |
| 91782 | CHMP7 | 8p21.3 | 0.8797 | 0 | 0 |
| 55968 | NSFL1C | 20p13 | 0.8762 | 0 | 0 |
| 9491 | PSMF1 | 20p13 | 0.8677 | 0 | 0 |
| 55756 | INTS9 | 8p21.1 | 0.8594 | 0 | 0 |
| 6143 | RPL19 | 17q12 | 0.8552 | 0 | 0 |
| 9878 | TOX4 | 14q11.2 | 0.8463 | 0 | 0 |
| 8795 | TNFRSF10B | 8p21.3 | 0.8412 | 0 | 0 |
| 51507 | C20orf43 | 20q13.31 | 0.8404 | 0 | 0 |
| 661 | POLR3D | 8p21.3 | 0.8364 | 0 | 0 |
| 55909 | BIN3 | 8p21.3 | 0.8362 | 0 | 0 |
| 55140 | ELP3 | 8p21.1 | 0.8361 | 0 | 0 |
| 3035 | HARS | 5q31.3 | 0.8359 | 0 | 0 |
| 1457 | CSNK2A1 | 20p13 | 0.8356 | 0 | 0 |
| 5786 | PTPRA | 20p13 | 0.8329 | 0 | 0 |
| 9513 | FXR2 | 17p13.1 | 0.8303 | 0 | 0 |
| 64412 | GZF1 | 20p11.21 | 0.8287 | 0 | 0 |
| 23514 | KIAA0146 | 8q11.21 | 0.8259 | 0 | 0 |
| 57805 | KIAA1967 | 8p21.3 | 0.82 | 0 | 0 |
| 1211 | CLTA | 9p13.3 | 0.8192 | 0 | 0 |
Gene level (TCGA Level III) mRNAseq expression data and copy number data of corresponding gene derived by GISTIC pipelinePearson correlation coefficients were calculated for each pair of genes shared by the two data sets across all the samples that were common.
Pairwise correlations between the log2 copy numbers and expressions of each gene across samples were calculated using Pearson correlation.
This is an experimental feature. The full results of the analysis summarized in this report can be downloaded from the TCGA Data Coordination Center.