This pipeline computes the correlation between significant arm-level copy number variations (cnvs) and subtypes.
Testing the association between copy number variation 75 arm-level results and 10 molecular subtypes across 162 patients, 11 significant findings detected with Q value < 0.25.
-
6p gain cnv correlated to 'CN_CNMF'.
-
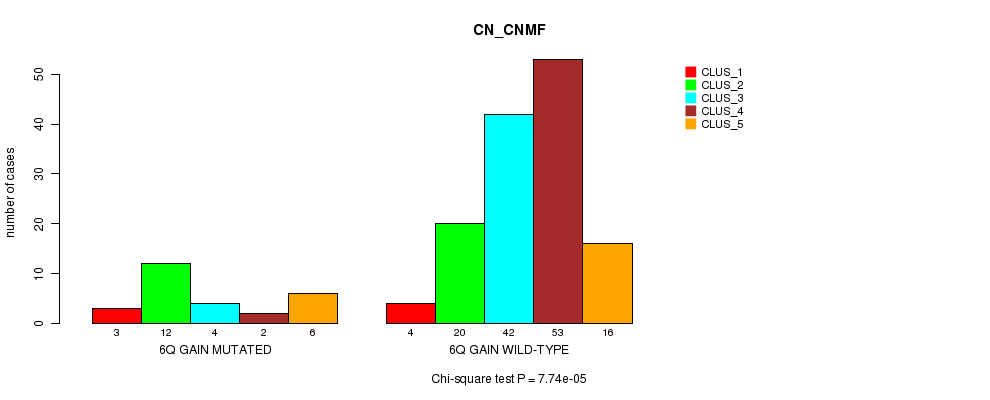
6q gain cnv correlated to 'CN_CNMF'.
-
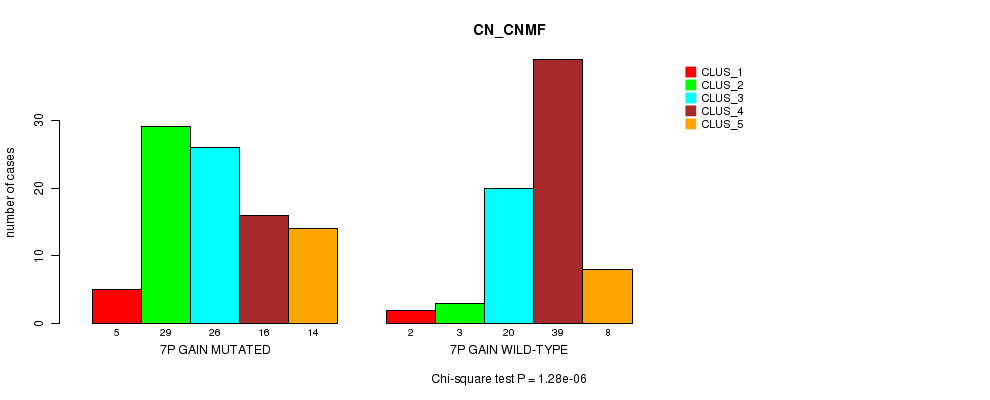
7p gain cnv correlated to 'CN_CNMF'.
-
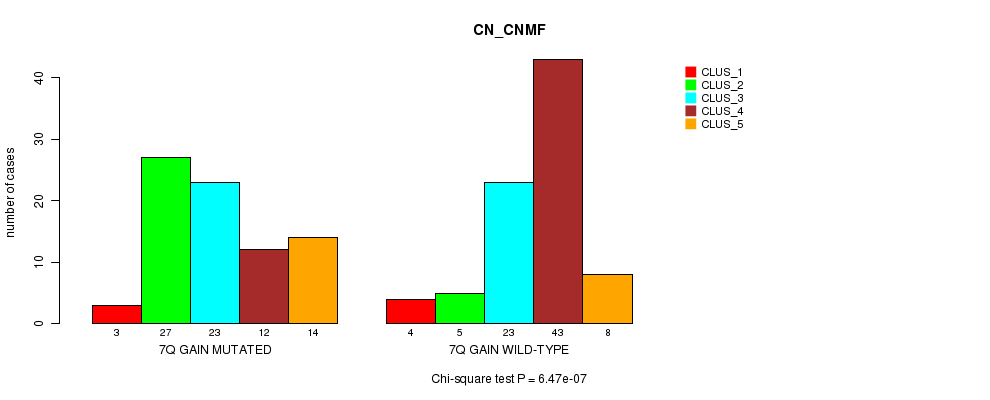
7q gain cnv correlated to 'CN_CNMF'.
-
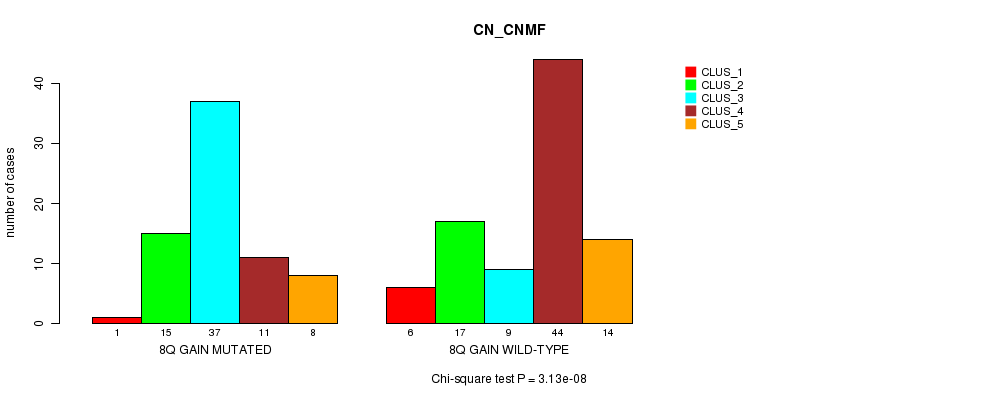
8q gain cnv correlated to 'CN_CNMF'.
-
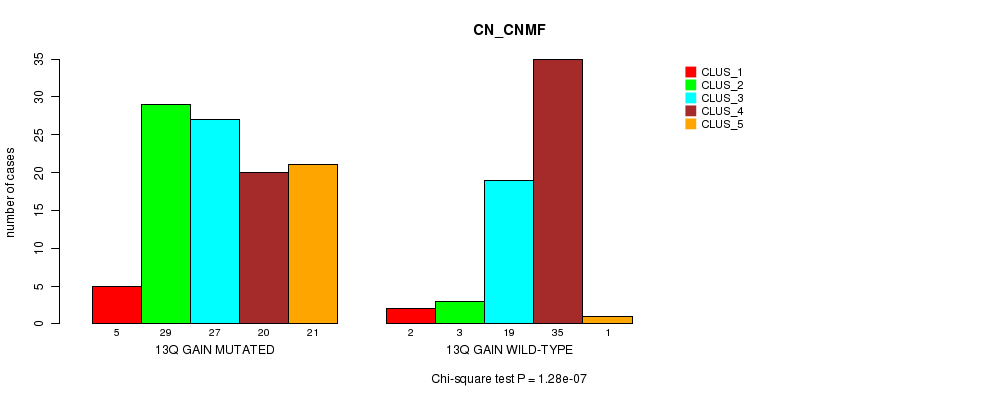
13q gain cnv correlated to 'CN_CNMF'.
-
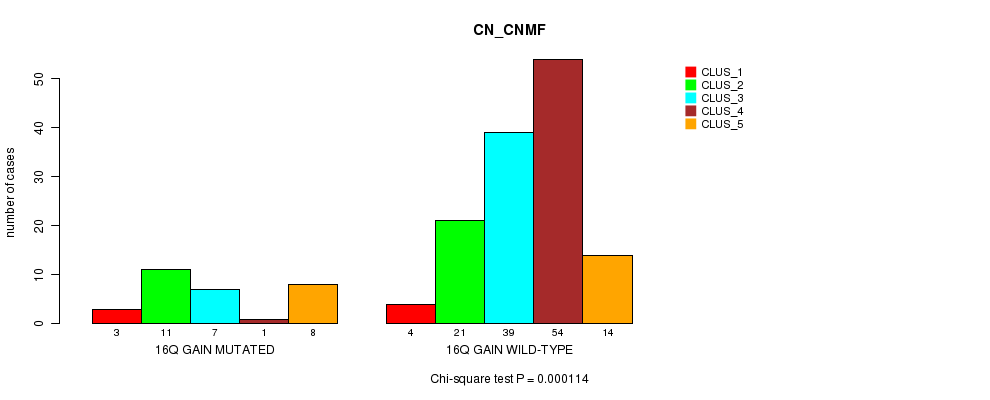
16q gain cnv correlated to 'CN_CNMF'.
-
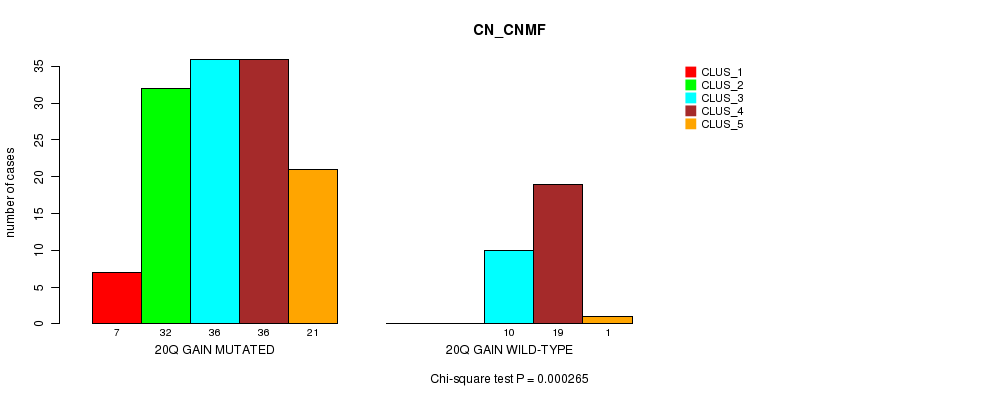
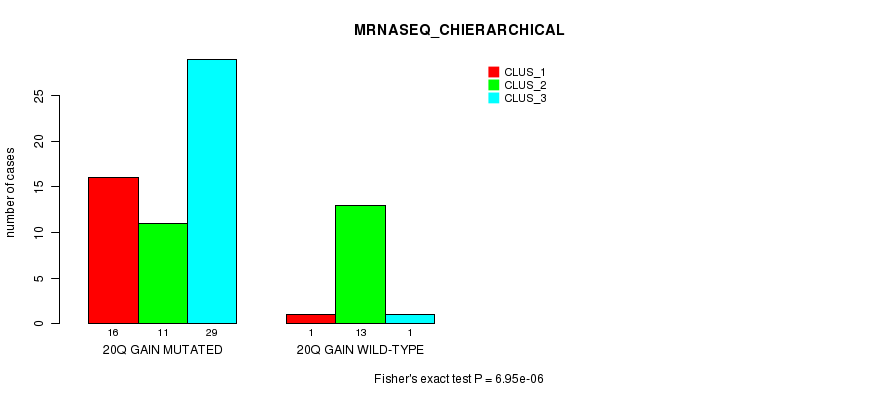
20q gain cnv correlated to 'CN_CNMF' and 'MRNASEQ_CHIERARCHICAL'.
-
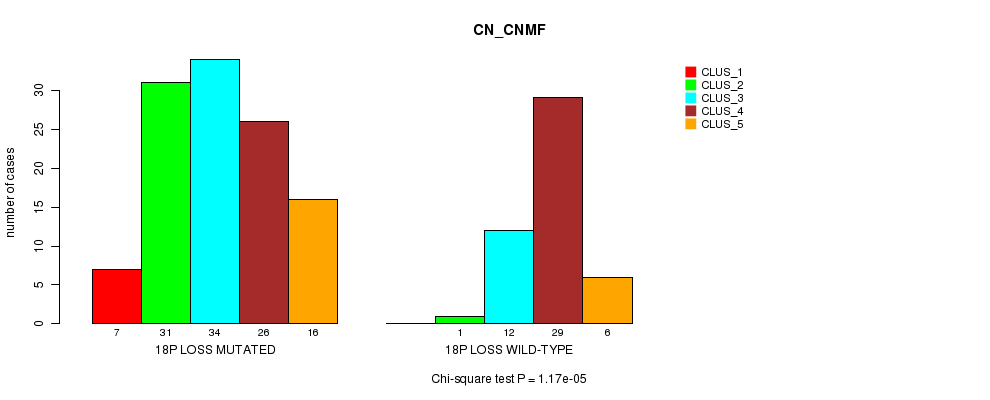
18p loss cnv correlated to 'CN_CNMF'.
-
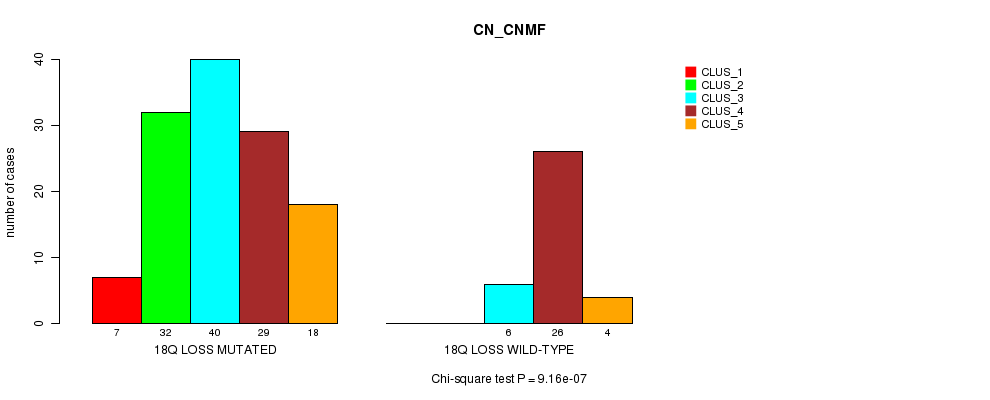
18q loss cnv correlated to 'CN_CNMF'.
Table 1. Get Full Table Overview of the association between significant copy number variation of 75 arm-level results and 10 molecular subtypes. Shown in the table are P values (Q values). Thresholded by Q value < 0.25, 11 significant findings detected.
|
Molecular subtypes |
MRNA CNMF |
MRNA CHIERARCHICAL |
CN CNMF |
METHLYATION CNMF |
RPPA CNMF |
RPPA CHIERARCHICAL |
MRNASEQ CNMF |
MRNASEQ CHIERARCHICAL |
MIRSEQ CNMF |
MIRSEQ CHIERARCHICAL |
||
| nCNV (%) | nWild-Type | Fisher's exact test | Fisher's exact test | Chi-square test | Fisher's exact test | Fisher's exact test | Chi-square test | Fisher's exact test | Fisher's exact test | Chi-square test | Fisher's exact test | |
| 20q gain | 132 (81%) | 30 |
0.0858 (1.00) |
0.0909 (1.00) |
0.000265 (0.181) |
0.226 (1.00) |
0.252 (1.00) |
0.978 (1.00) |
0.0379 (1.00) |
6.95e-06 (0.00477) |
0.791 (1.00) |
0.465 (1.00) |
| 6p gain | 27 (17%) | 135 |
0.432 (1.00) |
0.263 (1.00) |
3.03e-05 (0.0207) |
0.00823 (1.00) |
0.55 (1.00) |
0.264 (1.00) |
0.246 (1.00) |
0.0339 (1.00) |
0.748 (1.00) |
0.694 (1.00) |
| 6q gain | 27 (17%) | 135 |
0.432 (1.00) |
0.263 (1.00) |
7.74e-05 (0.0529) |
0.0597 (1.00) |
0.55 (1.00) |
0.268 (1.00) |
0.246 (1.00) |
0.0339 (1.00) |
0.861 (1.00) |
0.694 (1.00) |
| 7p gain | 90 (56%) | 72 |
0.00256 (1.00) |
0.00222 (1.00) |
1.28e-06 (0.000879) |
0.0155 (1.00) |
0.579 (1.00) |
0.83 (1.00) |
0.0277 (1.00) |
0.0072 (1.00) |
0.151 (1.00) |
0.0302 (1.00) |
| 7q gain | 79 (49%) | 83 |
0.00631 (1.00) |
0.00494 (1.00) |
6.47e-07 (0.000446) |
0.0926 (1.00) |
0.923 (1.00) |
0.408 (1.00) |
0.0656 (1.00) |
0.0128 (1.00) |
0.651 (1.00) |
0.354 (1.00) |
| 8q gain | 72 (44%) | 90 |
0.00878 (1.00) |
0.019 (1.00) |
3.13e-08 (2.16e-05) |
0.523 (1.00) |
0.101 (1.00) |
0.0977 (1.00) |
0.0728 (1.00) |
0.0513 (1.00) |
0.488 (1.00) |
0.288 (1.00) |
| 13q gain | 102 (63%) | 60 |
0.225 (1.00) |
0.175 (1.00) |
1.28e-07 (8.83e-05) |
0.362 (1.00) |
0.622 (1.00) |
0.721 (1.00) |
0.11 (1.00) |
0.0129 (1.00) |
0.0316 (1.00) |
0.108 (1.00) |
| 16q gain | 30 (19%) | 132 |
0.356 (1.00) |
0.474 (1.00) |
0.000114 (0.078) |
0.532 (1.00) |
0.803 (1.00) |
0.742 (1.00) |
0.658 (1.00) |
0.745 (1.00) |
0.0397 (1.00) |
0.0964 (1.00) |
| 18p loss | 114 (70%) | 48 |
0.0181 (1.00) |
0.0163 (1.00) |
1.17e-05 (0.00801) |
0.425 (1.00) |
0.309 (1.00) |
0.716 (1.00) |
0.0738 (1.00) |
0.332 (1.00) |
0.582 (1.00) |
0.406 (1.00) |
| 18q loss | 126 (78%) | 36 |
0.0195 (1.00) |
0.0148 (1.00) |
9.16e-07 (0.000631) |
0.37 (1.00) |
0.737 (1.00) |
0.935 (1.00) |
0.0319 (1.00) |
0.548 (1.00) |
0.613 (1.00) |
0.668 (1.00) |
| 1p gain | 4 (2%) | 158 |
0.708 (1.00) |
0.481 (1.00) |
1 (1.00) |
0.0105 (1.00) |
0.15 (1.00) |
0.748 (1.00) |
||||
| 1q gain | 27 (17%) | 135 |
0.724 (1.00) |
0.923 (1.00) |
0.0332 (1.00) |
0.16 (1.00) |
0.0777 (1.00) |
0.28 (1.00) |
0.316 (1.00) |
0.793 (1.00) |
0.43 (1.00) |
0.761 (1.00) |
| 2p gain | 20 (12%) | 142 |
0.197 (1.00) |
0.427 (1.00) |
0.157 (1.00) |
0.697 (1.00) |
0.538 (1.00) |
0.787 (1.00) |
0.0461 (1.00) |
0.0818 (1.00) |
0.553 (1.00) |
0.346 (1.00) |
| 2q gain | 21 (13%) | 141 |
0.0305 (1.00) |
0.0789 (1.00) |
0.701 (1.00) |
0.797 (1.00) |
0.679 (1.00) |
0.718 (1.00) |
0.0471 (1.00) |
0.0175 (1.00) |
0.108 (1.00) |
0.726 (1.00) |
| 3p gain | 17 (10%) | 145 |
0.833 (1.00) |
0.671 (1.00) |
0.0252 (1.00) |
0.605 (1.00) |
0.0641 (1.00) |
0.837 (1.00) |
1 (1.00) |
0.817 (1.00) |
0.344 (1.00) |
0.0138 (1.00) |
| 3q gain | 23 (14%) | 139 |
1 (1.00) |
0.808 (1.00) |
0.00832 (1.00) |
1 (1.00) |
0.0239 (1.00) |
0.226 (1.00) |
0.638 (1.00) |
0.569 (1.00) |
0.518 (1.00) |
0.041 (1.00) |
| 4p gain | 4 (2%) | 158 |
0.391 (1.00) |
1 (1.00) |
0.57 (1.00) |
0.58 (1.00) |
0.366 (1.00) |
0.501 (1.00) |
||||
| 4q gain | 3 (2%) | 159 |
0.286 (1.00) |
0.476 (1.00) |
0.552 (1.00) |
0.78 (1.00) |
0.512 (1.00) |
|||||
| 5p gain | 20 (12%) | 142 |
0.832 (1.00) |
1 (1.00) |
0.072 (1.00) |
0.108 (1.00) |
0.799 (1.00) |
0.719 (1.00) |
0.638 (1.00) |
0.231 (1.00) |
0.331 (1.00) |
0.68 (1.00) |
| 5q gain | 12 (7%) | 150 |
0.543 (1.00) |
0.418 (1.00) |
0.056 (1.00) |
0.0444 (1.00) |
0.907 (1.00) |
0.282 (1.00) |
0.866 (1.00) |
0.356 (1.00) |
0.397 (1.00) |
0.447 (1.00) |
| 8p gain | 27 (17%) | 135 |
0.631 (1.00) |
0.238 (1.00) |
0.00775 (1.00) |
0.662 (1.00) |
0.063 (1.00) |
0.0618 (1.00) |
0.943 (1.00) |
0.499 (1.00) |
0.94 (1.00) |
0.499 (1.00) |
| 9p gain | 35 (22%) | 127 |
0.0354 (1.00) |
0.201 (1.00) |
0.482 (1.00) |
0.0493 (1.00) |
0.593 (1.00) |
0.181 (1.00) |
0.98 (1.00) |
0.67 (1.00) |
0.153 (1.00) |
0.712 (1.00) |
| 9q gain | 26 (16%) | 136 |
0.0426 (1.00) |
0.271 (1.00) |
0.135 (1.00) |
0.44 (1.00) |
0.471 (1.00) |
0.272 (1.00) |
0.144 (1.00) |
0.0237 (1.00) |
0.306 (1.00) |
0.465 (1.00) |
| 10p gain | 8 (5%) | 154 |
0.309 (1.00) |
0.515 (1.00) |
0.245 (1.00) |
0.481 (1.00) |
0.189 (1.00) |
0.549 (1.00) |
0.00187 (1.00) |
0.0794 (1.00) |
0.391 (1.00) |
0.87 (1.00) |
| 10q gain | 4 (2%) | 158 |
0.444 (1.00) |
0.785 (1.00) |
0.925 (1.00) |
0.631 (1.00) |
0.788 (1.00) |
|||||
| 11p gain | 21 (13%) | 141 |
0.0363 (1.00) |
0.0609 (1.00) |
0.0813 (1.00) |
0.333 (1.00) |
0.794 (1.00) |
0.871 (1.00) |
0.0612 (1.00) |
0.0968 (1.00) |
0.464 (1.00) |
0.15 (1.00) |
| 11q gain | 17 (10%) | 145 |
0.0848 (1.00) |
0.14 (1.00) |
0.00131 (0.889) |
0.024 (1.00) |
0.617 (1.00) |
0.721 (1.00) |
0.00291 (1.00) |
0.125 (1.00) |
0.936 (1.00) |
0.796 (1.00) |
| 12p gain | 28 (17%) | 134 |
0.582 (1.00) |
0.381 (1.00) |
0.0201 (1.00) |
0.797 (1.00) |
0.274 (1.00) |
0.084 (1.00) |
0.102 (1.00) |
0.0218 (1.00) |
0.297 (1.00) |
0.164 (1.00) |
| 12q gain | 19 (12%) | 143 |
1 (1.00) |
1 (1.00) |
0.32 (1.00) |
0.458 (1.00) |
0.451 (1.00) |
0.038 (1.00) |
0.671 (1.00) |
0.112 (1.00) |
0.342 (1.00) |
0.485 (1.00) |
| 14q gain | 4 (2%) | 158 |
0.708 (1.00) |
0.176 (1.00) |
0.463 (1.00) |
0.41 (1.00) |
0.111 (1.00) |
0.19 (1.00) |
||||
| 16p gain | 29 (18%) | 133 |
0.245 (1.00) |
0.356 (1.00) |
0.0101 (1.00) |
0.455 (1.00) |
1 (1.00) |
0.801 (1.00) |
0.428 (1.00) |
0.52 (1.00) |
0.449 (1.00) |
0.332 (1.00) |
| 17p gain | 3 (2%) | 159 |
0.111 (1.00) |
|||||||||
| 17q gain | 18 (11%) | 144 |
0.189 (1.00) |
0.606 (1.00) |
0.0397 (1.00) |
0.909 (1.00) |
0.933 (1.00) |
0.884 (1.00) |
0.108 (1.00) |
0.39 (1.00) |
0.409 (1.00) |
0.31 (1.00) |
| 18p gain | 7 (4%) | 155 |
0.282 (1.00) |
0.774 (1.00) |
0.118 (1.00) |
0.299 (1.00) |
0.795 (1.00) |
0.808 (1.00) |
0.73 (1.00) |
0.672 (1.00) |
0.757 (1.00) |
1 (1.00) |
| 18q gain | 4 (2%) | 158 |
0.708 (1.00) |
0.113 (1.00) |
1 (1.00) |
0.789 (1.00) |
0.735 (1.00) |
0.501 (1.00) |
||||
| 19p gain | 20 (12%) | 142 |
0.00723 (1.00) |
0.115 (1.00) |
0.00524 (1.00) |
0.703 (1.00) |
0.895 (1.00) |
0.751 (1.00) |
0.0675 (1.00) |
0.121 (1.00) |
0.357 (1.00) |
0.232 (1.00) |
| 19q gain | 23 (14%) | 139 |
0.0202 (1.00) |
0.0827 (1.00) |
0.00568 (1.00) |
0.614 (1.00) |
0.471 (1.00) |
0.524 (1.00) |
0.00418 (1.00) |
0.0223 (1.00) |
0.407 (1.00) |
0.788 (1.00) |
| 20p gain | 95 (59%) | 67 |
0.717 (1.00) |
0.466 (1.00) |
0.147 (1.00) |
0.619 (1.00) |
0.0295 (1.00) |
0.838 (1.00) |
0.67 (1.00) |
0.0386 (1.00) |
0.577 (1.00) |
0.19 (1.00) |
| 21q gain | 7 (4%) | 155 |
0.502 (1.00) |
0.107 (1.00) |
0.467 (1.00) |
0.818 (1.00) |
1 (1.00) |
0.634 (1.00) |
0.495 (1.00) |
1 (1.00) |
0.307 (1.00) |
1 (1.00) |
| 22q gain | 5 (3%) | 157 |
0.191 (1.00) |
0.107 (1.00) |
0.563 (1.00) |
0.728 (1.00) |
0.0639 (1.00) |
0.167 (1.00) |
0.175 (1.00) |
0.631 (1.00) |
0.788 (1.00) |
|
| Xq gain | 7 (4%) | 155 |
1 (1.00) |
0.829 (1.00) |
0.591 (1.00) |
1 (1.00) |
0.762 (1.00) |
0.63 (1.00) |
0.73 (1.00) |
0.672 (1.00) |
0.744 (1.00) |
0.87 (1.00) |
| 1p loss | 21 (13%) | 141 |
0.604 (1.00) |
1 (1.00) |
0.0239 (1.00) |
0.395 (1.00) |
0.344 (1.00) |
0.418 (1.00) |
0.123 (1.00) |
0.283 (1.00) |
0.387 (1.00) |
0.463 (1.00) |
| 1q loss | 7 (4%) | 155 |
0.833 (1.00) |
0.671 (1.00) |
0.536 (1.00) |
0.622 (1.00) |
0.57 (1.00) |
0.616 (1.00) |
0.11 (1.00) |
0.0512 (1.00) |
0.52 (1.00) |
0.87 (1.00) |
| 2p loss | 5 (3%) | 157 |
0.426 (1.00) |
0.62 (1.00) |
0.413 (1.00) |
0.682 (1.00) |
0.123 (1.00) |
0.112 (1.00) |
0.355 (1.00) |
0.0965 (1.00) |
0.0741 (1.00) |
|
| 3p loss | 8 (5%) | 154 |
1 (1.00) |
1 (1.00) |
0.486 (1.00) |
0.461 (1.00) |
0.903 (1.00) |
0.775 (1.00) |
0.783 (1.00) |
0.817 (1.00) |
0.754 (1.00) |
0.775 (1.00) |
| 3q loss | 4 (2%) | 158 |
0.463 (1.00) |
1 (1.00) |
0.314 (1.00) |
0.413 (1.00) |
1 (1.00) |
|||||
| 4p loss | 39 (24%) | 123 |
0.365 (1.00) |
0.94 (1.00) |
0.002 (1.00) |
0.867 (1.00) |
0.54 (1.00) |
0.358 (1.00) |
0.393 (1.00) |
0.445 (1.00) |
0.783 (1.00) |
1 (1.00) |
| 4q loss | 46 (28%) | 116 |
0.591 (1.00) |
1 (1.00) |
0.000856 (0.581) |
0.841 (1.00) |
0.523 (1.00) |
0.369 (1.00) |
0.141 (1.00) |
0.27 (1.00) |
0.885 (1.00) |
0.818 (1.00) |
| 5p loss | 11 (7%) | 151 |
0.151 (1.00) |
0.25 (1.00) |
0.745 (1.00) |
0.368 (1.00) |
0.592 (1.00) |
0.701 (1.00) |
0.267 (1.00) |
0.363 (1.00) |
0.438 (1.00) |
0.127 (1.00) |
| 5q loss | 23 (14%) | 139 |
0.0173 (1.00) |
0.0609 (1.00) |
0.204 (1.00) |
0.108 (1.00) |
0.895 (1.00) |
0.838 (1.00) |
0.377 (1.00) |
0.0871 (1.00) |
0.774 (1.00) |
0.16 (1.00) |
| 6p loss | 8 (5%) | 154 |
0.38 (1.00) |
0.829 (1.00) |
0.572 (1.00) |
0.0133 (1.00) |
1 (1.00) |
0.702 (1.00) |
0.143 (1.00) |
0.153 (1.00) |
0.757 (1.00) |
0.87 (1.00) |
| 6q loss | 14 (9%) | 148 |
1 (1.00) |
0.606 (1.00) |
0.269 (1.00) |
0.268 (1.00) |
0.31 (1.00) |
0.828 (1.00) |
0.269 (1.00) |
0.00482 (1.00) |
0.186 (1.00) |
0.135 (1.00) |
| 8p loss | 56 (35%) | 106 |
0.642 (1.00) |
0.373 (1.00) |
0.0258 (1.00) |
0.697 (1.00) |
0.692 (1.00) |
0.679 (1.00) |
0.56 (1.00) |
0.269 (1.00) |
0.716 (1.00) |
0.102 (1.00) |
| 8q loss | 3 (2%) | 159 |
0.486 (1.00) |
0.785 (1.00) |
0.925 (1.00) |
0.527 (1.00) |
1 (1.00) |
|||||
| 9p loss | 12 (7%) | 150 |
0.662 (1.00) |
0.758 (1.00) |
0.101 (1.00) |
0.883 (1.00) |
0.439 (1.00) |
0.514 (1.00) |
0.0213 (1.00) |
0.363 (1.00) |
0.965 (1.00) |
1 (1.00) |
| 9q loss | 11 (7%) | 151 |
0.607 (1.00) |
0.315 (1.00) |
0.265 (1.00) |
1 (1.00) |
0.558 (1.00) |
0.644 (1.00) |
0.227 (1.00) |
0.175 (1.00) |
0.645 (1.00) |
0.317 (1.00) |
| 10p loss | 17 (10%) | 145 |
0.0447 (1.00) |
0.0149 (1.00) |
0.353 (1.00) |
0.614 (1.00) |
0.109 (1.00) |
0.344 (1.00) |
0.263 (1.00) |
0.271 (1.00) |
0.91 (1.00) |
1 (1.00) |
| 10q loss | 21 (13%) | 141 |
0.136 (1.00) |
0.317 (1.00) |
0.0692 (1.00) |
0.582 (1.00) |
0.428 (1.00) |
0.838 (1.00) |
0.0433 (1.00) |
0.0548 (1.00) |
0.97 (1.00) |
0.894 (1.00) |
| 11p loss | 19 (12%) | 143 |
0.0628 (1.00) |
0.131 (1.00) |
0.0303 (1.00) |
0.0434 (1.00) |
0.607 (1.00) |
0.101 (1.00) |
0.111 (1.00) |
0.0526 (1.00) |
0.856 (1.00) |
0.661 (1.00) |
| 11q loss | 23 (14%) | 139 |
0.0628 (1.00) |
0.131 (1.00) |
0.0221 (1.00) |
0.117 (1.00) |
0.95 (1.00) |
0.146 (1.00) |
0.136 (1.00) |
0.0526 (1.00) |
0.101 (1.00) |
0.221 (1.00) |
| 12p loss | 12 (7%) | 150 |
0.731 (1.00) |
0.848 (1.00) |
0.331 (1.00) |
0.0753 (1.00) |
0.617 (1.00) |
0.0822 (1.00) |
0.164 (1.00) |
0.125 (1.00) |
0.871 (1.00) |
0.535 (1.00) |
| 12q loss | 8 (5%) | 154 |
1 (1.00) |
0.625 (1.00) |
0.541 (1.00) |
1 (1.00) |
0.795 (1.00) |
0.592 (1.00) |
0.129 (1.00) |
0.175 (1.00) |
0.483 (1.00) |
0.57 (1.00) |
| 13q loss | 5 (3%) | 157 |
0.092 (1.00) |
0.186 (1.00) |
0.318 (1.00) |
0.597 (1.00) |
0.345 (1.00) |
0.843 (1.00) |
||||
| 14q loss | 51 (31%) | 111 |
0.805 (1.00) |
0.252 (1.00) |
0.000406 (0.276) |
1 (1.00) |
0.429 (1.00) |
0.255 (1.00) |
0.142 (1.00) |
0.804 (1.00) |
0.965 (1.00) |
0.371 (1.00) |
| 15q loss | 58 (36%) | 104 |
0.785 (1.00) |
0.227 (1.00) |
0.00229 (1.00) |
0.45 (1.00) |
0.0216 (1.00) |
0.0757 (1.00) |
0.717 (1.00) |
0.82 (1.00) |
0.566 (1.00) |
0.714 (1.00) |
| 16p loss | 6 (4%) | 156 |
0.191 (1.00) |
0.488 (1.00) |
0.225 (1.00) |
0.481 (1.00) |
0.762 (1.00) |
0.563 (1.00) |
0.388 (1.00) |
0.329 (1.00) |
0.568 (1.00) |
1 (1.00) |
| 16q loss | 10 (6%) | 152 |
0.0202 (1.00) |
0.12 (1.00) |
0.00539 (1.00) |
0.441 (1.00) |
0.373 (1.00) |
0.641 (1.00) |
0.112 (1.00) |
0.434 (1.00) |
0.612 (1.00) |
0.603 (1.00) |
| 17p loss | 89 (55%) | 73 |
0.866 (1.00) |
1 (1.00) |
0.252 (1.00) |
0.606 (1.00) |
0.249 (1.00) |
0.285 (1.00) |
0.408 (1.00) |
0.653 (1.00) |
0.615 (1.00) |
0.893 (1.00) |
| 17q loss | 15 (9%) | 147 |
0.614 (1.00) |
0.362 (1.00) |
0.303 (1.00) |
0.134 (1.00) |
0.707 (1.00) |
0.477 (1.00) |
0.899 (1.00) |
0.817 (1.00) |
0.336 (1.00) |
0.736 (1.00) |
| 19p loss | 7 (4%) | 155 |
0.265 (1.00) |
0.368 (1.00) |
0.795 (1.00) |
0.571 (1.00) |
0.143 (1.00) |
0.141 (1.00) |
||||
| 19q loss | 7 (4%) | 155 |
0.494 (1.00) |
0.105 (1.00) |
0.662 (1.00) |
0.563 (1.00) |
0.701 (1.00) |
0.351 (1.00) |
||||
| 20p loss | 18 (11%) | 144 |
1 (1.00) |
1 (1.00) |
0.162 (1.00) |
0.65 (1.00) |
0.197 (1.00) |
0.867 (1.00) |
0.301 (1.00) |
0.92 (1.00) |
0.0305 (1.00) |
0.0916 (1.00) |
| 21q loss | 43 (27%) | 119 |
0.879 (1.00) |
0.676 (1.00) |
0.25 (1.00) |
0.596 (1.00) |
0.149 (1.00) |
0.915 (1.00) |
0.948 (1.00) |
0.885 (1.00) |
0.099 (1.00) |
0.663 (1.00) |
| 22q loss | 42 (26%) | 120 |
0.887 (1.00) |
0.739 (1.00) |
0.5 (1.00) |
0.311 (1.00) |
0.639 (1.00) |
0.475 (1.00) |
0.616 (1.00) |
0.944 (1.00) |
0.119 (1.00) |
0.788 (1.00) |
| Xq loss | 6 (4%) | 156 |
0.771 (1.00) |
0.37 (1.00) |
0.283 (1.00) |
0.481 (1.00) |
0.855 (1.00) |
0.706 (1.00) |
0.893 (1.00) |
1 (1.00) |
0.843 (1.00) |
0.843 (1.00) |
P value = 3.03e-05 (Chi-square test), Q value = 0.021
Table S1. Gene #11: '6p gain mutation analysis' versus Clinical Feature #3: 'CN_CNMF'
| nPatients | CLUS_1 | CLUS_2 | CLUS_3 | CLUS_4 | CLUS_5 |
|---|---|---|---|---|---|
| ALL | 7 | 32 | 46 | 55 | 22 |
| 6P GAIN MUTATED | 4 | 11 | 4 | 2 | 6 |
| 6P GAIN WILD-TYPE | 3 | 21 | 42 | 53 | 16 |
Figure S1. Get High-res Image Gene #11: '6p gain mutation analysis' versus Clinical Feature #3: 'CN_CNMF'

P value = 7.74e-05 (Chi-square test), Q value = 0.053
Table S2. Gene #12: '6q gain mutation analysis' versus Clinical Feature #3: 'CN_CNMF'
| nPatients | CLUS_1 | CLUS_2 | CLUS_3 | CLUS_4 | CLUS_5 |
|---|---|---|---|---|---|
| ALL | 7 | 32 | 46 | 55 | 22 |
| 6Q GAIN MUTATED | 3 | 12 | 4 | 2 | 6 |
| 6Q GAIN WILD-TYPE | 4 | 20 | 42 | 53 | 16 |
Figure S2. Get High-res Image Gene #12: '6q gain mutation analysis' versus Clinical Feature #3: 'CN_CNMF'
P value = 1.28e-06 (Chi-square test), Q value = 0.00088
Table S3. Gene #13: '7p gain mutation analysis' versus Clinical Feature #3: 'CN_CNMF'
| nPatients | CLUS_1 | CLUS_2 | CLUS_3 | CLUS_4 | CLUS_5 |
|---|---|---|---|---|---|
| ALL | 7 | 32 | 46 | 55 | 22 |
| 7P GAIN MUTATED | 5 | 29 | 26 | 16 | 14 |
| 7P GAIN WILD-TYPE | 2 | 3 | 20 | 39 | 8 |
Figure S3. Get High-res Image Gene #13: '7p gain mutation analysis' versus Clinical Feature #3: 'CN_CNMF'
P value = 6.47e-07 (Chi-square test), Q value = 0.00045
Table S4. Gene #14: '7q gain mutation analysis' versus Clinical Feature #3: 'CN_CNMF'
| nPatients | CLUS_1 | CLUS_2 | CLUS_3 | CLUS_4 | CLUS_5 |
|---|---|---|---|---|---|
| ALL | 7 | 32 | 46 | 55 | 22 |
| 7Q GAIN MUTATED | 3 | 27 | 23 | 12 | 14 |
| 7Q GAIN WILD-TYPE | 4 | 5 | 23 | 43 | 8 |
Figure S4. Get High-res Image Gene #14: '7q gain mutation analysis' versus Clinical Feature #3: 'CN_CNMF'
P value = 3.13e-08 (Chi-square test), Q value = 2.2e-05
Table S5. Gene #16: '8q gain mutation analysis' versus Clinical Feature #3: 'CN_CNMF'
| nPatients | CLUS_1 | CLUS_2 | CLUS_3 | CLUS_4 | CLUS_5 |
|---|---|---|---|---|---|
| ALL | 7 | 32 | 46 | 55 | 22 |
| 8Q GAIN MUTATED | 1 | 15 | 37 | 11 | 8 |
| 8Q GAIN WILD-TYPE | 6 | 17 | 9 | 44 | 14 |
Figure S5. Get High-res Image Gene #16: '8q gain mutation analysis' versus Clinical Feature #3: 'CN_CNMF'
P value = 1.28e-07 (Chi-square test), Q value = 8.8e-05
Table S6. Gene #25: '13q gain mutation analysis' versus Clinical Feature #3: 'CN_CNMF'
| nPatients | CLUS_1 | CLUS_2 | CLUS_3 | CLUS_4 | CLUS_5 |
|---|---|---|---|---|---|
| ALL | 7 | 32 | 46 | 55 | 22 |
| 13Q GAIN MUTATED | 5 | 29 | 27 | 20 | 21 |
| 13Q GAIN WILD-TYPE | 2 | 3 | 19 | 35 | 1 |
Figure S6. Get High-res Image Gene #25: '13q gain mutation analysis' versus Clinical Feature #3: 'CN_CNMF'
P value = 0.000114 (Chi-square test), Q value = 0.078
Table S7. Gene #28: '16q gain mutation analysis' versus Clinical Feature #3: 'CN_CNMF'
| nPatients | CLUS_1 | CLUS_2 | CLUS_3 | CLUS_4 | CLUS_5 |
|---|---|---|---|---|---|
| ALL | 7 | 32 | 46 | 55 | 22 |
| 16Q GAIN MUTATED | 3 | 11 | 7 | 1 | 8 |
| 16Q GAIN WILD-TYPE | 4 | 21 | 39 | 54 | 14 |
Figure S7. Get High-res Image Gene #28: '16q gain mutation analysis' versus Clinical Feature #3: 'CN_CNMF'
P value = 0.000265 (Chi-square test), Q value = 0.18
Table S8. Gene #36: '20q gain mutation analysis' versus Clinical Feature #3: 'CN_CNMF'
| nPatients | CLUS_1 | CLUS_2 | CLUS_3 | CLUS_4 | CLUS_5 |
|---|---|---|---|---|---|
| ALL | 7 | 32 | 46 | 55 | 22 |
| 20Q GAIN MUTATED | 7 | 32 | 36 | 36 | 21 |
| 20Q GAIN WILD-TYPE | 0 | 0 | 10 | 19 | 1 |
Figure S8. Get High-res Image Gene #36: '20q gain mutation analysis' versus Clinical Feature #3: 'CN_CNMF'
P value = 6.95e-06 (Fisher's exact test), Q value = 0.0048
Table S9. Gene #36: '20q gain mutation analysis' versus Clinical Feature #8: 'MRNASEQ_CHIERARCHICAL'
| nPatients | CLUS_1 | CLUS_2 | CLUS_3 |
|---|---|---|---|
| ALL | 17 | 24 | 30 |
| 20Q GAIN MUTATED | 16 | 11 | 29 |
| 20Q GAIN WILD-TYPE | 1 | 13 | 1 |
Figure S9. Get High-res Image Gene #36: '20q gain mutation analysis' versus Clinical Feature #8: 'MRNASEQ_CHIERARCHICAL'
P value = 1.17e-05 (Chi-square test), Q value = 0.008
Table S10. Gene #68: '18p loss mutation analysis' versus Clinical Feature #3: 'CN_CNMF'
| nPatients | CLUS_1 | CLUS_2 | CLUS_3 | CLUS_4 | CLUS_5 |
|---|---|---|---|---|---|
| ALL | 7 | 32 | 46 | 55 | 22 |
| 18P LOSS MUTATED | 7 | 31 | 34 | 26 | 16 |
| 18P LOSS WILD-TYPE | 0 | 1 | 12 | 29 | 6 |
Figure S10. Get High-res Image Gene #68: '18p loss mutation analysis' versus Clinical Feature #3: 'CN_CNMF'
P value = 9.16e-07 (Chi-square test), Q value = 0.00063
Table S11. Gene #69: '18q loss mutation analysis' versus Clinical Feature #3: 'CN_CNMF'
| nPatients | CLUS_1 | CLUS_2 | CLUS_3 | CLUS_4 | CLUS_5 |
|---|---|---|---|---|---|
| ALL | 7 | 32 | 46 | 55 | 22 |
| 18Q LOSS MUTATED | 7 | 32 | 40 | 29 | 18 |
| 18Q LOSS WILD-TYPE | 0 | 0 | 6 | 26 | 4 |
Figure S11. Get High-res Image Gene #69: '18q loss mutation analysis' versus Clinical Feature #3: 'CN_CNMF'
-
Mutation data file = broad_values_by_arm.mutsig.cluster.txt
-
Molecular subtypes file = READ-TP.transferedmergedcluster.txt
-
Number of patients = 162
-
Number of significantly arm-level cnvs = 75
-
Number of molecular subtypes = 10
-
Exclude genes that fewer than K tumors have mutations, K = 3
For binary or multi-class clinical features (nominal or ordinal), two-tailed Fisher's exact tests (Fisher 1922) were used to estimate the P values using the 'fisher.test' function in R
For multi-class clinical features (nominal or ordinal), Chi-square tests (Greenwood and Nikulin 1996) were used to estimate the P values using the 'chisq.test' function in R
For multiple hypothesis correction, Q value is the False Discovery Rate (FDR) analogue of the P value (Benjamini and Hochberg 1995), defined as the minimum FDR at which the test may be called significant. We used the 'Benjamini and Hochberg' method of 'p.adjust' function in R to convert P values into Q values.
This is an experimental feature. The full results of the analysis summarized in this report can be downloaded from the TCGA Data Coordination Center.