This pipeline uses various statistical tests to identify genes whose promoter methylation levels correlated to selected clinical features.
Testing the association between 17131 genes and 6 clinical features across 143 samples, statistically thresholded by Q value < 0.05, 4 clinical features related to at least one genes.
-
2 genes correlated to 'AGE'.
-
STL , PTX3
-
35 genes correlated to 'DISTANT.METASTASIS'.
-
SELT , RASA2 , LDHAL6B , CCNG1 , COL5A1 , ...
-
61 genes correlated to 'LYMPH.NODE.METASTASIS'.
-
CRYM , THNSL1 , NGLY1 , C6ORF162 , TERF1 , ...
-
2 genes correlated to 'NEOPLASM.DISEASESTAGE'.
-
ELP2 , SLC39A6
-
No genes correlated to 'Time to Death', and 'GENDER'.
Complete statistical result table is provided in Supplement Table 1
Table 1. Get Full Table This table shows the clinical features, statistical methods used, and the number of genes that are significantly associated with each clinical feature at Q value < 0.05.
| Clinical feature | Statistical test | Significant genes | Associated with | Associated with | ||
|---|---|---|---|---|---|---|
| Time to Death | Cox regression test | N=0 | ||||
| AGE | Spearman correlation test | N=2 | older | N=2 | younger | N=0 |
| GENDER | t test | N=0 | ||||
| DISTANT METASTASIS | ANOVA test | N=35 | ||||
| LYMPH NODE METASTASIS | ANOVA test | N=61 | ||||
| NEOPLASM DISEASESTAGE | ANOVA test | N=2 |
Table S1. Basic characteristics of clinical feature: 'Time to Death'
| Time to Death | Duration (Months) | 0.2-346 (median=47.5) |
| censored | N = 69 | |
| death | N = 70 | |
| Significant markers | N = 0 |
Table S2. Basic characteristics of clinical feature: 'AGE'
| AGE | Mean (SD) | 56.02 (16) |
| Significant markers | N = 2 | |
| pos. correlated | 2 | |
| neg. correlated | 0 |
Table S3. Get Full Table List of 2 genes significantly correlated to 'AGE' by Spearman correlation test
| SpearmanCorr | corrP | Q | |
|---|---|---|---|
| STL | 0.4029 | 7.303e-07 | 0.0125 |
| PTX3 | 0.3831 | 2.752e-06 | 0.0471 |
Figure S1. Get High-res Image As an example, this figure shows the association of STL to 'AGE'. P value = 7.3e-07 with Spearman correlation analysis. The straight line presents the best linear regression.
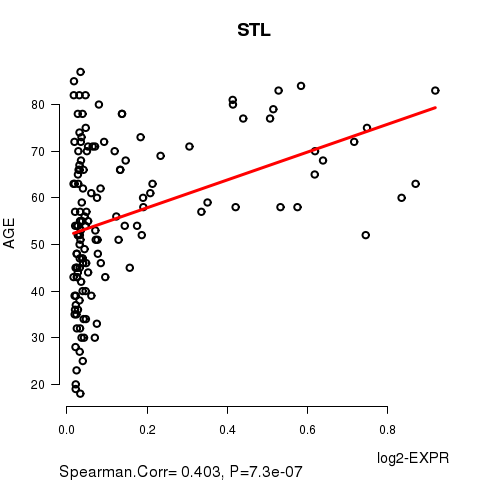
Table S4. Basic characteristics of clinical feature: 'GENDER'
| GENDER | Labels | N |
| FEMALE | 53 | |
| MALE | 90 | |
| Significant markers | N = 0 |
Table S5. Basic characteristics of clinical feature: 'DISTANT.METASTASIS'
| DISTANT.METASTASIS | Labels | N |
| M0 | 120 | |
| M1 | 2 | |
| M1A | 2 | |
| M1C | 2 | |
| Significant markers | N = 35 |
Table S6. Get Full Table List of top 10 genes differentially expressed by 'DISTANT.METASTASIS'
| ANOVA_P | Q | |
|---|---|---|
| SELT | 6.099e-19 | 1.04e-14 |
| RASA2 | 1.692e-18 | 2.9e-14 |
| LDHAL6B | 8.774e-18 | 1.5e-13 |
| CCNG1 | 1.455e-17 | 2.49e-13 |
| COL5A1 | 2.872e-14 | 4.92e-10 |
| FGFR2 | 5.653e-14 | 9.68e-10 |
| AZI2 | 8.623e-13 | 1.48e-08 |
| C9ORF140 | 1.767e-12 | 3.03e-08 |
| ATG3 | 2.036e-11 | 3.49e-07 |
| FHOD1 | 2.686e-11 | 4.6e-07 |
Figure S2. Get High-res Image As an example, this figure shows the association of SELT to 'DISTANT.METASTASIS'. P value = 6.1e-19 with ANOVA analysis.
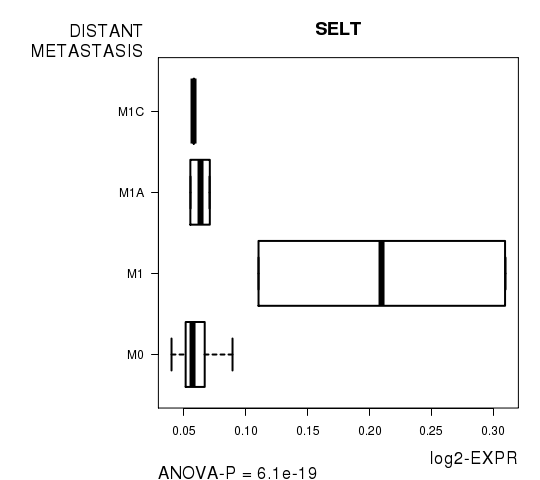
Table S7. Basic characteristics of clinical feature: 'LYMPH.NODE.METASTASIS'
| LYMPH.NODE.METASTASIS | Labels | N |
| N0 | 81 | |
| N1 | 2 | |
| N1A | 6 | |
| N1B | 11 | |
| N2 | 1 | |
| N2A | 1 | |
| N2B | 9 | |
| N2C | 4 | |
| N3 | 10 | |
| NX | 2 | |
| Significant markers | N = 61 |
Table S8. Get Full Table List of top 10 genes differentially expressed by 'LYMPH.NODE.METASTASIS'
| ANOVA_P | Q | |
|---|---|---|
| CRYM | 3.736e-71 | 6.4e-67 |
| THNSL1 | 2.447e-70 | 4.19e-66 |
| NGLY1 | 1.711e-56 | 2.93e-52 |
| C6ORF162 | 8.104e-37 | 1.39e-32 |
| TERF1 | 3.052e-34 | 5.23e-30 |
| LIMK2 | 8.15e-30 | 1.4e-25 |
| AP2S1 | 6.059e-26 | 1.04e-21 |
| HES7 | 1.93e-25 | 3.31e-21 |
| C17ORF63 | 4.717e-23 | 8.08e-19 |
| RNASEH2B | 6.882e-19 | 1.18e-14 |
Figure S3. Get High-res Image As an example, this figure shows the association of CRYM to 'LYMPH.NODE.METASTASIS'. P value = 3.74e-71 with ANOVA analysis.
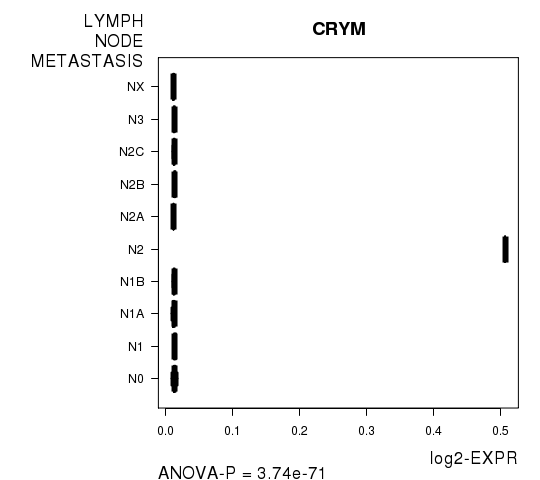
Table S9. Basic characteristics of clinical feature: 'NEOPLASM.DISEASESTAGE'
| NEOPLASM.DISEASESTAGE | Labels | N |
| STAGE I | 17 | |
| STAGE IA | 9 | |
| STAGE IB | 11 | |
| STAGE II | 18 | |
| STAGE IIA | 7 | |
| STAGE IIB | 8 | |
| STAGE IIC | 6 | |
| STAGE III | 6 | |
| STAGE IIIA | 5 | |
| STAGE IIIB | 14 | |
| STAGE IIIC | 17 | |
| STAGE IV | 5 | |
| Significant markers | N = 2 |
Table S10. Get Full Table List of 2 genes differentially expressed by 'NEOPLASM.DISEASESTAGE'
| ANOVA_P | Q | |
|---|---|---|
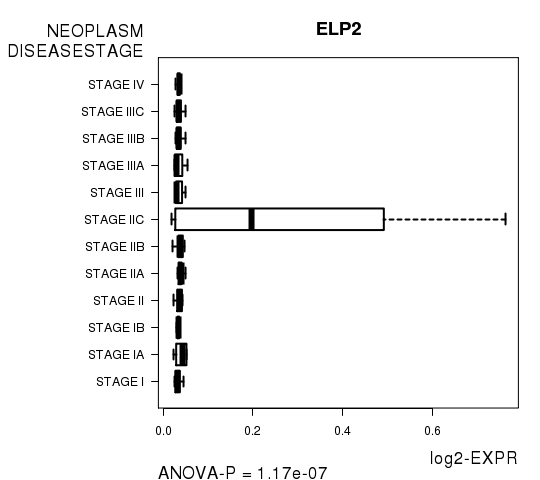
| ELP2 | 1.173e-07 | 0.00201 |
| SLC39A6 | 1.173e-07 | 0.00201 |
Figure S4. Get High-res Image As an example, this figure shows the association of ELP2 to 'NEOPLASM.DISEASESTAGE'. P value = 1.17e-07 with ANOVA analysis.
-
Expresson data file = SKCM-TM.meth.for_correlation.filtered_data.txt
-
Clinical data file = SKCM-TM.clin.merged.picked.txt
-
Number of patients = 143
-
Number of genes = 17131
-
Number of clinical features = 6
For survival clinical features, Wald's test in univariate Cox regression analysis with proportional hazards model (Andersen and Gill 1982) was used to estimate the P values using the 'coxph' function in R. Kaplan-Meier survival curves were plot using the four quartile subgroups of patients based on expression levels
For continuous numerical clinical features, Spearman's rank correlation coefficients (Spearman 1904) and two-tailed P values were estimated using 'cor.test' function in R
For two-class clinical features, two-tailed Student's t test with unequal variance (Lehmann and Romano 2005) was applied to compare the log2-expression levels between the two clinical classes using 't.test' function in R
For multi-class clinical features (ordinal or nominal), one-way analysis of variance (Howell 2002) was applied to compare the log2-expression levels between different clinical classes using 'anova' function in R
For multiple hypothesis correction, Q value is the False Discovery Rate (FDR) analogue of the P value (Benjamini and Hochberg 1995), defined as the minimum FDR at which the test may be called significant. We used the 'Benjamini and Hochberg' method of 'p.adjust' function in R to convert P values into Q values.
This is an experimental feature. The full results of the analysis summarized in this report can be downloaded from the TCGA Data Coordination Center.