This pipeline uses various statistical tests to identify miRs whose expression levels correlated to selected clinical features.
Testing the association between 533 genes and 9 clinical features across 161 samples, statistically thresholded by Q value < 0.05, 4 clinical features related to at least one genes.
-
1 gene correlated to 'AGE'.
-
HSA-MIR-100
-
2 genes correlated to 'HISTOLOGICAL.TYPE'.
-
HSA-MIR-577 , HSA-MIR-579
-
19 genes correlated to 'PATHOLOGY.T'.
-
HSA-MIR-200B , HSA-MIR-217 , HSA-MIR-143 , HSA-MIR-200C , HSA-MIR-429 , ...
-
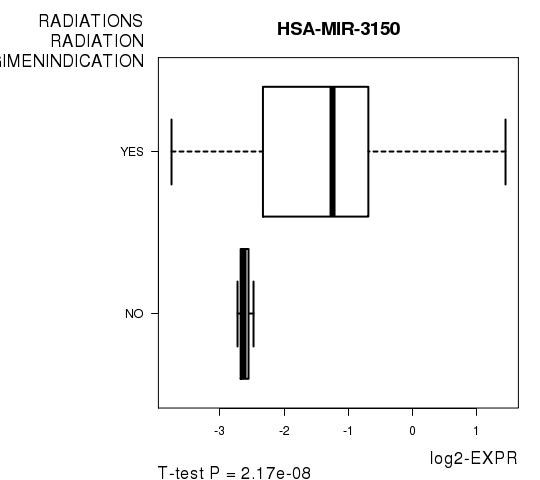
4 genes correlated to 'RADIATIONS.RADIATION.REGIMENINDICATION'.
-
HSA-MIR-3150 , HSA-MIR-23A , HSA-MIR-548F-1 , HSA-MIR-559
-
No genes correlated to 'Time to Death', 'GENDER', 'PATHOLOGY.N', 'PATHOLOGICSPREAD(M)', and 'TUMOR.STAGE'.
Complete statistical result table is provided in Supplement Table 1
Table 1. Get Full Table This table shows the clinical features, statistical methods used, and the number of genes that are significantly associated with each clinical feature at Q value < 0.05.
| Clinical feature | Statistical test | Significant genes | Associated with | Associated with | ||
|---|---|---|---|---|---|---|
| Time to Death | Cox regression test | N=0 | ||||
| AGE | Spearman correlation test | N=1 | older | N=0 | younger | N=1 |
| GENDER | t test | N=0 | ||||
| HISTOLOGICAL TYPE | ANOVA test | N=2 | ||||
| PATHOLOGY T | Spearman correlation test | N=19 | higher pT | N=3 | lower pT | N=16 |
| PATHOLOGY N | Spearman correlation test | N=0 | ||||
| PATHOLOGICSPREAD(M) | ANOVA test | N=0 | ||||
| TUMOR STAGE | Spearman correlation test | N=0 | ||||
| RADIATIONS RADIATION REGIMENINDICATION | t test | N=4 | yes | N=4 | no | N=0 |
Table S1. Basic characteristics of clinical feature: 'Time to Death'
| Time to Death | Duration (Months) | 0.1-72.2 (median=1.5) |
| censored | N = 108 | |
| death | N = 16 | |
| Significant markers | N = 0 |
Table S2. Basic characteristics of clinical feature: 'AGE'
| AGE | Mean (SD) | 67.58 (11) |
| Significant markers | N = 1 | |
| pos. correlated | 0 | |
| neg. correlated | 1 |
Table S3. Get Full Table List of one gene significantly correlated to 'AGE' by Spearman correlation test
| SpearmanCorr | corrP | Q | |
|---|---|---|---|
| HSA-MIR-100 | -0.3135 | 7.521e-05 | 0.0401 |
Figure S1. Get High-res Image As an example, this figure shows the association of HSA-MIR-100 to 'AGE'. P value = 7.52e-05 with Spearman correlation analysis. The straight line presents the best linear regression.
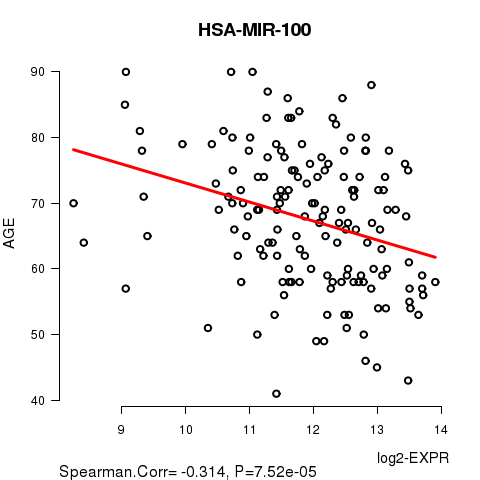
Table S4. Basic characteristics of clinical feature: 'GENDER'
| GENDER | Labels | N |
| FEMALE | 65 | |
| MALE | 96 | |
| Significant markers | N = 0 |
Table S5. Basic characteristics of clinical feature: 'HISTOLOGICAL.TYPE'
| HISTOLOGICAL.TYPE | Labels | N |
| STOMACH ADENOCARCINOMA - DIFFUSE TYPE | 19 | |
| STOMACH ADENOCARCINOMA - NOT OTHERWISE SPECIFIED (NOS) | 79 | |
| STOMACH ADENOCARCINOMA - SIGNET RING TYPE | 1 | |
| STOMACH INTESTINAL ADENOCARCINOMA - MUCINOUS TYPE | 9 | |
| STOMACH INTESTINAL ADENOCARCINOMA - PAPILLARY TYPE | 3 | |
| STOMACH INTESTINAL ADENOCARCINOMA - TUBULAR TYPE | 10 | |
| STOMACH INTESTINAL ADENOCARCINOMA - TYPE NOT OTHERWISE SPECIFIED (NOS) | 35 | |
| Significant markers | N = 2 |
Table S6. Get Full Table List of 2 genes differentially expressed by 'HISTOLOGICAL.TYPE'
| ANOVA_P | Q | |
|---|---|---|
| HSA-MIR-577 | 7.19e-05 | 0.0383 |
| HSA-MIR-579 | 9.028e-05 | 0.048 |
Figure S2. Get High-res Image As an example, this figure shows the association of HSA-MIR-577 to 'HISTOLOGICAL.TYPE'. P value = 7.19e-05 with ANOVA analysis.
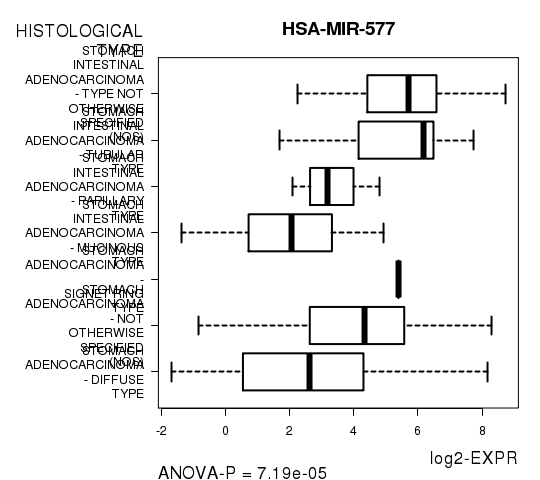
Table S7. Basic characteristics of clinical feature: 'PATHOLOGY.T'
| PATHOLOGY.T | Mean (SD) | 2.79 (0.83) |
| N | ||
| T1 | 6 | |
| T2 | 52 | |
| T3 | 60 | |
| T4 | 33 | |
| Significant markers | N = 19 | |
| pos. correlated | 3 | |
| neg. correlated | 16 |
Table S8. Get Full Table List of top 10 genes significantly correlated to 'PATHOLOGY.T' by Spearman correlation test
| SpearmanCorr | corrP | Q | |
|---|---|---|---|
| HSA-MIR-200B | -0.4115 | 1.527e-07 | 8.14e-05 |
| HSA-MIR-217 | 0.3705 | 2.831e-06 | 0.00151 |
| HSA-MIR-143 | 0.3675 | 3.446e-06 | 0.00183 |
| HSA-MIR-200C | -0.3593 | 5.865e-06 | 0.00311 |
| HSA-MIR-429 | -0.3482 | 1.177e-05 | 0.00623 |
| HSA-MIR-25 | -0.3471 | 1.264e-05 | 0.00667 |
| HSA-MIR-200A | -0.3465 | 1.313e-05 | 0.00692 |
| HSA-MIR-191 | -0.3449 | 1.442e-05 | 0.00759 |
| HSA-MIR-141 | -0.3334 | 2.868e-05 | 0.0151 |
| HSA-MIR-7-1 | -0.3331 | 2.929e-05 | 0.0153 |
Figure S3. Get High-res Image As an example, this figure shows the association of HSA-MIR-200B to 'PATHOLOGY.T'. P value = 1.53e-07 with Spearman correlation analysis.
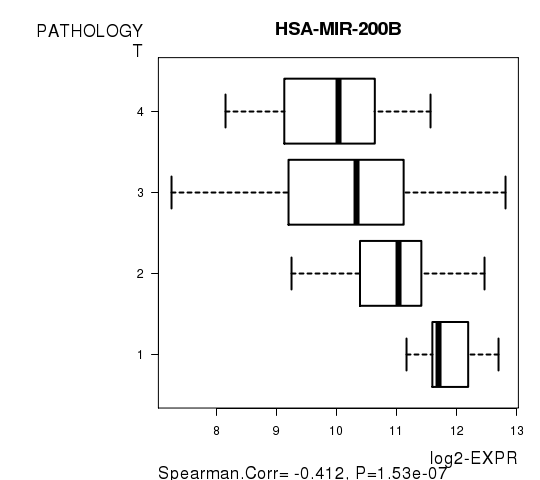
Table S9. Basic characteristics of clinical feature: 'PATHOLOGY.N'
| PATHOLOGY.N | Mean (SD) | 1.07 (1) |
| N | ||
| N0 | 51 | |
| N1 | 56 | |
| N2 | 24 | |
| N3 | 19 | |
| Significant markers | N = 0 |
Table S10. Basic characteristics of clinical feature: 'PATHOLOGICSPREAD(M)'
| PATHOLOGICSPREAD(M) | Labels | N |
| M0 | 132 | |
| M1 | 18 | |
| MX | 11 | |
| Significant markers | N = 0 |
Table S11. Basic characteristics of clinical feature: 'TUMOR.STAGE'
| TUMOR.STAGE | Mean (SD) | 2.56 (1) |
| N | ||
| Stage 1 | 25 | |
| Stage 2 | 43 | |
| Stage 3 | 48 | |
| Stage 4 | 29 | |
| Significant markers | N = 0 |
4 genes related to 'RADIATIONS.RADIATION.REGIMENINDICATION'.
Table S12. Basic characteristics of clinical feature: 'RADIATIONS.RADIATION.REGIMENINDICATION'
| RADIATIONS.RADIATION.REGIMENINDICATION | Labels | N |
| NO | 5 | |
| YES | 156 | |
| Significant markers | N = 4 | |
| Higher in YES | 4 | |
| Higher in NO | 0 |
Table S13. Get Full Table List of 4 genes differentially expressed by 'RADIATIONS.RADIATION.REGIMENINDICATION'
| T(pos if higher in 'YES') | ttestP | Q | AUC | |
|---|---|---|---|---|
| HSA-MIR-3150 | 7.14 | 2.166e-08 | 1.03e-05 | 0.8095 |
| HSA-MIR-23A | 8.29 | 1.728e-06 | 0.000817 | 0.8615 |
| HSA-MIR-548F-1 | 7.39 | 2.199e-06 | 0.00104 | 0.8862 |
| HSA-MIR-559 | 7.28 | 1.11e-05 | 0.00523 | 0.8583 |
Figure S4. Get High-res Image As an example, this figure shows the association of HSA-MIR-3150 to 'RADIATIONS.RADIATION.REGIMENINDICATION'. P value = 2.17e-08 with T-test analysis.
-
Expresson data file = STAD-TP.miRseq_RPKM_log2.txt
-
Clinical data file = STAD-TP.clin.merged.picked.txt
-
Number of patients = 161
-
Number of genes = 533
-
Number of clinical features = 9
For survival clinical features, Wald's test in univariate Cox regression analysis with proportional hazards model (Andersen and Gill 1982) was used to estimate the P values using the 'coxph' function in R. Kaplan-Meier survival curves were plot using the four quartile subgroups of patients based on expression levels
For continuous numerical clinical features, Spearman's rank correlation coefficients (Spearman 1904) and two-tailed P values were estimated using 'cor.test' function in R
For two-class clinical features, two-tailed Student's t test with unequal variance (Lehmann and Romano 2005) was applied to compare the log2-expression levels between the two clinical classes using 't.test' function in R
For multi-class clinical features (ordinal or nominal), one-way analysis of variance (Howell 2002) was applied to compare the log2-expression levels between different clinical classes using 'anova' function in R
For multiple hypothesis correction, Q value is the False Discovery Rate (FDR) analogue of the P value (Benjamini and Hochberg 1995), defined as the minimum FDR at which the test may be called significant. We used the 'Benjamini and Hochberg' method of 'p.adjust' function in R to convert P values into Q values.
This is an experimental feature. The full results of the analysis summarized in this report can be downloaded from the TCGA Data Coordination Center.