This pipeline computes the correlation between significant arm-level copy number variations (cnvs) and selected clinical features.
Testing the association between copy number variation 36 arm-level results and 15 clinical features across 284 patients, 27 significant findings detected with Q value < 0.25.
-
4p gain cnv correlated to 'NUMBER.OF.LYMPH.NODES'.
-
4q gain cnv correlated to 'NUMBER.OF.LYMPH.NODES'.
-
5p gain cnv correlated to 'NUMBER.OF.LYMPH.NODES'.
-
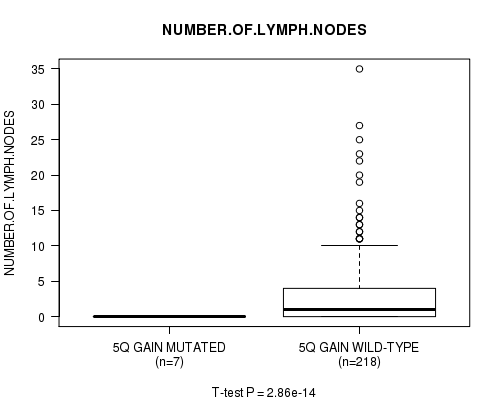
5q gain cnv correlated to 'NUMBER.OF.LYMPH.NODES'.
-
7p gain cnv correlated to 'NUMBER.OF.LYMPH.NODES'.
-
7q gain cnv correlated to 'NUMBER.OF.LYMPH.NODES'.
-
12p gain cnv correlated to 'NUMBER.OF.LYMPH.NODES'.
-
12q gain cnv correlated to 'NUMBER.OF.LYMPH.NODES'.
-
14q gain cnv correlated to 'NUMBER.OF.LYMPH.NODES'.
-
16p gain cnv correlated to 'NUMBER.OF.LYMPH.NODES'.
-
16q gain cnv correlated to 'NUMBER.OF.LYMPH.NODES'.
-
17p gain cnv correlated to 'NUMBER.OF.LYMPH.NODES'.
-
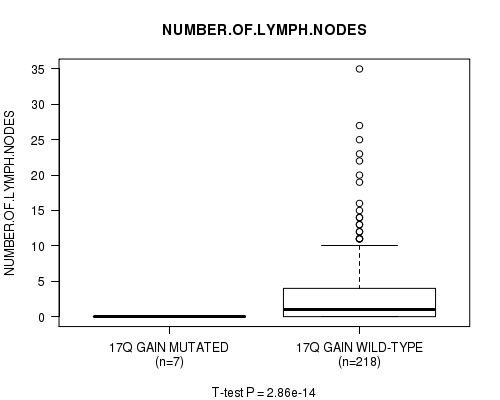
17q gain cnv correlated to 'NUMBER.OF.LYMPH.NODES'.
-
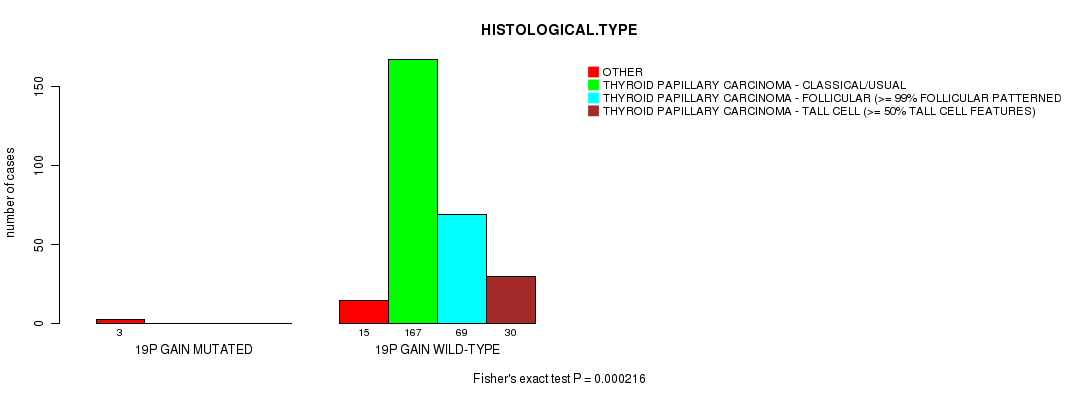
19p gain cnv correlated to 'HISTOLOGICAL.TYPE' and 'NUMBER.OF.LYMPH.NODES'.
-
19q gain cnv correlated to 'NUMBER.OF.LYMPH.NODES'.
-
20p gain cnv correlated to 'NUMBER.OF.LYMPH.NODES'.
-
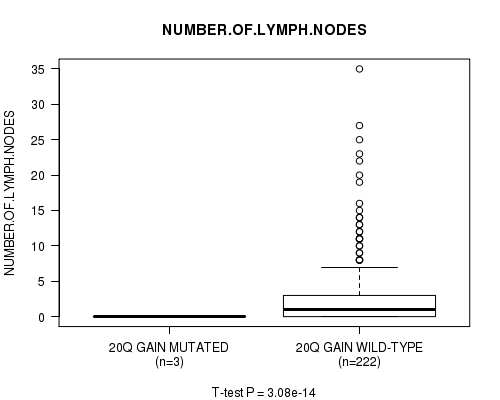
20q gain cnv correlated to 'NUMBER.OF.LYMPH.NODES'.
-
2p loss cnv correlated to 'NUMBER.OF.LYMPH.NODES'.
-
2q loss cnv correlated to 'NUMBER.OF.LYMPH.NODES'.
-
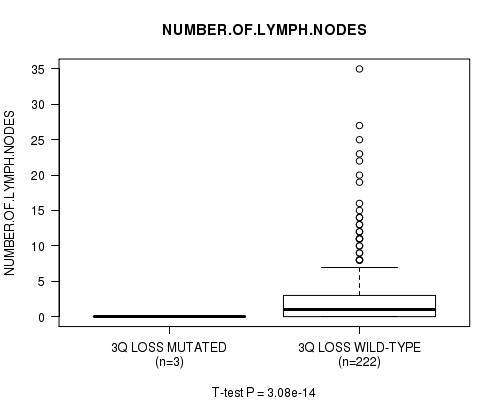
3q loss cnv correlated to 'NUMBER.OF.LYMPH.NODES'.
-
9p loss cnv correlated to 'NEOPLASM.DISEASESTAGE'.
-
9q loss cnv correlated to 'NEOPLASM.DISEASESTAGE'.
-
11p loss cnv correlated to 'NUMBER.OF.LYMPH.NODES'.
-
11q loss cnv correlated to 'NUMBER.OF.LYMPH.NODES'.
-
13q loss cnv correlated to 'NUMBER.OF.LYMPH.NODES'.
-
15q loss cnv correlated to 'NUMBER.OF.LYMPH.NODES'.
Table 1. Get Full Table Overview of the association between significant copy number variation of 36 arm-level results and 15 clinical features. Shown in the table are P values (Q values). Thresholded by Q value < 0.25, 27 significant findings detected.
|
Clinical Features |
Time to Death |
AGE | GENDER |
HISTOLOGICAL TYPE |
RADIATIONS RADIATION REGIMENINDICATION |
RADIATIONEXPOSURE |
DISTANT METASTASIS |
EXTRATHYROIDAL EXTENSION |
LYMPH NODE METASTASIS |
COMPLETENESS OF RESECTION |
NUMBER OF LYMPH NODES |
TUMOR STAGECODE |
NEOPLASM DISEASESTAGE |
MULTIFOCALITY |
TUMOR SIZE |
||
| nCNV (%) | nWild-Type | logrank test | t-test | Fisher's exact test | Fisher's exact test | Fisher's exact test | Fisher's exact test | Fisher's exact test | Fisher's exact test | Chi-square test | Fisher's exact test | t-test | t-test | Chi-square test | Fisher's exact test | t-test | |
| 19p gain | 3 (1%) | 281 |
1 (1.00) |
0.188 (1.00) |
0.572 (1.00) |
0.000216 (0.102) |
1 (1.00) |
1 (1.00) |
0.288 (1.00) |
1 (1.00) |
0.516 (1.00) |
0.4 (1.00) |
3.08e-14 (1.47e-11) |
0.722 (1.00) |
1 (1.00) |
0.593 (1.00) |
|
| 4p gain | 4 (1%) | 280 |
0.00468 (1.00) |
0.119 (1.00) |
1 (1.00) |
0.367 (1.00) |
0.184 (1.00) |
1 (1.00) |
0.18 (1.00) |
1 (1.00) |
0.36 (1.00) |
0.494 (1.00) |
3.02e-14 (1.46e-11) |
0.515 (1.00) |
0.622 (1.00) |
0.479 (1.00) |
|
| 4q gain | 4 (1%) | 280 |
0.00468 (1.00) |
0.119 (1.00) |
1 (1.00) |
0.367 (1.00) |
0.184 (1.00) |
1 (1.00) |
0.18 (1.00) |
1 (1.00) |
0.36 (1.00) |
0.494 (1.00) |
3.02e-14 (1.46e-11) |
0.515 (1.00) |
0.622 (1.00) |
0.479 (1.00) |
|
| 5p gain | 8 (3%) | 276 |
0.00468 (1.00) |
0.0796 (1.00) |
1 (1.00) |
0.0225 (1.00) |
0.336 (1.00) |
1 (1.00) |
0.0177 (1.00) |
0.729 (1.00) |
0.195 (1.00) |
0.747 (1.00) |
2.86e-14 (1.41e-11) |
0.0847 (1.00) |
0.723 (1.00) |
0.0691 (1.00) |
|
| 5q gain | 8 (3%) | 276 |
0.00468 (1.00) |
0.0796 (1.00) |
1 (1.00) |
0.0225 (1.00) |
0.336 (1.00) |
1 (1.00) |
0.0177 (1.00) |
0.729 (1.00) |
0.195 (1.00) |
0.747 (1.00) |
2.86e-14 (1.41e-11) |
0.0847 (1.00) |
0.723 (1.00) |
0.0691 (1.00) |
|
| 7p gain | 10 (4%) | 274 |
1 (1.00) |
0.0831 (1.00) |
1 (1.00) |
0.0347 (1.00) |
1 (1.00) |
1 (1.00) |
0.086 (1.00) |
0.553 (1.00) |
0.0908 (1.00) |
0.348 (1.00) |
2.75e-14 (1.37e-11) |
0.0372 (1.00) |
0.749 (1.00) |
0.187 (1.00) |
|
| 7q gain | 12 (4%) | 272 |
1 (1.00) |
0.0477 (1.00) |
0.737 (1.00) |
0.00469 (1.00) |
1 (1.00) |
1 (1.00) |
0.152 (1.00) |
0.79 (1.00) |
0.0499 (1.00) |
0.147 (1.00) |
2.75e-14 (1.37e-11) |
0.0723 (1.00) |
0.769 (1.00) |
0.186 (1.00) |
|
| 12p gain | 9 (3%) | 275 |
1 (1.00) |
0.286 (1.00) |
0.455 (1.00) |
0.019 (1.00) |
1 (1.00) |
1 (1.00) |
0.0125 (1.00) |
0.74 (1.00) |
0.152 (1.00) |
0.788 (1.00) |
2.86e-14 (1.41e-11) |
0.271 (1.00) |
1 (1.00) |
0.389 (1.00) |
|
| 12q gain | 9 (3%) | 275 |
1 (1.00) |
0.286 (1.00) |
0.455 (1.00) |
0.019 (1.00) |
1 (1.00) |
1 (1.00) |
0.0125 (1.00) |
0.74 (1.00) |
0.152 (1.00) |
0.788 (1.00) |
2.86e-14 (1.41e-11) |
0.271 (1.00) |
1 (1.00) |
0.389 (1.00) |
|
| 14q gain | 5 (2%) | 279 |
1 (1.00) |
0.536 (1.00) |
0.333 (1.00) |
0.0744 (1.00) |
1 (1.00) |
1 (1.00) |
0.132 (1.00) |
1 (1.00) |
0.464 (1.00) |
0.575 (1.00) |
3.02e-14 (1.46e-11) |
0.346 (1.00) |
0.37 (1.00) |
0.458 (1.00) |
|
| 16p gain | 7 (2%) | 277 |
1 (1.00) |
0.499 (1.00) |
0.196 (1.00) |
0.149 (1.00) |
1 (1.00) |
1 (1.00) |
0.519 (1.00) |
0.717 (1.00) |
0.202 (1.00) |
0.201 (1.00) |
2.97e-14 (1.44e-11) |
0.559 (1.00) |
0.723 (1.00) |
0.494 (1.00) |
|
| 16q gain | 5 (2%) | 279 |
1 (1.00) |
0.339 (1.00) |
0.333 (1.00) |
0.494 (1.00) |
1 (1.00) |
1 (1.00) |
0.429 (1.00) |
1 (1.00) |
0.464 (1.00) |
0.575 (1.00) |
3.02e-14 (1.46e-11) |
0.346 (1.00) |
1 (1.00) |
0.412 (1.00) |
|
| 17p gain | 7 (2%) | 277 |
1 (1.00) |
0.533 (1.00) |
0.196 (1.00) |
0.0189 (1.00) |
1 (1.00) |
1 (1.00) |
0.219 (1.00) |
0.3 (1.00) |
0.273 (1.00) |
0.699 (1.00) |
2.91e-14 (1.42e-11) |
0.113 (1.00) |
1 (1.00) |
0.504 (1.00) |
|
| 17q gain | 8 (3%) | 276 |
1 (1.00) |
0.746 (1.00) |
0.118 (1.00) |
0.0261 (1.00) |
1 (1.00) |
1 (1.00) |
0.18 (1.00) |
0.317 (1.00) |
0.195 (1.00) |
0.747 (1.00) |
2.86e-14 (1.41e-11) |
0.184 (1.00) |
1 (1.00) |
0.796 (1.00) |
|
| 19q gain | 4 (1%) | 280 |
0.00468 (1.00) |
0.0704 (1.00) |
1 (1.00) |
0.00146 (0.683) |
0.184 (1.00) |
1 (1.00) |
0.18 (1.00) |
0.606 (1.00) |
0.36 (1.00) |
0.494 (1.00) |
3.02e-14 (1.46e-11) |
0.515 (1.00) |
1 (1.00) |
0.344 (1.00) |
|
| 20p gain | 4 (1%) | 280 |
1 (1.00) |
0.562 (1.00) |
0.575 (1.00) |
0.0455 (1.00) |
1 (1.00) |
1 (1.00) |
0.18 (1.00) |
0.606 (1.00) |
0.545 (1.00) |
1 (1.00) |
3.08e-14 (1.47e-11) |
0.164 (1.00) |
1 (1.00) |
0.124 (1.00) |
|
| 20q gain | 4 (1%) | 280 |
1 (1.00) |
0.562 (1.00) |
0.575 (1.00) |
0.0455 (1.00) |
1 (1.00) |
1 (1.00) |
0.18 (1.00) |
0.606 (1.00) |
0.545 (1.00) |
1 (1.00) |
3.08e-14 (1.47e-11) |
0.164 (1.00) |
1 (1.00) |
0.124 (1.00) |
|
| 2p loss | 7 (2%) | 277 |
1 (1.00) |
0.195 (1.00) |
0.682 (1.00) |
0.0414 (1.00) |
1 (1.00) |
1 (1.00) |
0.219 (1.00) |
0.3 (1.00) |
0.103 (1.00) |
0.699 (1.00) |
2.86e-14 (1.41e-11) |
0.00421 (1.00) |
1 (1.00) |
0.948 (1.00) |
|
| 2q loss | 6 (2%) | 278 |
1 (1.00) |
0.0385 (1.00) |
1 (1.00) |
0.0165 (1.00) |
1 (1.00) |
1 (1.00) |
0.295 (1.00) |
0.411 (1.00) |
0.16 (1.00) |
0.642 (1.00) |
2.91e-14 (1.42e-11) |
0.000772 (0.363) |
0.684 (1.00) |
0.439 (1.00) |
|
| 3q loss | 3 (1%) | 281 |
1 (1.00) |
0.204 (1.00) |
1 (1.00) |
0.057 (1.00) |
1 (1.00) |
1 (1.00) |
0.288 (1.00) |
1 (1.00) |
0.516 (1.00) |
1 (1.00) |
3.08e-14 (1.47e-11) |
0.0339 (1.00) |
1 (1.00) |
0.17 (1.00) |
|
| 9p loss | 5 (2%) | 279 |
1 (1.00) |
0.909 (1.00) |
0.333 (1.00) |
0.494 (1.00) |
1 (1.00) |
1 (1.00) |
1 (1.00) |
0.4 (1.00) |
0.54 (1.00) |
1 (1.00) |
0.439 (1.00) |
7.71e-05 (0.0364) |
0.684 (1.00) |
0.863 (1.00) |
|
| 9q loss | 7 (2%) | 277 |
1 (1.00) |
0.347 (1.00) |
0.682 (1.00) |
0.149 (1.00) |
0.301 (1.00) |
0.275 (1.00) |
0.519 (1.00) |
0.3 (1.00) |
0.521 (1.00) |
1 (1.00) |
0.76 (1.00) |
1.88e-05 (0.00888) |
0.723 (1.00) |
0.985 (1.00) |
|
| 11p loss | 4 (1%) | 280 |
0.00468 (1.00) |
0.031 (1.00) |
0.273 (1.00) |
0.145 (1.00) |
0.184 (1.00) |
1 (1.00) |
0.18 (1.00) |
0.606 (1.00) |
0.36 (1.00) |
0.494 (1.00) |
3.02e-14 (1.46e-11) |
0.515 (1.00) |
0.622 (1.00) |
0.238 (1.00) |
|
| 11q loss | 5 (2%) | 279 |
0.00468 (1.00) |
0.0187 (1.00) |
0.109 (1.00) |
0.085 (1.00) |
0.225 (1.00) |
1 (1.00) |
0.132 (1.00) |
0.4 (1.00) |
0.243 (1.00) |
0.575 (1.00) |
2.97e-14 (1.44e-11) |
0.186 (1.00) |
1 (1.00) |
0.238 (1.00) |
|
| 13q loss | 9 (3%) | 275 |
0.00468 (1.00) |
0.0339 (1.00) |
0.242 (1.00) |
0.0631 (1.00) |
0.37 (1.00) |
0.00325 (1.00) |
0.391 (1.00) |
0.74 (1.00) |
0.135 (1.00) |
0.431 (1.00) |
2.81e-14 (1.39e-11) |
0.173 (1.00) |
0.501 (1.00) |
0.478 (1.00) |
|
| 15q loss | 3 (1%) | 281 |
1 (1.00) |
0.412 (1.00) |
0.572 (1.00) |
0.0431 (1.00) |
1 (1.00) |
1 (1.00) |
0.288 (1.00) |
1 (1.00) |
0.516 (1.00) |
1 (1.00) |
3.08e-14 (1.47e-11) |
0.0339 (1.00) |
1 (1.00) |
0.407 (1.00) |
|
| 1q gain | 8 (3%) | 276 |
1 (1.00) |
0.166 (1.00) |
0.428 (1.00) |
0.311 (1.00) |
0.336 (1.00) |
1 (1.00) |
0.765 (1.00) |
0.00282 (1.00) |
0.319 (1.00) |
0.309 (1.00) |
0.452 (1.00) |
0.0796 (1.00) |
0.172 (1.00) |
0.681 (1.00) |
|
| 11p gain | 3 (1%) | 281 |
1 (1.00) |
0.725 (1.00) |
1 (1.00) |
0.0141 (1.00) |
1 (1.00) |
1 (1.00) |
0.288 (1.00) |
1 (1.00) |
0.566 (1.00) |
1 (1.00) |
0.446 (1.00) |
0.622 (1.00) |
0.0135 (1.00) |
||
| 1p loss | 3 (1%) | 281 |
1 (1.00) |
0.184 (1.00) |
0.572 (1.00) |
0.435 (1.00) |
1 (1.00) |
1 (1.00) |
1 (1.00) |
1 (1.00) |
0.516 (1.00) |
1 (1.00) |
0.0339 (1.00) |
0.622 (1.00) |
|||
| 10p loss | 3 (1%) | 281 |
1 (1.00) |
0.0334 (1.00) |
1 (1.00) |
0.435 (1.00) |
1 (1.00) |
1 (1.00) |
1 (1.00) |
1 (1.00) |
0.516 (1.00) |
1 (1.00) |
0.0339 (1.00) |
1 (1.00) |
|||
| 10q loss | 3 (1%) | 281 |
1 (1.00) |
0.0334 (1.00) |
1 (1.00) |
0.435 (1.00) |
1 (1.00) |
1 (1.00) |
1 (1.00) |
1 (1.00) |
0.516 (1.00) |
1 (1.00) |
0.0339 (1.00) |
1 (1.00) |
|||
| 17p loss | 4 (1%) | 280 |
1 (1.00) |
0.537 (1.00) |
0.575 (1.00) |
0.802 (1.00) |
0.0128 (1.00) |
1 (1.00) |
0.652 (1.00) |
0.0446 (1.00) |
0.213 (1.00) |
1 (1.00) |
0.556 (1.00) |
0.0835 (1.00) |
0.37 (1.00) |
0.242 (1.00) |
|
| 18p loss | 3 (1%) | 281 |
1 (1.00) |
0.958 (1.00) |
0.572 (1.00) |
1 (1.00) |
1 (1.00) |
1 (1.00) |
1 (1.00) |
1 (1.00) |
0.865 (1.00) |
1 (1.00) |
0.0561 (1.00) |
0.0502 (1.00) |
0.622 (1.00) |
0.976 (1.00) |
|
| 18q loss | 3 (1%) | 281 |
1 (1.00) |
0.958 (1.00) |
0.572 (1.00) |
1 (1.00) |
1 (1.00) |
1 (1.00) |
1 (1.00) |
1 (1.00) |
0.865 (1.00) |
1 (1.00) |
0.0561 (1.00) |
0.0502 (1.00) |
0.622 (1.00) |
0.976 (1.00) |
|
| 21q loss | 5 (2%) | 279 |
1 (1.00) |
0.0273 (1.00) |
0.606 (1.00) |
0.318 (1.00) |
1 (1.00) |
1 (1.00) |
0.429 (1.00) |
0.4 (1.00) |
0.54 (1.00) |
0.575 (1.00) |
0.993 (1.00) |
0.00626 (1.00) |
0.37 (1.00) |
0.797 (1.00) |
|
| 22q loss | 36 (13%) | 248 |
1 (1.00) |
0.408 (1.00) |
1 (1.00) |
0.00112 (0.526) |
0.229 (1.00) |
1 (1.00) |
0.402 (1.00) |
0.135 (1.00) |
0.17 (1.00) |
0.551 (1.00) |
0.462 (1.00) |
0.545 (1.00) |
0.21 (1.00) |
0.627 (1.00) |
P value = 3.02e-14 (t-test), Q value = 1.5e-11
Table S1. Gene #2: '4p gain mutation analysis' versus Clinical Feature #11: 'NUMBER.OF.LYMPH.NODES'
| nPatients | Mean (Std.Dev) | |
|---|---|---|
| ALL | 225 | 2.8 (5.2) |
| 4P GAIN MUTATED | 4 | 0.0 (0.0) |
| 4P GAIN WILD-TYPE | 221 | 2.9 (5.3) |
Figure S1. Get High-res Image Gene #2: '4p gain mutation analysis' versus Clinical Feature #11: 'NUMBER.OF.LYMPH.NODES'

P value = 3.02e-14 (t-test), Q value = 1.5e-11
Table S2. Gene #3: '4q gain mutation analysis' versus Clinical Feature #11: 'NUMBER.OF.LYMPH.NODES'
| nPatients | Mean (Std.Dev) | |
|---|---|---|
| ALL | 225 | 2.8 (5.2) |
| 4Q GAIN MUTATED | 4 | 0.0 (0.0) |
| 4Q GAIN WILD-TYPE | 221 | 2.9 (5.3) |
Figure S2. Get High-res Image Gene #3: '4q gain mutation analysis' versus Clinical Feature #11: 'NUMBER.OF.LYMPH.NODES'

P value = 2.86e-14 (t-test), Q value = 1.4e-11
Table S3. Gene #4: '5p gain mutation analysis' versus Clinical Feature #11: 'NUMBER.OF.LYMPH.NODES'
| nPatients | Mean (Std.Dev) | |
|---|---|---|
| ALL | 225 | 2.8 (5.2) |
| 5P GAIN MUTATED | 7 | 0.0 (0.0) |
| 5P GAIN WILD-TYPE | 218 | 2.9 (5.3) |
Figure S3. Get High-res Image Gene #4: '5p gain mutation analysis' versus Clinical Feature #11: 'NUMBER.OF.LYMPH.NODES'

P value = 2.86e-14 (t-test), Q value = 1.4e-11
Table S4. Gene #5: '5q gain mutation analysis' versus Clinical Feature #11: 'NUMBER.OF.LYMPH.NODES'
| nPatients | Mean (Std.Dev) | |
|---|---|---|
| ALL | 225 | 2.8 (5.2) |
| 5Q GAIN MUTATED | 7 | 0.0 (0.0) |
| 5Q GAIN WILD-TYPE | 218 | 2.9 (5.3) |
Figure S4. Get High-res Image Gene #5: '5q gain mutation analysis' versus Clinical Feature #11: 'NUMBER.OF.LYMPH.NODES'
P value = 2.75e-14 (t-test), Q value = 1.4e-11
Table S5. Gene #6: '7p gain mutation analysis' versus Clinical Feature #11: 'NUMBER.OF.LYMPH.NODES'
| nPatients | Mean (Std.Dev) | |
|---|---|---|
| ALL | 225 | 2.8 (5.2) |
| 7P GAIN MUTATED | 9 | 0.0 (0.0) |
| 7P GAIN WILD-TYPE | 216 | 2.9 (5.3) |
Figure S5. Get High-res Image Gene #6: '7p gain mutation analysis' versus Clinical Feature #11: 'NUMBER.OF.LYMPH.NODES'

P value = 2.75e-14 (t-test), Q value = 1.4e-11
Table S6. Gene #7: '7q gain mutation analysis' versus Clinical Feature #11: 'NUMBER.OF.LYMPH.NODES'
| nPatients | Mean (Std.Dev) | |
|---|---|---|
| ALL | 225 | 2.8 (5.2) |
| 7Q GAIN MUTATED | 9 | 0.0 (0.0) |
| 7Q GAIN WILD-TYPE | 216 | 2.9 (5.3) |
Figure S6. Get High-res Image Gene #7: '7q gain mutation analysis' versus Clinical Feature #11: 'NUMBER.OF.LYMPH.NODES'

P value = 2.86e-14 (t-test), Q value = 1.4e-11
Table S7. Gene #9: '12p gain mutation analysis' versus Clinical Feature #11: 'NUMBER.OF.LYMPH.NODES'
| nPatients | Mean (Std.Dev) | |
|---|---|---|
| ALL | 225 | 2.8 (5.2) |
| 12P GAIN MUTATED | 7 | 0.0 (0.0) |
| 12P GAIN WILD-TYPE | 218 | 2.9 (5.3) |
Figure S7. Get High-res Image Gene #9: '12p gain mutation analysis' versus Clinical Feature #11: 'NUMBER.OF.LYMPH.NODES'

P value = 2.86e-14 (t-test), Q value = 1.4e-11
Table S8. Gene #10: '12q gain mutation analysis' versus Clinical Feature #11: 'NUMBER.OF.LYMPH.NODES'
| nPatients | Mean (Std.Dev) | |
|---|---|---|
| ALL | 225 | 2.8 (5.2) |
| 12Q GAIN MUTATED | 7 | 0.0 (0.0) |
| 12Q GAIN WILD-TYPE | 218 | 2.9 (5.3) |
Figure S8. Get High-res Image Gene #10: '12q gain mutation analysis' versus Clinical Feature #11: 'NUMBER.OF.LYMPH.NODES'

P value = 3.02e-14 (t-test), Q value = 1.5e-11
Table S9. Gene #11: '14q gain mutation analysis' versus Clinical Feature #11: 'NUMBER.OF.LYMPH.NODES'
| nPatients | Mean (Std.Dev) | |
|---|---|---|
| ALL | 225 | 2.8 (5.2) |
| 14Q GAIN MUTATED | 4 | 0.0 (0.0) |
| 14Q GAIN WILD-TYPE | 221 | 2.9 (5.3) |
Figure S9. Get High-res Image Gene #11: '14q gain mutation analysis' versus Clinical Feature #11: 'NUMBER.OF.LYMPH.NODES'

P value = 2.97e-14 (t-test), Q value = 1.4e-11
Table S10. Gene #12: '16p gain mutation analysis' versus Clinical Feature #11: 'NUMBER.OF.LYMPH.NODES'
| nPatients | Mean (Std.Dev) | |
|---|---|---|
| ALL | 225 | 2.8 (5.2) |
| 16P GAIN MUTATED | 5 | 0.0 (0.0) |
| 16P GAIN WILD-TYPE | 220 | 2.9 (5.3) |
Figure S10. Get High-res Image Gene #12: '16p gain mutation analysis' versus Clinical Feature #11: 'NUMBER.OF.LYMPH.NODES'

P value = 3.02e-14 (t-test), Q value = 1.5e-11
Table S11. Gene #13: '16q gain mutation analysis' versus Clinical Feature #11: 'NUMBER.OF.LYMPH.NODES'
| nPatients | Mean (Std.Dev) | |
|---|---|---|
| ALL | 225 | 2.8 (5.2) |
| 16Q GAIN MUTATED | 4 | 0.0 (0.0) |
| 16Q GAIN WILD-TYPE | 221 | 2.9 (5.3) |
Figure S11. Get High-res Image Gene #13: '16q gain mutation analysis' versus Clinical Feature #11: 'NUMBER.OF.LYMPH.NODES'

P value = 2.91e-14 (t-test), Q value = 1.4e-11
Table S12. Gene #14: '17p gain mutation analysis' versus Clinical Feature #11: 'NUMBER.OF.LYMPH.NODES'
| nPatients | Mean (Std.Dev) | |
|---|---|---|
| ALL | 225 | 2.8 (5.2) |
| 17P GAIN MUTATED | 6 | 0.0 (0.0) |
| 17P GAIN WILD-TYPE | 219 | 2.9 (5.3) |
Figure S12. Get High-res Image Gene #14: '17p gain mutation analysis' versus Clinical Feature #11: 'NUMBER.OF.LYMPH.NODES'

P value = 2.86e-14 (t-test), Q value = 1.4e-11
Table S13. Gene #15: '17q gain mutation analysis' versus Clinical Feature #11: 'NUMBER.OF.LYMPH.NODES'
| nPatients | Mean (Std.Dev) | |
|---|---|---|
| ALL | 225 | 2.8 (5.2) |
| 17Q GAIN MUTATED | 7 | 0.0 (0.0) |
| 17Q GAIN WILD-TYPE | 218 | 2.9 (5.3) |
Figure S13. Get High-res Image Gene #15: '17q gain mutation analysis' versus Clinical Feature #11: 'NUMBER.OF.LYMPH.NODES'
P value = 0.000216 (Fisher's exact test), Q value = 0.1
Table S14. Gene #16: '19p gain mutation analysis' versus Clinical Feature #4: 'HISTOLOGICAL.TYPE'
| nPatients | OTHER | THYROID PAPILLARY CARCINOMA - CLASSICAL/USUAL | THYROID PAPILLARY CARCINOMA - FOLLICULAR (>= 99% FOLLICULAR PATTERNED) | THYROID PAPILLARY CARCINOMA - TALL CELL (>= 50% TALL CELL FEATURES) |
|---|---|---|---|---|
| ALL | 18 | 167 | 69 | 30 |
| 19P GAIN MUTATED | 3 | 0 | 0 | 0 |
| 19P GAIN WILD-TYPE | 15 | 167 | 69 | 30 |
Figure S14. Get High-res Image Gene #16: '19p gain mutation analysis' versus Clinical Feature #4: 'HISTOLOGICAL.TYPE'
P value = 3.08e-14 (t-test), Q value = 1.5e-11
Table S15. Gene #16: '19p gain mutation analysis' versus Clinical Feature #11: 'NUMBER.OF.LYMPH.NODES'
| nPatients | Mean (Std.Dev) | |
|---|---|---|
| ALL | 225 | 2.8 (5.2) |
| 19P GAIN MUTATED | 3 | 0.0 (0.0) |
| 19P GAIN WILD-TYPE | 222 | 2.9 (5.3) |
Figure S15. Get High-res Image Gene #16: '19p gain mutation analysis' versus Clinical Feature #11: 'NUMBER.OF.LYMPH.NODES'

P value = 3.02e-14 (t-test), Q value = 1.5e-11
Table S16. Gene #17: '19q gain mutation analysis' versus Clinical Feature #11: 'NUMBER.OF.LYMPH.NODES'
| nPatients | Mean (Std.Dev) | |
|---|---|---|
| ALL | 225 | 2.8 (5.2) |
| 19Q GAIN MUTATED | 4 | 0.0 (0.0) |
| 19Q GAIN WILD-TYPE | 221 | 2.9 (5.3) |
Figure S16. Get High-res Image Gene #17: '19q gain mutation analysis' versus Clinical Feature #11: 'NUMBER.OF.LYMPH.NODES'

P value = 3.08e-14 (t-test), Q value = 1.5e-11
Table S17. Gene #18: '20p gain mutation analysis' versus Clinical Feature #11: 'NUMBER.OF.LYMPH.NODES'
| nPatients | Mean (Std.Dev) | |
|---|---|---|
| ALL | 225 | 2.8 (5.2) |
| 20P GAIN MUTATED | 3 | 0.0 (0.0) |
| 20P GAIN WILD-TYPE | 222 | 2.9 (5.3) |
Figure S17. Get High-res Image Gene #18: '20p gain mutation analysis' versus Clinical Feature #11: 'NUMBER.OF.LYMPH.NODES'

P value = 3.08e-14 (t-test), Q value = 1.5e-11
Table S18. Gene #19: '20q gain mutation analysis' versus Clinical Feature #11: 'NUMBER.OF.LYMPH.NODES'
| nPatients | Mean (Std.Dev) | |
|---|---|---|
| ALL | 225 | 2.8 (5.2) |
| 20Q GAIN MUTATED | 3 | 0.0 (0.0) |
| 20Q GAIN WILD-TYPE | 222 | 2.9 (5.3) |
Figure S18. Get High-res Image Gene #19: '20q gain mutation analysis' versus Clinical Feature #11: 'NUMBER.OF.LYMPH.NODES'
P value = 2.86e-14 (t-test), Q value = 1.4e-11
Table S19. Gene #21: '2p loss mutation analysis' versus Clinical Feature #11: 'NUMBER.OF.LYMPH.NODES'
| nPatients | Mean (Std.Dev) | |
|---|---|---|
| ALL | 225 | 2.8 (5.2) |
| 2P LOSS MUTATED | 7 | 0.0 (0.0) |
| 2P LOSS WILD-TYPE | 218 | 2.9 (5.3) |
Figure S19. Get High-res Image Gene #21: '2p loss mutation analysis' versus Clinical Feature #11: 'NUMBER.OF.LYMPH.NODES'

P value = 2.91e-14 (t-test), Q value = 1.4e-11
Table S20. Gene #22: '2q loss mutation analysis' versus Clinical Feature #11: 'NUMBER.OF.LYMPH.NODES'
| nPatients | Mean (Std.Dev) | |
|---|---|---|
| ALL | 225 | 2.8 (5.2) |
| 2Q LOSS MUTATED | 6 | 0.0 (0.0) |
| 2Q LOSS WILD-TYPE | 219 | 2.9 (5.3) |
Figure S20. Get High-res Image Gene #22: '2q loss mutation analysis' versus Clinical Feature #11: 'NUMBER.OF.LYMPH.NODES'

P value = 3.08e-14 (t-test), Q value = 1.5e-11
Table S21. Gene #23: '3q loss mutation analysis' versus Clinical Feature #11: 'NUMBER.OF.LYMPH.NODES'
| nPatients | Mean (Std.Dev) | |
|---|---|---|
| ALL | 225 | 2.8 (5.2) |
| 3Q LOSS MUTATED | 3 | 0.0 (0.0) |
| 3Q LOSS WILD-TYPE | 222 | 2.9 (5.3) |
Figure S21. Get High-res Image Gene #23: '3q loss mutation analysis' versus Clinical Feature #11: 'NUMBER.OF.LYMPH.NODES'
P value = 7.71e-05 (Chi-square test), Q value = 0.036
Table S22. Gene #24: '9p loss mutation analysis' versus Clinical Feature #13: 'NEOPLASM.DISEASESTAGE'
| nPatients | STAGE I | STAGE II | STAGE III | STAGE IVA | STAGE IVC |
|---|---|---|---|---|---|
| ALL | 161 | 32 | 62 | 25 | 3 |
| 9P LOSS MUTATED | 1 | 4 | 0 | 0 | 0 |
| 9P LOSS WILD-TYPE | 160 | 28 | 62 | 25 | 3 |
Figure S22. Get High-res Image Gene #24: '9p loss mutation analysis' versus Clinical Feature #13: 'NEOPLASM.DISEASESTAGE'

P value = 1.88e-05 (Chi-square test), Q value = 0.0089
Table S23. Gene #25: '9q loss mutation analysis' versus Clinical Feature #13: 'NEOPLASM.DISEASESTAGE'
| nPatients | STAGE I | STAGE II | STAGE III | STAGE IVA | STAGE IVC |
|---|---|---|---|---|---|
| ALL | 161 | 32 | 62 | 25 | 3 |
| 9Q LOSS MUTATED | 1 | 5 | 0 | 1 | 0 |
| 9Q LOSS WILD-TYPE | 160 | 27 | 62 | 24 | 3 |
Figure S23. Get High-res Image Gene #25: '9q loss mutation analysis' versus Clinical Feature #13: 'NEOPLASM.DISEASESTAGE'

P value = 3.02e-14 (t-test), Q value = 1.5e-11
Table S24. Gene #28: '11p loss mutation analysis' versus Clinical Feature #11: 'NUMBER.OF.LYMPH.NODES'
| nPatients | Mean (Std.Dev) | |
|---|---|---|
| ALL | 225 | 2.8 (5.2) |
| 11P LOSS MUTATED | 4 | 0.0 (0.0) |
| 11P LOSS WILD-TYPE | 221 | 2.9 (5.3) |
Figure S24. Get High-res Image Gene #28: '11p loss mutation analysis' versus Clinical Feature #11: 'NUMBER.OF.LYMPH.NODES'

P value = 2.97e-14 (t-test), Q value = 1.4e-11
Table S25. Gene #29: '11q loss mutation analysis' versus Clinical Feature #11: 'NUMBER.OF.LYMPH.NODES'
| nPatients | Mean (Std.Dev) | |
|---|---|---|
| ALL | 225 | 2.8 (5.2) |
| 11Q LOSS MUTATED | 5 | 0.0 (0.0) |
| 11Q LOSS WILD-TYPE | 220 | 2.9 (5.3) |
Figure S25. Get High-res Image Gene #29: '11q loss mutation analysis' versus Clinical Feature #11: 'NUMBER.OF.LYMPH.NODES'

P value = 2.81e-14 (t-test), Q value = 1.4e-11
Table S26. Gene #30: '13q loss mutation analysis' versus Clinical Feature #11: 'NUMBER.OF.LYMPH.NODES'
| nPatients | Mean (Std.Dev) | |
|---|---|---|
| ALL | 225 | 2.8 (5.2) |
| 13Q LOSS MUTATED | 8 | 0.0 (0.0) |
| 13Q LOSS WILD-TYPE | 217 | 2.9 (5.3) |
Figure S26. Get High-res Image Gene #30: '13q loss mutation analysis' versus Clinical Feature #11: 'NUMBER.OF.LYMPH.NODES'

P value = 3.08e-14 (t-test), Q value = 1.5e-11
Table S27. Gene #31: '15q loss mutation analysis' versus Clinical Feature #11: 'NUMBER.OF.LYMPH.NODES'
| nPatients | Mean (Std.Dev) | |
|---|---|---|
| ALL | 225 | 2.8 (5.2) |
| 15Q LOSS MUTATED | 3 | 0.0 (0.0) |
| 15Q LOSS WILD-TYPE | 222 | 2.9 (5.3) |
Figure S27. Get High-res Image Gene #31: '15q loss mutation analysis' versus Clinical Feature #11: 'NUMBER.OF.LYMPH.NODES'

-
Mutation data file = broad_values_by_arm.mutsig.cluster.txt
-
Clinical data file = THCA-TP.clin.merged.picked.txt
-
Number of patients = 284
-
Number of significantly arm-level cnvs = 36
-
Number of selected clinical features = 15
-
Exclude genes that fewer than K tumors have mutations, K = 3
For survival clinical features, the Kaplan-Meier survival curves of tumors with and without gene mutations were plotted and the statistical significance P values were estimated by logrank test (Bland and Altman 2004) using the 'survdiff' function in R
For continuous numerical clinical features, two-tailed Student's t test with unequal variance (Lehmann and Romano 2005) was applied to compare the clinical values between tumors with and without gene mutations using 't.test' function in R
For binary or multi-class clinical features (nominal or ordinal), two-tailed Fisher's exact tests (Fisher 1922) were used to estimate the P values using the 'fisher.test' function in R
For multi-class clinical features (nominal or ordinal), Chi-square tests (Greenwood and Nikulin 1996) were used to estimate the P values using the 'chisq.test' function in R
For multiple hypothesis correction, Q value is the False Discovery Rate (FDR) analogue of the P value (Benjamini and Hochberg 1995), defined as the minimum FDR at which the test may be called significant. We used the 'Benjamini and Hochberg' method of 'p.adjust' function in R to convert P values into Q values.
This is an experimental feature. The full results of the analysis summarized in this report can be downloaded from the TCGA Data Coordination Center.