This pipeline computes the correlation between significant copy number variation (cnv focal) genes and selected clinical features.
Testing the association between copy number variation 24 arm-level results and 15 clinical features across 284 patients, 15 significant findings detected with Q value < 0.25.
-
Del Peak 2(2p22.3) cnv correlated to 'NUMBER.OF.LYMPH.NODES'.
-
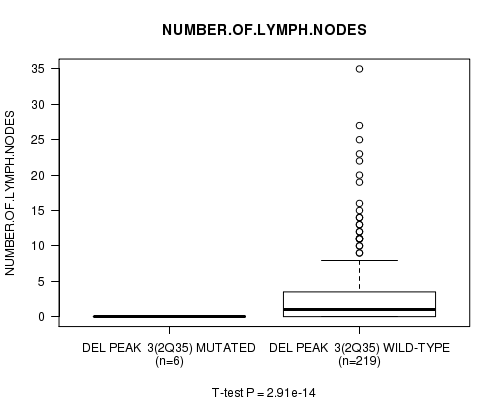
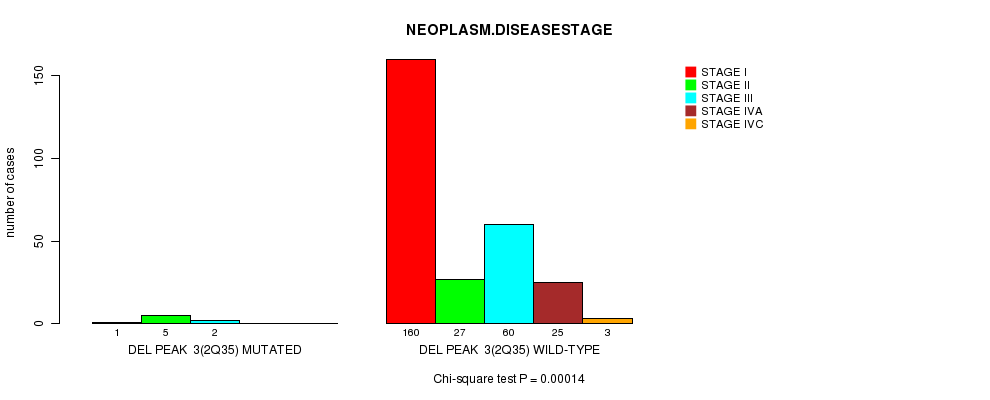
Del Peak 3(2q35) cnv correlated to 'HISTOLOGICAL.TYPE', 'NUMBER.OF.LYMPH.NODES', and 'NEOPLASM.DISEASESTAGE'.
-
Del Peak 10(8q24.22) cnv correlated to 'NUMBER.OF.LYMPH.NODES'.
-
Del Peak 11(9p21.3) cnv correlated to 'NEOPLASM.DISEASESTAGE'.
-
Del Peak 12(9q22.32) cnv correlated to 'NEOPLASM.DISEASESTAGE'.
-
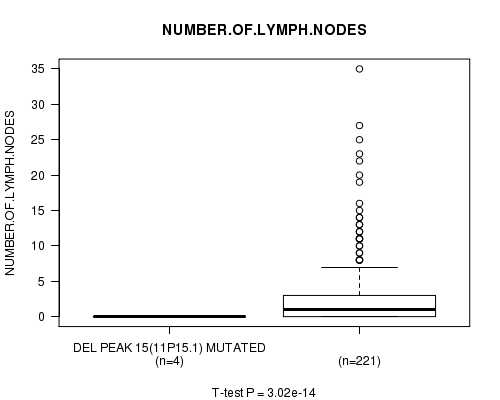
Del Peak 15(11p15.1) cnv correlated to 'NUMBER.OF.LYMPH.NODES'.
-
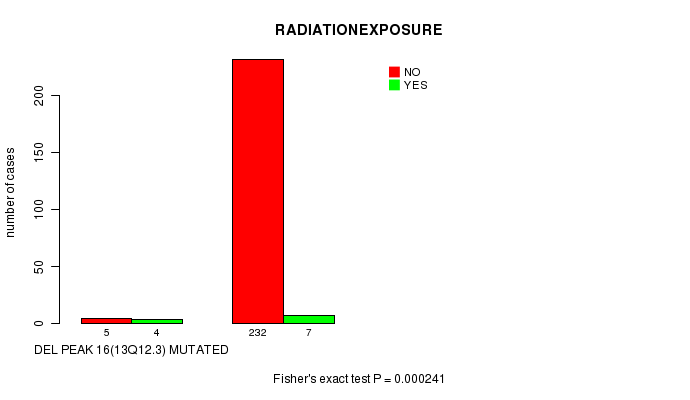
Del Peak 16(13q12.3) cnv correlated to 'RADIATIONEXPOSURE'.
-
Del Peak 17(13q14.3) cnv correlated to 'RADIATIONEXPOSURE'.
-
Del Peak 18(15q25.3) cnv correlated to 'NUMBER.OF.LYMPH.NODES'.
-
Del Peak 26(21q21.1) cnv correlated to 'NEOPLASM.DISEASESTAGE'.
-
Del Peak 30(Xq22.1) cnv correlated to 'NEOPLASM.DISEASESTAGE'.
-
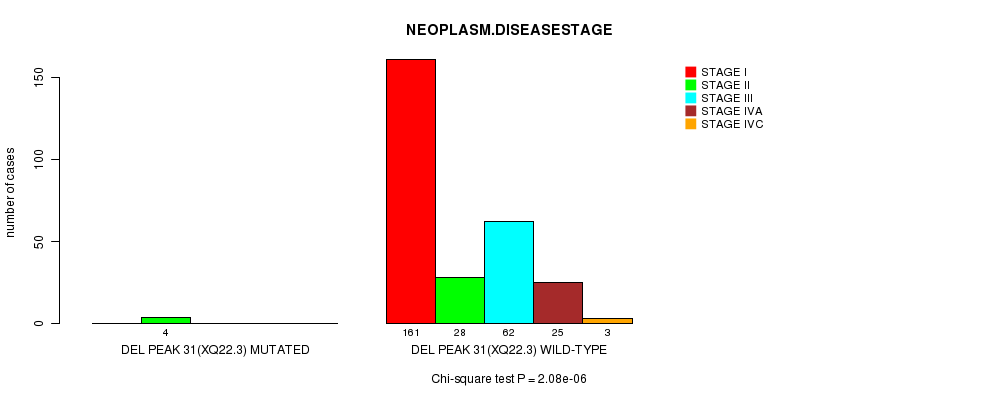
Del Peak 31(Xq22.3) cnv correlated to 'NUMBER.OF.LYMPH.NODES' and 'NEOPLASM.DISEASESTAGE'.
Table 1. Get Full Table Overview of the association between significant copy number variation of 24 arm-level results and 15 clinical features. Shown in the table are P values (Q values). Thresholded by Q value < 0.25, 15 significant findings detected.
|
Clinical Features |
Time to Death |
AGE | GENDER |
HISTOLOGICAL TYPE |
RADIATIONS RADIATION REGIMENINDICATION |
RADIATIONEXPOSURE |
DISTANT METASTASIS |
EXTRATHYROIDAL EXTENSION |
LYMPH NODE METASTASIS |
COMPLETENESS OF RESECTION |
NUMBER OF LYMPH NODES |
TUMOR STAGECODE |
NEOPLASM DISEASESTAGE |
MULTIFOCALITY |
TUMOR SIZE |
||
| nCNV (%) | nWild-Type | logrank test | t-test | Fisher's exact test | Fisher's exact test | Fisher's exact test | Fisher's exact test | Fisher's exact test | Fisher's exact test | Chi-square test | Fisher's exact test | t-test | t-test | Chi-square test | Fisher's exact test | t-test | |
| Del Peak 3(2q35) | 8 (3%) | 276 |
1 (1.00) |
0.0123 (1.00) |
0.684 (1.00) |
0.000323 (0.104) |
1 (1.00) |
1 (1.00) |
0.382 (1.00) |
0.729 (1.00) |
0.182 (1.00) |
0.25 (1.00) |
2.91e-14 (9.67e-12) |
0.00014 (0.0453) |
1 (1.00) |
0.185 (1.00) |
|
| Del Peak 31(Xq22 3) | 4 (1%) | 280 |
1 (1.00) |
0.0642 (1.00) |
0.0536 (1.00) |
0.206 (1.00) |
1 (1.00) |
0.128 (1.00) |
0.18 (1.00) |
0.606 (1.00) |
0.36 (1.00) |
0.494 (1.00) |
3.02e-14 (1e-11) |
2.08e-06 (0.000679) |
1 (1.00) |
0.515 (1.00) |
|
| Del Peak 2(2p22 3) | 9 (3%) | 275 |
1 (1.00) |
0.157 (1.00) |
0.455 (1.00) |
0.019 (1.00) |
1 (1.00) |
1 (1.00) |
0.391 (1.00) |
0.258 (1.00) |
0.135 (1.00) |
0.788 (1.00) |
2.86e-14 (9.52e-12) |
0.00102 (0.325) |
0.749 (1.00) |
0.688 (1.00) |
|
| Del Peak 10(8q24 22) | 5 (2%) | 279 |
1 (1.00) |
0.0567 (1.00) |
0.109 (1.00) |
0.0294 (1.00) |
1 (1.00) |
1 (1.00) |
0.682 (1.00) |
1 (1.00) |
0.464 (1.00) |
0.575 (1.00) |
3.08e-14 (1.01e-11) |
0.00506 (1.00) |
0.684 (1.00) |
0.185 (1.00) |
|
| Del Peak 11(9p21 3) | 7 (2%) | 277 |
1 (1.00) |
0.0401 (1.00) |
0.682 (1.00) |
0.627 (1.00) |
1 (1.00) |
1 (1.00) |
0.519 (1.00) |
0.3 (1.00) |
0.309 (1.00) |
0.309 (1.00) |
0.00238 (0.755) |
1.88e-05 (0.00612) |
0.282 (1.00) |
0.124 (1.00) |
|
| Del Peak 12(9q22 32) | 10 (4%) | 274 |
1 (1.00) |
0.124 (1.00) |
1 (1.00) |
0.239 (1.00) |
0.402 (1.00) |
0.34 (1.00) |
0.302 (1.00) |
0.553 (1.00) |
0.101 (1.00) |
0.822 (1.00) |
0.373 (1.00) |
8.59e-05 (0.0279) |
1 (1.00) |
0.833 (1.00) |
|
| Del Peak 15(11p15 1) | 4 (1%) | 280 |
0.00468 (1.00) |
0.031 (1.00) |
0.273 (1.00) |
0.145 (1.00) |
0.184 (1.00) |
1 (1.00) |
0.18 (1.00) |
0.606 (1.00) |
0.36 (1.00) |
0.494 (1.00) |
3.02e-14 (1e-11) |
0.515 (1.00) |
0.622 (1.00) |
0.238 (1.00) |
|
| Del Peak 16(13q12 3) | 10 (4%) | 274 |
0.00468 (1.00) |
0.0131 (1.00) |
0.131 (1.00) |
0.108 (1.00) |
0.402 (1.00) |
0.000241 (0.0777) |
0.302 (1.00) |
0.553 (1.00) |
0.277 (1.00) |
0.488 (1.00) |
0.0311 (1.00) |
0.118 (1.00) |
0.749 (1.00) |
0.137 (1.00) |
|
| Del Peak 17(13q14 3) | 13 (5%) | 271 |
0.00468 (1.00) |
0.177 (1.00) |
0.33 (1.00) |
0.162 (1.00) |
0.129 (1.00) |
0.000601 (0.192) |
0.441 (1.00) |
0.446 (1.00) |
0.0996 (1.00) |
1 (1.00) |
0.0358 (1.00) |
0.535 (1.00) |
0.377 (1.00) |
0.353 (1.00) |
|
| Del Peak 18(15q25 3) | 4 (1%) | 280 |
1 (1.00) |
0.247 (1.00) |
0.575 (1.00) |
0.145 (1.00) |
1 (1.00) |
1 (1.00) |
0.18 (1.00) |
1 (1.00) |
0.36 (1.00) |
0.494 (1.00) |
3.02e-14 (1e-11) |
0.0489 (1.00) |
0.622 (1.00) |
0.626 (1.00) |
|
| Del Peak 26(21q21 1) | 7 (2%) | 277 |
1 (1.00) |
0.0042 (1.00) |
1 (1.00) |
0.447 (1.00) |
1 (1.00) |
1 (1.00) |
0.519 (1.00) |
1 (1.00) |
0.334 (1.00) |
0.201 (1.00) |
0.946 (1.00) |
0.000339 (0.109) |
1 (1.00) |
0.73 (1.00) |
|
| Del Peak 30(Xq22 1) | 6 (2%) | 278 |
1 (1.00) |
0.177 (1.00) |
0.0397 (1.00) |
0.135 (1.00) |
1 (1.00) |
0.204 (1.00) |
0.295 (1.00) |
0.411 (1.00) |
0.382 (1.00) |
0.246 (1.00) |
0.691 (1.00) |
0.000772 (0.246) |
0.684 (1.00) |
0.682 (1.00) |
|
| Del Peak 5(6q22 31) | 4 (1%) | 280 |
0.00468 (1.00) |
0.197 (1.00) |
1 (1.00) |
0.802 (1.00) |
0.184 (1.00) |
1 (1.00) |
0.18 (1.00) |
0.606 (1.00) |
0.769 (1.00) |
1 (1.00) |
0.00663 (1.00) |
0.0718 (1.00) |
0.37 (1.00) |
0.033 (1.00) |
|
| Del Peak 6(6q27) | 4 (1%) | 280 |
0.00468 (1.00) |
0.197 (1.00) |
1 (1.00) |
0.802 (1.00) |
0.184 (1.00) |
1 (1.00) |
0.18 (1.00) |
0.606 (1.00) |
0.769 (1.00) |
1 (1.00) |
0.00663 (1.00) |
0.0718 (1.00) |
0.37 (1.00) |
0.033 (1.00) |
|
| Del Peak 8(7q34) | 4 (1%) | 280 |
1 (1.00) |
0.759 (1.00) |
1 (1.00) |
0.251 (1.00) |
1 (1.00) |
1 (1.00) |
1 (1.00) |
0.606 (1.00) |
0.769 (1.00) |
1 (1.00) |
0.374 (1.00) |
0.7 (1.00) |
0.37 (1.00) |
0.23 (1.00) |
|
| Del Peak 13(10q21 2) | 7 (2%) | 277 |
1 (1.00) |
0.565 (1.00) |
1 (1.00) |
0.0672 (1.00) |
0.301 (1.00) |
1 (1.00) |
1 (1.00) |
1 (1.00) |
0.585 (1.00) |
0.699 (1.00) |
0.293 (1.00) |
0.618 (1.00) |
1 (1.00) |
0.0236 (1.00) |
|
| Del Peak 14(10q23 31) | 8 (3%) | 276 |
1 (1.00) |
0.0207 (1.00) |
0.428 (1.00) |
0.0242 (1.00) |
1 (1.00) |
1 (1.00) |
0.765 (1.00) |
0.729 (1.00) |
0.219 (1.00) |
1 (1.00) |
0.0584 (1.00) |
0.0117 (1.00) |
0.723 (1.00) |
0.0374 (1.00) |
|
| Del Peak 20(16q23 3) | 3 (1%) | 281 |
1 (1.00) |
0.323 (1.00) |
0.572 (1.00) |
0.0221 (1.00) |
1 (1.00) |
0.128 (1.00) |
1 (1.00) |
0.192 (1.00) |
0.708 (1.00) |
0.4 (1.00) |
0.0561 (1.00) |
0.139 (1.00) |
1 (1.00) |
||
| Del Peak 21(17p13 1) | 5 (2%) | 279 |
1 (1.00) |
0.944 (1.00) |
0.333 (1.00) |
0.367 (1.00) |
0.0208 (1.00) |
1 (1.00) |
0.429 (1.00) |
0.102 (1.00) |
0.215 (1.00) |
1 (1.00) |
0.293 (1.00) |
0.211 (1.00) |
0.214 (1.00) |
0.306 (1.00) |
|
| Del Peak 22(18p11 21) | 3 (1%) | 281 |
1 (1.00) |
0.958 (1.00) |
0.572 (1.00) |
1 (1.00) |
1 (1.00) |
1 (1.00) |
1 (1.00) |
1 (1.00) |
0.865 (1.00) |
1 (1.00) |
0.0561 (1.00) |
0.0502 (1.00) |
0.622 (1.00) |
0.976 (1.00) |
|
| Del Peak 23(19p13 2) | 4 (1%) | 280 |
1 (1.00) |
0.0248 (1.00) |
1 (1.00) |
0.145 (1.00) |
1 (1.00) |
1 (1.00) |
0.604 (1.00) |
1 (1.00) |
0.105 (1.00) |
0.4 (1.00) |
0.722 (1.00) |
0.37 (1.00) |
|||
| Del Peak 27(22q13 31) | 49 (17%) | 235 |
0.724 (1.00) |
0.748 (1.00) |
0.719 (1.00) |
0.0552 (1.00) |
0.477 (1.00) |
0.695 (1.00) |
0.63 (1.00) |
0.509 (1.00) |
0.644 (1.00) |
0.4 (1.00) |
0.684 (1.00) |
0.854 (1.00) |
0.109 (1.00) |
0.305 (1.00) |
|
| Del Peak 28(22q13 2) | 49 (17%) | 235 |
0.724 (1.00) |
0.748 (1.00) |
0.719 (1.00) |
0.0552 (1.00) |
0.477 (1.00) |
0.695 (1.00) |
0.63 (1.00) |
0.509 (1.00) |
0.644 (1.00) |
0.4 (1.00) |
0.684 (1.00) |
0.854 (1.00) |
0.109 (1.00) |
0.305 (1.00) |
|
| Del Peak 29(22q13 32) | 50 (18%) | 234 |
0.724 (1.00) |
0.798 (1.00) |
0.595 (1.00) |
0.0314 (1.00) |
0.476 (1.00) |
0.695 (1.00) |
0.722 (1.00) |
0.509 (1.00) |
0.587 (1.00) |
0.4 (1.00) |
0.607 (1.00) |
0.882 (1.00) |
0.0799 (1.00) |
0.305 (1.00) |
P value = 2.86e-14 (t-test), Q value = 9.5e-12
Table S1. Gene #1: 'Del Peak 2(2p22.3) mutation analysis' versus Clinical Feature #11: 'NUMBER.OF.LYMPH.NODES'
| nPatients | Mean (Std.Dev) | |
|---|---|---|
| ALL | 225 | 2.8 (5.2) |
| DEL PEAK 2(2P22.3) MUTATED | 7 | 0.0 (0.0) |
| DEL PEAK 2(2P22.3) WILD-TYPE | 218 | 2.9 (5.3) |
Figure S1. Get High-res Image Gene #1: 'Del Peak 2(2p22.3) mutation analysis' versus Clinical Feature #11: 'NUMBER.OF.LYMPH.NODES'

P value = 0.000323 (Fisher's exact test), Q value = 0.1
Table S2. Gene #2: 'Del Peak 3(2q35) mutation analysis' versus Clinical Feature #4: 'HISTOLOGICAL.TYPE'
| nPatients | OTHER | THYROID PAPILLARY CARCINOMA - CLASSICAL/USUAL | THYROID PAPILLARY CARCINOMA - FOLLICULAR (>= 99% FOLLICULAR PATTERNED) | THYROID PAPILLARY CARCINOMA - TALL CELL (>= 50% TALL CELL FEATURES) |
|---|---|---|---|---|
| ALL | 18 | 167 | 69 | 30 |
| DEL PEAK 3(2Q35) MUTATED | 4 | 1 | 3 | 0 |
| DEL PEAK 3(2Q35) WILD-TYPE | 14 | 166 | 66 | 30 |
Figure S2. Get High-res Image Gene #2: 'Del Peak 3(2q35) mutation analysis' versus Clinical Feature #4: 'HISTOLOGICAL.TYPE'

P value = 2.91e-14 (t-test), Q value = 9.7e-12
Table S3. Gene #2: 'Del Peak 3(2q35) mutation analysis' versus Clinical Feature #11: 'NUMBER.OF.LYMPH.NODES'
| nPatients | Mean (Std.Dev) | |
|---|---|---|
| ALL | 225 | 2.8 (5.2) |
| DEL PEAK 3(2Q35) MUTATED | 6 | 0.0 (0.0) |
| DEL PEAK 3(2Q35) WILD-TYPE | 219 | 2.9 (5.3) |
Figure S3. Get High-res Image Gene #2: 'Del Peak 3(2q35) mutation analysis' versus Clinical Feature #11: 'NUMBER.OF.LYMPH.NODES'
P value = 0.00014 (Chi-square test), Q value = 0.045
Table S4. Gene #2: 'Del Peak 3(2q35) mutation analysis' versus Clinical Feature #13: 'NEOPLASM.DISEASESTAGE'
| nPatients | STAGE I | STAGE II | STAGE III | STAGE IVA | STAGE IVC |
|---|---|---|---|---|---|
| ALL | 161 | 32 | 62 | 25 | 3 |
| DEL PEAK 3(2Q35) MUTATED | 1 | 5 | 2 | 0 | 0 |
| DEL PEAK 3(2Q35) WILD-TYPE | 160 | 27 | 60 | 25 | 3 |
Figure S4. Get High-res Image Gene #2: 'Del Peak 3(2q35) mutation analysis' versus Clinical Feature #13: 'NEOPLASM.DISEASESTAGE'
P value = 3.08e-14 (t-test), Q value = 1e-11
Table S5. Gene #6: 'Del Peak 10(8q24.22) mutation analysis' versus Clinical Feature #11: 'NUMBER.OF.LYMPH.NODES'
| nPatients | Mean (Std.Dev) | |
|---|---|---|
| ALL | 225 | 2.8 (5.2) |
| DEL PEAK 10(8Q24.22) MUTATED | 3 | 0.0 (0.0) |
| DEL PEAK 10(8Q24.22) WILD-TYPE | 222 | 2.9 (5.3) |
Figure S5. Get High-res Image Gene #6: 'Del Peak 10(8q24.22) mutation analysis' versus Clinical Feature #11: 'NUMBER.OF.LYMPH.NODES'

P value = 1.88e-05 (Chi-square test), Q value = 0.0061
Table S6. Gene #7: 'Del Peak 11(9p21.3) mutation analysis' versus Clinical Feature #13: 'NEOPLASM.DISEASESTAGE'
| nPatients | STAGE I | STAGE II | STAGE III | STAGE IVA | STAGE IVC |
|---|---|---|---|---|---|
| ALL | 161 | 32 | 62 | 25 | 3 |
| DEL PEAK 11(9P21.3) MUTATED | 1 | 5 | 0 | 1 | 0 |
| DEL PEAK 11(9P21.3) WILD-TYPE | 160 | 27 | 62 | 24 | 3 |
Figure S6. Get High-res Image Gene #7: 'Del Peak 11(9p21.3) mutation analysis' versus Clinical Feature #13: 'NEOPLASM.DISEASESTAGE'

P value = 8.59e-05 (Chi-square test), Q value = 0.028
Table S7. Gene #8: 'Del Peak 12(9q22.32) mutation analysis' versus Clinical Feature #13: 'NEOPLASM.DISEASESTAGE'
| nPatients | STAGE I | STAGE II | STAGE III | STAGE IVA | STAGE IVC |
|---|---|---|---|---|---|
| ALL | 161 | 32 | 62 | 25 | 3 |
| DEL PEAK 12(9Q22.32) MUTATED | 2 | 5 | 0 | 3 | 0 |
| DEL PEAK 12(9Q22.32) WILD-TYPE | 159 | 27 | 62 | 22 | 3 |
Figure S7. Get High-res Image Gene #8: 'Del Peak 12(9q22.32) mutation analysis' versus Clinical Feature #13: 'NEOPLASM.DISEASESTAGE'

P value = 3.02e-14 (t-test), Q value = 1e-11
Table S8. Gene #11: 'Del Peak 15(11p15.1) mutation analysis' versus Clinical Feature #11: 'NUMBER.OF.LYMPH.NODES'
| nPatients | Mean (Std.Dev) | |
|---|---|---|
| ALL | 225 | 2.8 (5.2) |
| DEL PEAK 15(11P15.1) MUTATED | 4 | 0.0 (0.0) |
| DEL PEAK 15(11P15.1) WILD-TYPE | 221 | 2.9 (5.3) |
Figure S8. Get High-res Image Gene #11: 'Del Peak 15(11p15.1) mutation analysis' versus Clinical Feature #11: 'NUMBER.OF.LYMPH.NODES'
P value = 0.000241 (Fisher's exact test), Q value = 0.078
Table S9. Gene #12: 'Del Peak 16(13q12.3) mutation analysis' versus Clinical Feature #6: 'RADIATIONEXPOSURE'
| nPatients | NO | YES |
|---|---|---|
| ALL | 237 | 11 |
| DEL PEAK 16(13Q12.3) MUTATED | 5 | 4 |
| DEL PEAK 16(13Q12.3) WILD-TYPE | 232 | 7 |
Figure S9. Get High-res Image Gene #12: 'Del Peak 16(13q12.3) mutation analysis' versus Clinical Feature #6: 'RADIATIONEXPOSURE'
P value = 0.000601 (Fisher's exact test), Q value = 0.19
Table S10. Gene #13: 'Del Peak 17(13q14.3) mutation analysis' versus Clinical Feature #6: 'RADIATIONEXPOSURE'
| nPatients | NO | YES |
|---|---|---|
| ALL | 237 | 11 |
| DEL PEAK 17(13Q14.3) MUTATED | 7 | 4 |
| DEL PEAK 17(13Q14.3) WILD-TYPE | 230 | 7 |
Figure S10. Get High-res Image Gene #13: 'Del Peak 17(13q14.3) mutation analysis' versus Clinical Feature #6: 'RADIATIONEXPOSURE'

P value = 3.02e-14 (t-test), Q value = 1e-11
Table S11. Gene #14: 'Del Peak 18(15q25.3) mutation analysis' versus Clinical Feature #11: 'NUMBER.OF.LYMPH.NODES'
| nPatients | Mean (Std.Dev) | |
|---|---|---|
| ALL | 225 | 2.8 (5.2) |
| DEL PEAK 18(15Q25.3) MUTATED | 4 | 0.0 (0.0) |
| DEL PEAK 18(15Q25.3) WILD-TYPE | 221 | 2.9 (5.3) |
Figure S11. Get High-res Image Gene #14: 'Del Peak 18(15q25.3) mutation analysis' versus Clinical Feature #11: 'NUMBER.OF.LYMPH.NODES'

P value = 0.000339 (Chi-square test), Q value = 0.11
Table S12. Gene #19: 'Del Peak 26(21q21.1) mutation analysis' versus Clinical Feature #13: 'NEOPLASM.DISEASESTAGE'
| nPatients | STAGE I | STAGE II | STAGE III | STAGE IVA | STAGE IVC |
|---|---|---|---|---|---|
| ALL | 161 | 32 | 62 | 25 | 3 |
| DEL PEAK 26(21Q21.1) MUTATED | 0 | 4 | 1 | 2 | 0 |
| DEL PEAK 26(21Q21.1) WILD-TYPE | 161 | 28 | 61 | 23 | 3 |
Figure S12. Get High-res Image Gene #19: 'Del Peak 26(21q21.1) mutation analysis' versus Clinical Feature #13: 'NEOPLASM.DISEASESTAGE'

P value = 0.000772 (Chi-square test), Q value = 0.25
Table S13. Gene #23: 'Del Peak 30(Xq22.1) mutation analysis' versus Clinical Feature #13: 'NEOPLASM.DISEASESTAGE'
| nPatients | STAGE I | STAGE II | STAGE III | STAGE IVA | STAGE IVC |
|---|---|---|---|---|---|
| ALL | 161 | 32 | 62 | 25 | 3 |
| DEL PEAK 30(XQ22.1) MUTATED | 1 | 4 | 1 | 0 | 0 |
| DEL PEAK 30(XQ22.1) WILD-TYPE | 160 | 28 | 61 | 25 | 3 |
Figure S13. Get High-res Image Gene #23: 'Del Peak 30(Xq22.1) mutation analysis' versus Clinical Feature #13: 'NEOPLASM.DISEASESTAGE'

P value = 3.02e-14 (t-test), Q value = 1e-11
Table S14. Gene #24: 'Del Peak 31(Xq22.3) mutation analysis' versus Clinical Feature #11: 'NUMBER.OF.LYMPH.NODES'
| nPatients | Mean (Std.Dev) | |
|---|---|---|
| ALL | 225 | 2.8 (5.2) |
| DEL PEAK 31(XQ22.3) MUTATED | 4 | 0.0 (0.0) |
| DEL PEAK 31(XQ22.3) WILD-TYPE | 221 | 2.9 (5.3) |
Figure S14. Get High-res Image Gene #24: 'Del Peak 31(Xq22.3) mutation analysis' versus Clinical Feature #11: 'NUMBER.OF.LYMPH.NODES'

P value = 2.08e-06 (Chi-square test), Q value = 0.00068
Table S15. Gene #24: 'Del Peak 31(Xq22.3) mutation analysis' versus Clinical Feature #13: 'NEOPLASM.DISEASESTAGE'
| nPatients | STAGE I | STAGE II | STAGE III | STAGE IVA | STAGE IVC |
|---|---|---|---|---|---|
| ALL | 161 | 32 | 62 | 25 | 3 |
| DEL PEAK 31(XQ22.3) MUTATED | 0 | 4 | 0 | 0 | 0 |
| DEL PEAK 31(XQ22.3) WILD-TYPE | 161 | 28 | 62 | 25 | 3 |
Figure S15. Get High-res Image Gene #24: 'Del Peak 31(Xq22.3) mutation analysis' versus Clinical Feature #13: 'NEOPLASM.DISEASESTAGE'
-
Mutation data file = all_lesions.conf_99.cnv.cluster.txt
-
Clinical data file = THCA-TP.clin.merged.picked.txt
-
Number of patients = 284
-
Number of significantly arm-level cnvs = 24
-
Number of selected clinical features = 15
-
Exclude genes that fewer than K tumors have mutations, K = 3
For survival clinical features, the Kaplan-Meier survival curves of tumors with and without gene mutations were plotted and the statistical significance P values were estimated by logrank test (Bland and Altman 2004) using the 'survdiff' function in R
For continuous numerical clinical features, two-tailed Student's t test with unequal variance (Lehmann and Romano 2005) was applied to compare the clinical values between tumors with and without gene mutations using 't.test' function in R
For binary or multi-class clinical features (nominal or ordinal), two-tailed Fisher's exact tests (Fisher 1922) were used to estimate the P values using the 'fisher.test' function in R
For multi-class clinical features (nominal or ordinal), Chi-square tests (Greenwood and Nikulin 1996) were used to estimate the P values using the 'chisq.test' function in R
For multiple hypothesis correction, Q value is the False Discovery Rate (FDR) analogue of the P value (Benjamini and Hochberg 1995), defined as the minimum FDR at which the test may be called significant. We used the 'Benjamini and Hochberg' method of 'p.adjust' function in R to convert P values into Q values.
This is an experimental feature. The full results of the analysis summarized in this report can be downloaded from the TCGA Data Coordination Center.