This pipeline computes the correlation between significantly recurrent gene mutations and selected clinical features.
Testing the association between mutation status of 23 genes and 14 clinical features across 229 patients, 6 significant findings detected with Q value < 0.25.
-
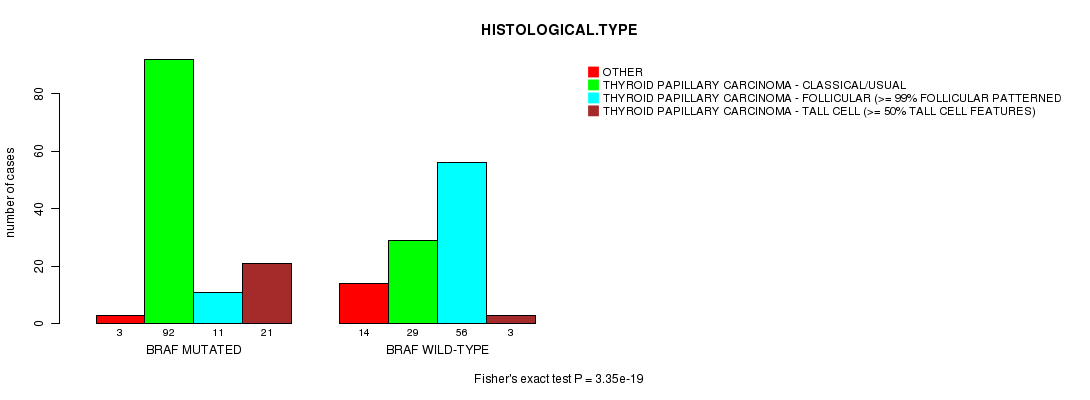
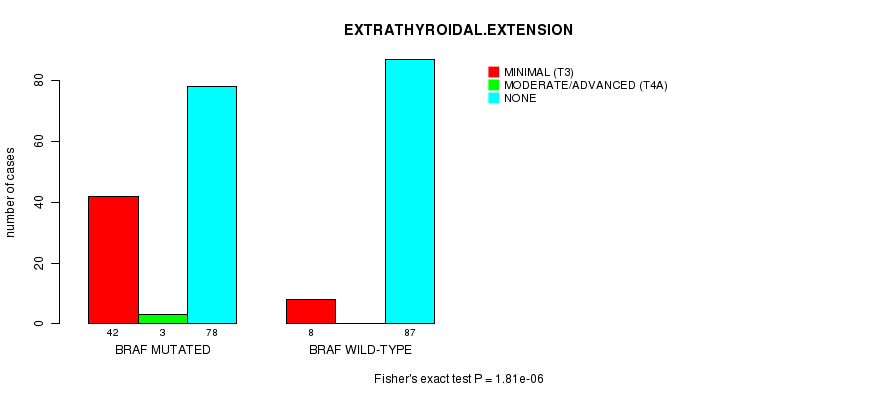
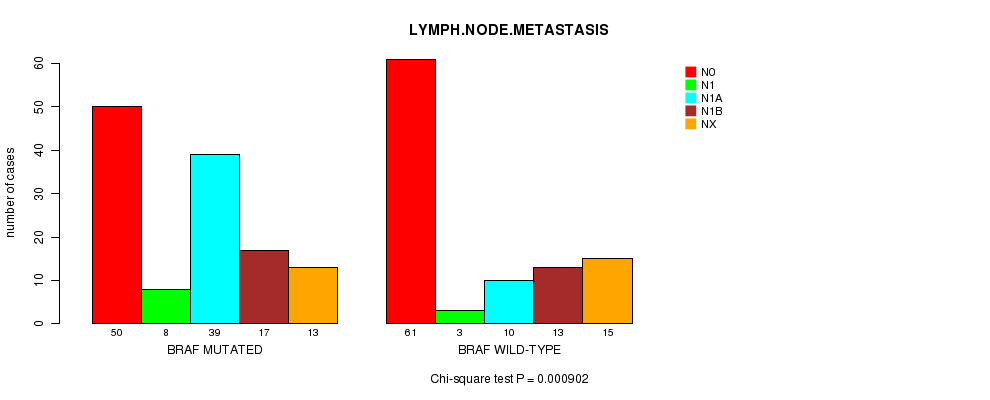
BRAF mutation correlated to 'HISTOLOGICAL.TYPE', 'EXTRATHYROIDAL.EXTENSION', and 'LYMPH.NODE.METASTASIS'.
-
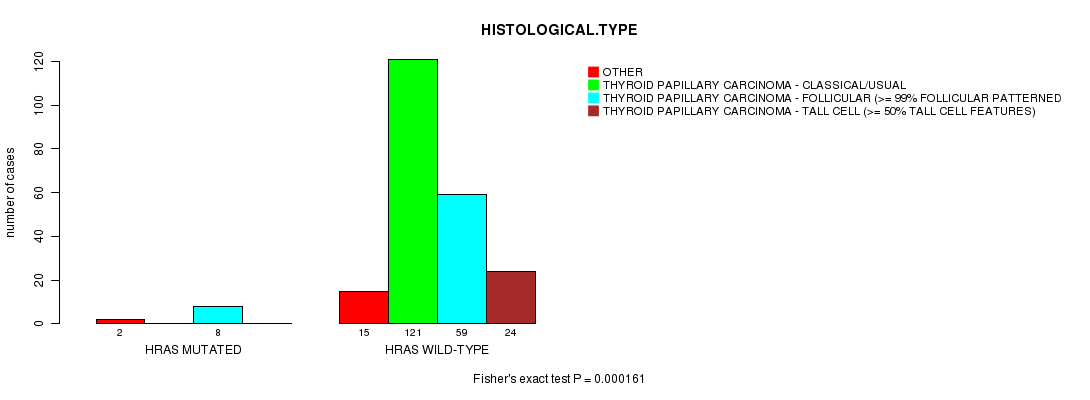
HRAS mutation correlated to 'HISTOLOGICAL.TYPE'.
-
NRAS mutation correlated to 'HISTOLOGICAL.TYPE'.
-
PPTC7 mutation correlated to 'NUMBER.OF.LYMPH.NODES'.
Table 1. Get Full Table Overview of the association between mutation status of 23 genes and 14 clinical features. Shown in the table are P values (Q values). Thresholded by Q value < 0.25, 6 significant findings detected.
|
Clinical Features |
AGE | GENDER |
HISTOLOGICAL TYPE |
RADIATIONS RADIATION REGIMENINDICATION |
RADIATIONEXPOSURE |
DISTANT METASTASIS |
EXTRATHYROIDAL EXTENSION |
LYMPH NODE METASTASIS |
COMPLETENESS OF RESECTION |
NUMBER OF LYMPH NODES |
TUMOR STAGECODE |
NEOPLASM DISEASESTAGE |
MULTIFOCALITY |
TUMOR SIZE |
||
| nMutated (%) | nWild-Type | t-test | Fisher's exact test | Fisher's exact test | Fisher's exact test | Fisher's exact test | Fisher's exact test | Fisher's exact test | Chi-square test | Fisher's exact test | t-test | t-test | Chi-square test | Fisher's exact test | t-test | |
| BRAF | 127 (55%) | 102 |
0.456 (1.00) |
0.37 (1.00) |
3.35e-19 (9.41e-17) |
0.0137 (1.00) |
0.734 (1.00) |
0.558 (1.00) |
1.81e-06 (0.000504) |
0.000902 (0.249) |
0.599 (1.00) |
0.0899 (1.00) |
0.115 (1.00) |
0.892 (1.00) |
0.0829 (1.00) |
|
| HRAS | 10 (4%) | 219 |
0.717 (1.00) |
0.728 (1.00) |
0.000161 (0.0447) |
1 (1.00) |
1 (1.00) |
0.171 (1.00) |
1 (1.00) |
0.236 (1.00) |
0.123 (1.00) |
0.838 (1.00) |
0.0358 (1.00) |
0.338 (1.00) |
0.463 (1.00) |
|
| NRAS | 19 (8%) | 210 |
0.742 (1.00) |
0.289 (1.00) |
3.97e-07 (0.000111) |
0.606 (1.00) |
0.56 (1.00) |
0.338 (1.00) |
0.0331 (1.00) |
0.0061 (1.00) |
1 (1.00) |
0.0175 (1.00) |
0.042 (1.00) |
0.472 (1.00) |
0.854 (1.00) |
|
| PPTC7 | 3 (1%) | 226 |
0.735 (1.00) |
0.174 (1.00) |
0.608 (1.00) |
1 (1.00) |
1 (1.00) |
0.579 (1.00) |
1 (1.00) |
0.857 (1.00) |
1 (1.00) |
0.000806 (0.223) |
0.928 (1.00) |
1 (1.00) |
0.904 (1.00) |
|
| EMG1 | 5 (2%) | 224 |
0.957 (1.00) |
0.328 (1.00) |
0.322 (1.00) |
1 (1.00) |
1 (1.00) |
0.673 (1.00) |
1 (1.00) |
0.859 (1.00) |
0.166 (1.00) |
0.0689 (1.00) |
0.331 (1.00) |
0.671 (1.00) |
0.184 (1.00) |
|
| RPTN | 5 (2%) | 224 |
0.922 (1.00) |
0.611 (1.00) |
0.322 (1.00) |
1 (1.00) |
1 (1.00) |
1 (1.00) |
1 (1.00) |
0.0185 (1.00) |
1 (1.00) |
0.307 (1.00) |
0.768 (1.00) |
0.671 (1.00) |
0.661 (1.00) |
|
| EIF1AX | 3 (1%) | 226 |
0.429 (1.00) |
0.174 (1.00) |
0.0775 (1.00) |
1 (1.00) |
1 (1.00) |
1 (1.00) |
1 (1.00) |
0.0689 (1.00) |
0.205 (1.00) |
0.732 (1.00) |
1 (1.00) |
0.373 (1.00) |
||
| CCDC15 | 5 (2%) | 224 |
0.145 (1.00) |
1 (1.00) |
0.361 (1.00) |
1 (1.00) |
1 (1.00) |
0.138 (1.00) |
1 (1.00) |
0.00095 (0.261) |
1 (1.00) |
0.2 (1.00) |
0.642 (1.00) |
0.195 (1.00) |
0.428 (1.00) |
|
| ZNF845 | 4 (2%) | 225 |
0.152 (1.00) |
1 (1.00) |
0.579 (1.00) |
1 (1.00) |
1 (1.00) |
0.664 (1.00) |
0.568 (1.00) |
0.628 (1.00) |
1 (1.00) |
0.861 (1.00) |
0.0755 (1.00) |
0.623 (1.00) |
0.374 (1.00) |
|
| TG | 10 (4%) | 219 |
0.624 (1.00) |
0.728 (1.00) |
0.0505 (1.00) |
1 (1.00) |
1 (1.00) |
1 (1.00) |
1 (1.00) |
0.949 (1.00) |
0.465 (1.00) |
0.589 (1.00) |
0.987 (1.00) |
1 (1.00) |
0.727 (1.00) |
|
| PRB2 | 3 (1%) | 226 |
0.274 (1.00) |
1 (1.00) |
0.608 (1.00) |
1 (1.00) |
1 (1.00) |
1 (1.00) |
0.568 (1.00) |
0.643 (1.00) |
1 (1.00) |
0.732 (1.00) |
1 (1.00) |
0.539 (1.00) |
||
| R3HDM2 | 4 (2%) | 225 |
0.995 (1.00) |
1 (1.00) |
0.309 (1.00) |
1 (1.00) |
1 (1.00) |
1 (1.00) |
0.598 (1.00) |
0.603 (1.00) |
1 (1.00) |
0.927 (1.00) |
1 (1.00) |
0.546 (1.00) |
||
| ZNF799 | 3 (1%) | 226 |
0.938 (1.00) |
1 (1.00) |
0.754 (1.00) |
1 (1.00) |
1 (1.00) |
0.579 (1.00) |
1 (1.00) |
0.114 (1.00) |
1 (1.00) |
0.667 (1.00) |
0.107 (1.00) |
|||
| PPM1D | 5 (2%) | 224 |
0.534 (1.00) |
1 (1.00) |
0.873 (1.00) |
1 (1.00) |
1 (1.00) |
1 (1.00) |
0.375 (1.00) |
0.233 (1.00) |
1 (1.00) |
0.0651 (1.00) |
0.0425 (1.00) |
1 (1.00) |
0.805 (1.00) |
|
| KRAS | 3 (1%) | 226 |
0.877 (1.00) |
0.567 (1.00) |
0.102 (1.00) |
1 (1.00) |
1 (1.00) |
0.579 (1.00) |
0.857 (1.00) |
0.928 (1.00) |
1 (1.00) |
|||||
| SLC5A11 | 3 (1%) | 226 |
0.272 (1.00) |
0.567 (1.00) |
0.608 (1.00) |
1 (1.00) |
1 (1.00) |
1 (1.00) |
1 (1.00) |
0.736 (1.00) |
1 (1.00) |
0.928 (1.00) |
0.607 (1.00) |
|||
| SLC26A11 | 3 (1%) | 226 |
0.403 (1.00) |
0.174 (1.00) |
0.286 (1.00) |
1 (1.00) |
1 (1.00) |
0.0954 (1.00) |
1 (1.00) |
0.857 (1.00) |
1 (1.00) |
0.414 (1.00) |
0.667 (1.00) |
1 (1.00) |
0.182 (1.00) |
|
| ANKRD30A | 3 (1%) | 226 |
0.293 (1.00) |
1 (1.00) |
1 (1.00) |
1 (1.00) |
1 (1.00) |
0.579 (1.00) |
0.676 (1.00) |
0.997 (1.00) |
0.42 (1.00) |
1 (1.00) |
||||
| FAM155A | 3 (1%) | 226 |
0.167 (1.00) |
1 (1.00) |
0.216 (1.00) |
1 (1.00) |
1 (1.00) |
0.31 (1.00) |
1 (1.00) |
0.857 (1.00) |
1 (1.00) |
0.764 (1.00) |
0.928 (1.00) |
0.248 (1.00) |
||
| ZFHX3 | 5 (2%) | 224 |
0.966 (1.00) |
1 (1.00) |
0.402 (1.00) |
0.238 (1.00) |
1 (1.00) |
1 (1.00) |
0.145 (1.00) |
0.251 (1.00) |
0.564 (1.00) |
0.417 (1.00) |
0.334 (1.00) |
0.0609 (1.00) |
0.46 (1.00) |
|
| ARMCX3 | 3 (1%) | 226 |
0.531 (1.00) |
0.567 (1.00) |
1 (1.00) |
1 (1.00) |
1 (1.00) |
1 (1.00) |
1 (1.00) |
0.52 (1.00) |
1 (1.00) |
0.667 (1.00) |
0.607 (1.00) |
0.0311 (1.00) |
||
| COL5A3 | 5 (2%) | 224 |
0.41 (1.00) |
0.328 (1.00) |
0.76 (1.00) |
1 (1.00) |
1 (1.00) |
0.673 (1.00) |
1 (1.00) |
0.878 (1.00) |
0.564 (1.00) |
0.262 (1.00) |
0.642 (1.00) |
0.372 (1.00) |
0.159 (1.00) |
|
| CDC27 | 3 (1%) | 226 |
0.79 (1.00) |
0.567 (1.00) |
1 (1.00) |
1 (1.00) |
0.13 (1.00) |
0.579 (1.00) |
0.568 (1.00) |
0.52 (1.00) |
1 (1.00) |
0.786 (1.00) |
1 (1.00) |
P value = 3.35e-19 (Fisher's exact test), Q value = 9.4e-17
Table S1. Gene #1: 'BRAF MUTATION STATUS' versus Clinical Feature #3: 'HISTOLOGICAL.TYPE'
| nPatients | OTHER | THYROID PAPILLARY CARCINOMA - CLASSICAL/USUAL | THYROID PAPILLARY CARCINOMA - FOLLICULAR (>= 99% FOLLICULAR PATTERNED) | THYROID PAPILLARY CARCINOMA - TALL CELL (>= 50% TALL CELL FEATURES) |
|---|---|---|---|---|
| ALL | 17 | 121 | 67 | 24 |
| BRAF MUTATED | 3 | 92 | 11 | 21 |
| BRAF WILD-TYPE | 14 | 29 | 56 | 3 |
Figure S1. Get High-res Image Gene #1: 'BRAF MUTATION STATUS' versus Clinical Feature #3: 'HISTOLOGICAL.TYPE'
P value = 1.81e-06 (Fisher's exact test), Q value = 5e-04
Table S2. Gene #1: 'BRAF MUTATION STATUS' versus Clinical Feature #7: 'EXTRATHYROIDAL.EXTENSION'
| nPatients | MINIMAL (T3) | MODERATE/ADVANCED (T4A) | NONE |
|---|---|---|---|
| ALL | 50 | 3 | 165 |
| BRAF MUTATED | 42 | 3 | 78 |
| BRAF WILD-TYPE | 8 | 0 | 87 |
Figure S2. Get High-res Image Gene #1: 'BRAF MUTATION STATUS' versus Clinical Feature #7: 'EXTRATHYROIDAL.EXTENSION'
P value = 0.000902 (Chi-square test), Q value = 0.25
Table S3. Gene #1: 'BRAF MUTATION STATUS' versus Clinical Feature #8: 'LYMPH.NODE.METASTASIS'
| nPatients | N0 | N1 | N1A | N1B | NX |
|---|---|---|---|---|---|
| ALL | 111 | 11 | 49 | 30 | 28 |
| BRAF MUTATED | 50 | 8 | 39 | 17 | 13 |
| BRAF WILD-TYPE | 61 | 3 | 10 | 13 | 15 |
Figure S3. Get High-res Image Gene #1: 'BRAF MUTATION STATUS' versus Clinical Feature #8: 'LYMPH.NODE.METASTASIS'
P value = 0.000161 (Fisher's exact test), Q value = 0.045
Table S4. Gene #3: 'HRAS MUTATION STATUS' versus Clinical Feature #3: 'HISTOLOGICAL.TYPE'
| nPatients | OTHER | THYROID PAPILLARY CARCINOMA - CLASSICAL/USUAL | THYROID PAPILLARY CARCINOMA - FOLLICULAR (>= 99% FOLLICULAR PATTERNED) | THYROID PAPILLARY CARCINOMA - TALL CELL (>= 50% TALL CELL FEATURES) |
|---|---|---|---|---|
| ALL | 17 | 121 | 67 | 24 |
| HRAS MUTATED | 2 | 0 | 8 | 0 |
| HRAS WILD-TYPE | 15 | 121 | 59 | 24 |
Figure S4. Get High-res Image Gene #3: 'HRAS MUTATION STATUS' versus Clinical Feature #3: 'HISTOLOGICAL.TYPE'
P value = 3.97e-07 (Fisher's exact test), Q value = 0.00011
Table S5. Gene #4: 'NRAS MUTATION STATUS' versus Clinical Feature #3: 'HISTOLOGICAL.TYPE'
| nPatients | OTHER | THYROID PAPILLARY CARCINOMA - CLASSICAL/USUAL | THYROID PAPILLARY CARCINOMA - FOLLICULAR (>= 99% FOLLICULAR PATTERNED) | THYROID PAPILLARY CARCINOMA - TALL CELL (>= 50% TALL CELL FEATURES) |
|---|---|---|---|---|
| ALL | 17 | 121 | 67 | 24 |
| NRAS MUTATED | 2 | 1 | 16 | 0 |
| NRAS WILD-TYPE | 15 | 120 | 51 | 24 |
Figure S5. Get High-res Image Gene #4: 'NRAS MUTATION STATUS' versus Clinical Feature #3: 'HISTOLOGICAL.TYPE'

P value = 0.000806 (t-test), Q value = 0.22
Table S6. Gene #12: 'PPTC7 MUTATION STATUS' versus Clinical Feature #10: 'NUMBER.OF.LYMPH.NODES'
| nPatients | Mean (Std.Dev) | |
|---|---|---|
| ALL | 181 | 2.7 (4.8) |
| PPTC7 MUTATED | 3 | 0.3 (0.6) |
| PPTC7 WILD-TYPE | 178 | 2.7 (4.9) |
Figure S6. Get High-res Image Gene #12: 'PPTC7 MUTATION STATUS' versus Clinical Feature #10: 'NUMBER.OF.LYMPH.NODES'

-
Mutation data file = THCA-TP.mutsig.cluster.txt
-
Clinical data file = THCA-TP.clin.merged.picked.txt
-
Number of patients = 229
-
Number of significantly mutated genes = 23
-
Number of selected clinical features = 14
-
Exclude genes that fewer than K tumors have mutations, K = 3
For continuous numerical clinical features, two-tailed Student's t test with unequal variance (Lehmann and Romano 2005) was applied to compare the clinical values between tumors with and without gene mutations using 't.test' function in R
For binary or multi-class clinical features (nominal or ordinal), two-tailed Fisher's exact tests (Fisher 1922) were used to estimate the P values using the 'fisher.test' function in R
For multi-class clinical features (nominal or ordinal), Chi-square tests (Greenwood and Nikulin 1996) were used to estimate the P values using the 'chisq.test' function in R
For multiple hypothesis correction, Q value is the False Discovery Rate (FDR) analogue of the P value (Benjamini and Hochberg 1995), defined as the minimum FDR at which the test may be called significant. We used the 'Benjamini and Hochberg' method of 'p.adjust' function in R to convert P values into Q values.
This is an experimental feature. The full results of the analysis summarized in this report can be downloaded from the TCGA Data Coordination Center.