This pipeline computes the correlation between significant arm-level copy number variations (cnvs) and subtypes.
Testing the association between copy number variation 42 arm-level results and 8 molecular subtypes across 430 patients, 94 significant findings detected with Q value < 0.25.
-
1q gain cnv correlated to 'CN_CNMF'.
-
4p gain cnv correlated to 'CN_CNMF'.
-
4q gain cnv correlated to 'CN_CNMF'.
-
5p gain cnv correlated to 'CN_CNMF', 'MIRSEQ_CNMF', and 'MIRSEQ_CHIERARCHICAL'.
-
5q gain cnv correlated to 'CN_CNMF', 'METHLYATION_CNMF', 'MRNASEQ_CNMF', 'MRNASEQ_CHIERARCHICAL', 'MIRSEQ_CNMF', and 'MIRSEQ_CHIERARCHICAL'.
-
7p gain cnv correlated to 'CN_CNMF', 'METHLYATION_CNMF', 'MRNASEQ_CNMF', 'MRNASEQ_CHIERARCHICAL', 'MIRSEQ_CNMF', and 'MIRSEQ_CHIERARCHICAL'.
-
7q gain cnv correlated to 'CN_CNMF', 'METHLYATION_CNMF', 'MRNASEQ_CNMF', 'MRNASEQ_CHIERARCHICAL', 'MIRSEQ_CNMF', and 'MIRSEQ_CHIERARCHICAL'.
-
11q gain cnv correlated to 'CN_CNMF'.
-
12p gain cnv correlated to 'CN_CNMF', 'METHLYATION_CNMF', 'MRNASEQ_CNMF', 'MRNASEQ_CHIERARCHICAL', 'MIRSEQ_CNMF', and 'MIRSEQ_CHIERARCHICAL'.
-
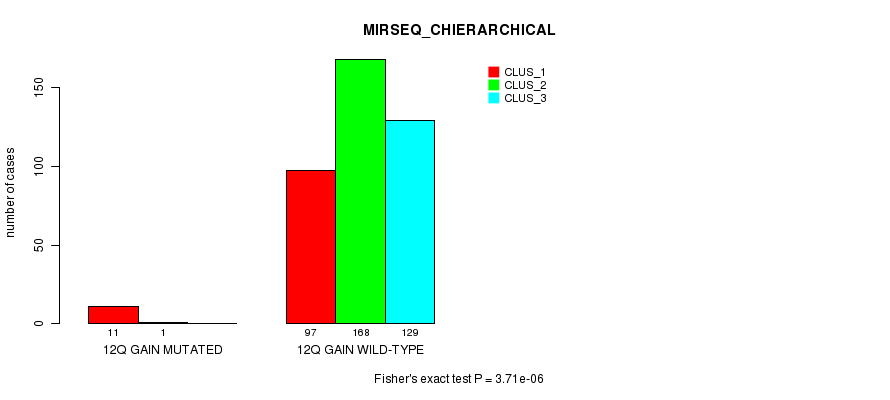
12q gain cnv correlated to 'CN_CNMF', 'METHLYATION_CNMF', 'MRNASEQ_CNMF', 'MRNASEQ_CHIERARCHICAL', 'MIRSEQ_CNMF', and 'MIRSEQ_CHIERARCHICAL'.
-
14q gain cnv correlated to 'CN_CNMF' and 'METHLYATION_CNMF'.
-
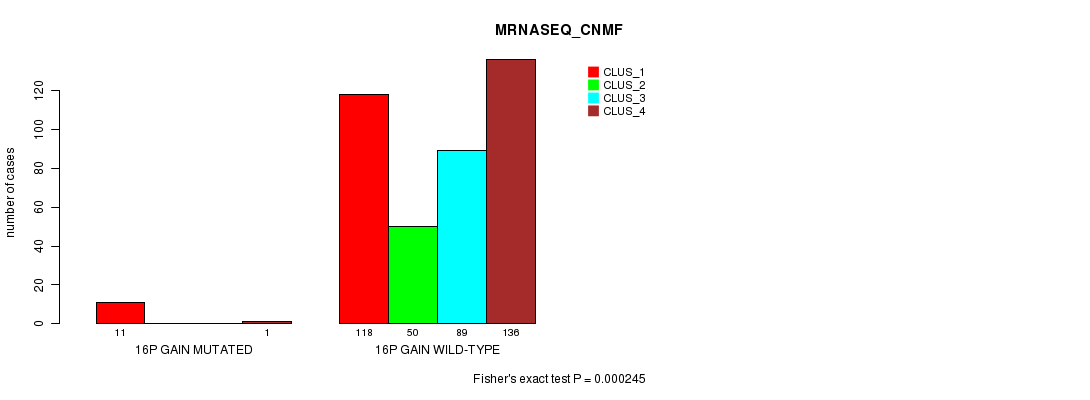
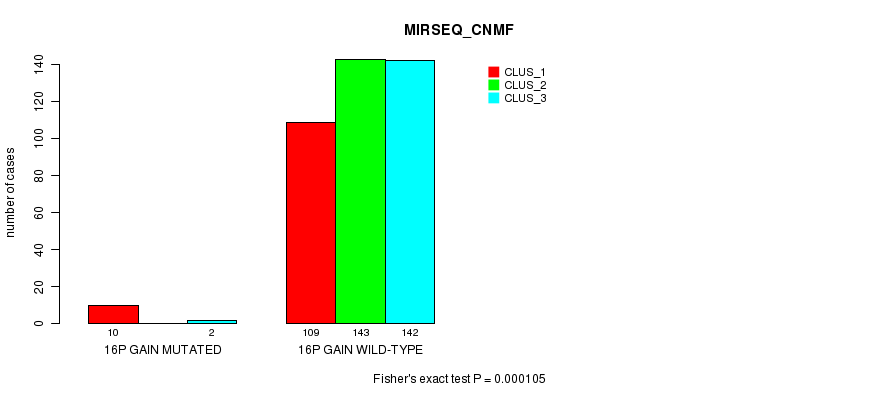
16p gain cnv correlated to 'CN_CNMF', 'METHLYATION_CNMF', 'MRNASEQ_CNMF', 'MRNASEQ_CHIERARCHICAL', 'MIRSEQ_CNMF', and 'MIRSEQ_CHIERARCHICAL'.
-
16q gain cnv correlated to 'CN_CNMF' and 'MIRSEQ_CHIERARCHICAL'.
-
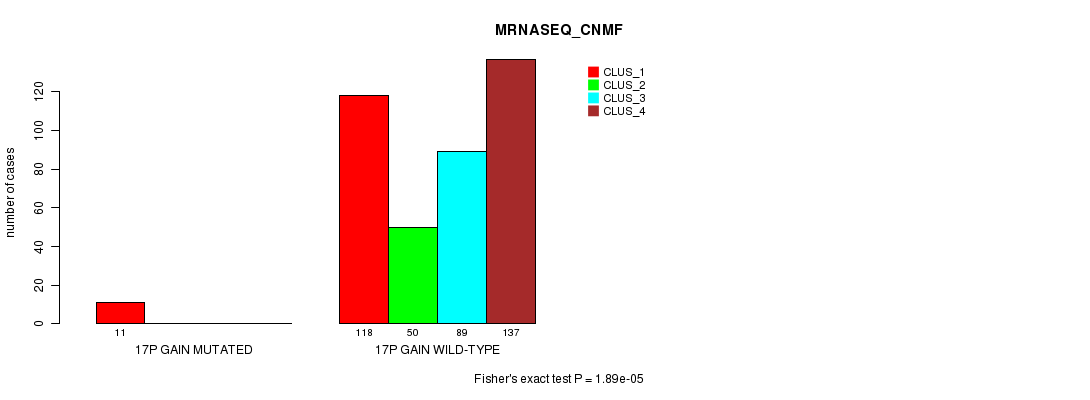
17p gain cnv correlated to 'CN_CNMF', 'METHLYATION_CNMF', 'MRNASEQ_CNMF', 'MRNASEQ_CHIERARCHICAL', 'MIRSEQ_CNMF', and 'MIRSEQ_CHIERARCHICAL'.
-
17q gain cnv correlated to 'CN_CNMF', 'METHLYATION_CNMF', 'MRNASEQ_CNMF', 'MRNASEQ_CHIERARCHICAL', 'MIRSEQ_CNMF', and 'MIRSEQ_CHIERARCHICAL'.
-
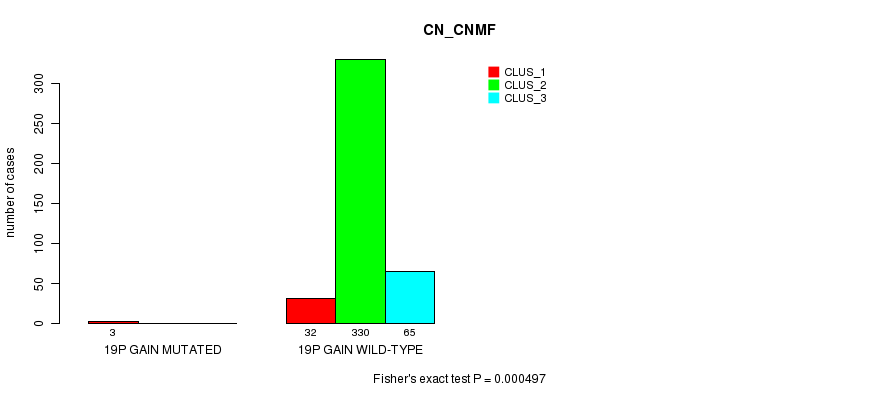
19p gain cnv correlated to 'CN_CNMF'.
-
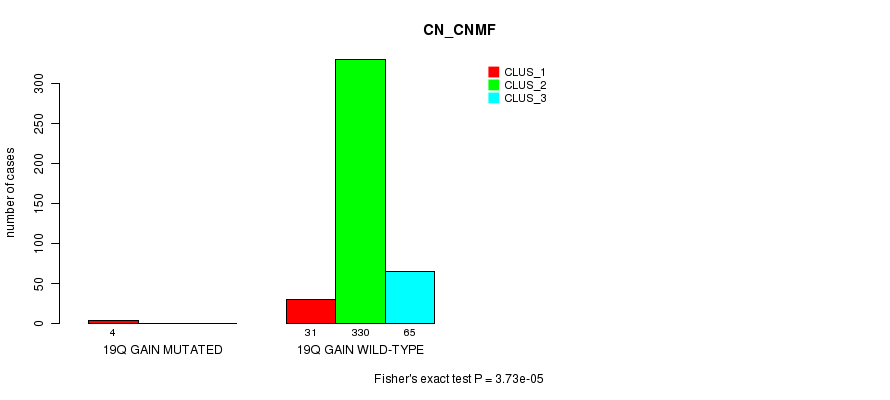
19q gain cnv correlated to 'CN_CNMF'.
-
20p gain cnv correlated to 'CN_CNMF'.
-
20q gain cnv correlated to 'CN_CNMF'.
-
1p loss cnv correlated to 'CN_CNMF'.
-
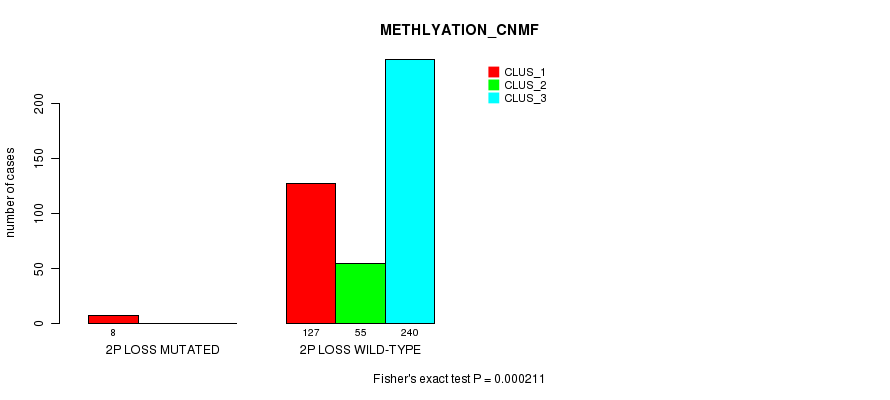
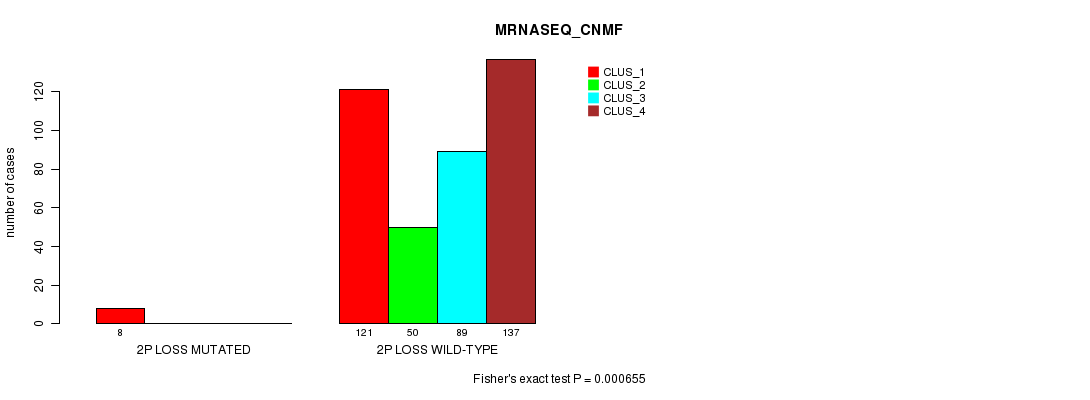
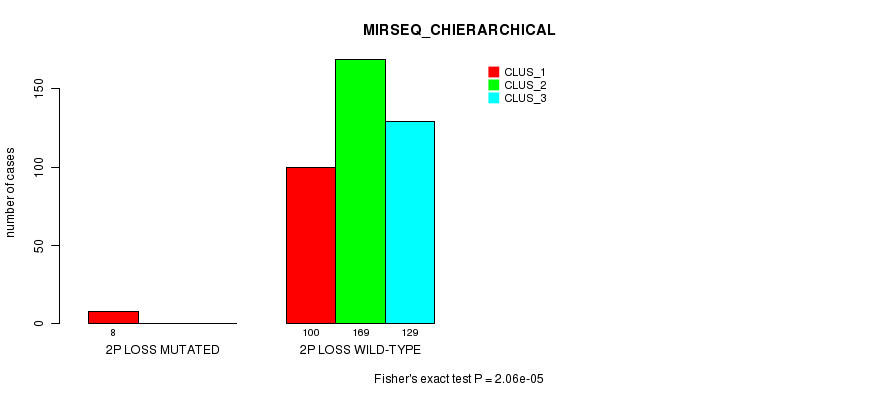
2p loss cnv correlated to 'CN_CNMF', 'METHLYATION_CNMF', 'MRNASEQ_CNMF', 'MRNASEQ_CHIERARCHICAL', 'MIRSEQ_CNMF', and 'MIRSEQ_CHIERARCHICAL'.
-
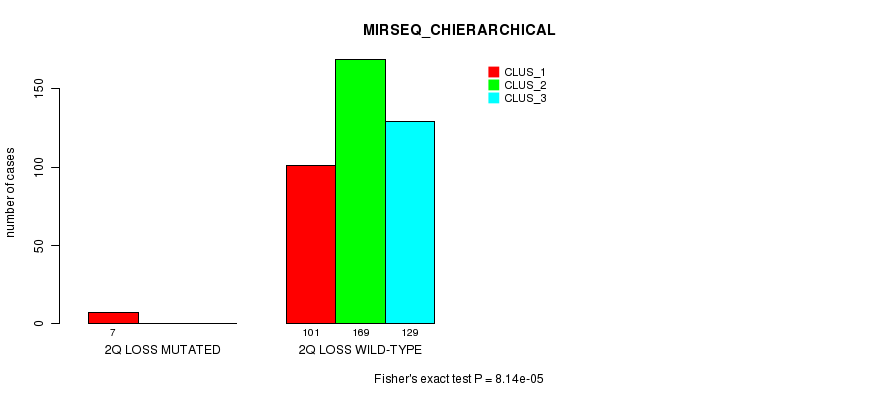
2q loss cnv correlated to 'CN_CNMF', 'METHLYATION_CNMF', 'MIRSEQ_CNMF', and 'MIRSEQ_CHIERARCHICAL'.
-
3q loss cnv correlated to 'CN_CNMF'.
-
8p loss cnv correlated to 'CN_CNMF'.
-
8q loss cnv correlated to 'CN_CNMF'.
-
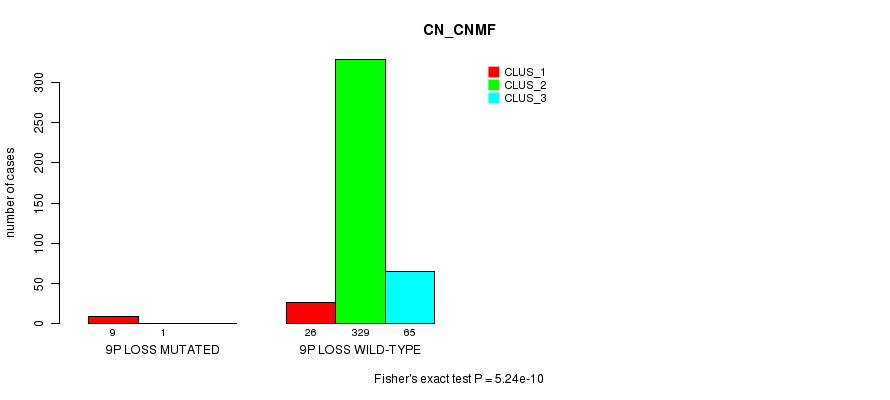
9p loss cnv correlated to 'CN_CNMF'.
-
9q loss cnv correlated to 'CN_CNMF'.
-
10p loss cnv correlated to 'CN_CNMF'.
-
10q loss cnv correlated to 'CN_CNMF'.
-
11p loss cnv correlated to 'CN_CNMF'.
-
11q loss cnv correlated to 'CN_CNMF'.
-
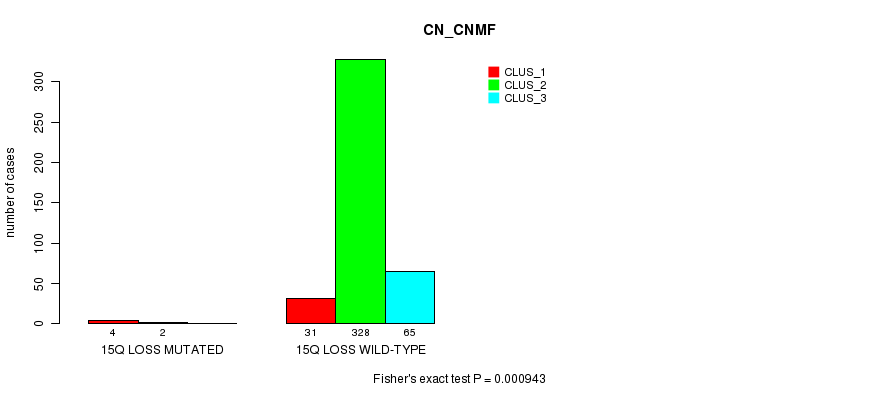
15q loss cnv correlated to 'CN_CNMF', 'MIRSEQ_CNMF', and 'MIRSEQ_CHIERARCHICAL'.
-
18p loss cnv correlated to 'CN_CNMF'.
-
18q loss cnv correlated to 'CN_CNMF'.
-
21q loss cnv correlated to 'CN_CNMF'.
-
22q loss cnv correlated to 'CN_CNMF', 'MRNASEQ_CNMF', 'MRNASEQ_CHIERARCHICAL', 'MIRSEQ_CNMF', and 'MIRSEQ_CHIERARCHICAL'.
Table 1. Get Full Table Overview of the association between significant copy number variation of 42 arm-level results and 8 molecular subtypes. Shown in the table are P values (Q values). Thresholded by Q value < 0.25, 94 significant findings detected.
|
Molecular subtypes |
CN CNMF |
METHLYATION CNMF |
RPPA CNMF |
RPPA CHIERARCHICAL |
MRNASEQ CNMF |
MRNASEQ CHIERARCHICAL |
MIRSEQ CNMF |
MIRSEQ CHIERARCHICAL |
||
| nCNV (%) | nWild-Type | Fisher's exact test | Fisher's exact test | Fisher's exact test | Fisher's exact test | Fisher's exact test | Fisher's exact test | Fisher's exact test | Fisher's exact test | |
| 5q gain | 13 (3%) | 417 |
6.43e-16 (1.97e-13) |
0.000276 (0.0659) |
0.902 (1.00) |
0.0224 (1.00) |
0.000782 (0.174) |
0.000962 (0.212) |
0.000188 (0.0461) |
8.57e-05 (0.0216) |
| 7p gain | 17 (4%) | 413 |
3.79e-21 (1.17e-18) |
0.00114 (0.246) |
1 (1.00) |
0.00541 (1.00) |
0.000677 (0.152) |
0.000554 (0.126) |
0.000268 (0.0642) |
9.98e-05 (0.025) |
| 7q gain | 19 (4%) | 411 |
6.81e-24 (2.1e-21) |
0.000166 (0.0411) |
0.502 (1.00) |
0.00126 (0.269) |
0.000262 (0.0635) |
0.000178 (0.0437) |
3.79e-05 (0.00992) |
9.44e-06 (0.00261) |
| 12p gain | 12 (3%) | 418 |
7.66e-12 (2.32e-09) |
1.68e-06 (0.000487) |
0.902 (1.00) |
0.0224 (1.00) |
7.26e-06 (0.00203) |
4.95e-06 (0.0014) |
1.44e-05 (0.00394) |
3.71e-06 (0.00106) |
| 12q gain | 12 (3%) | 418 |
7.66e-12 (2.32e-09) |
1.68e-06 (0.000487) |
0.902 (1.00) |
0.0224 (1.00) |
7.26e-06 (0.00203) |
4.95e-06 (0.0014) |
1.44e-05 (0.00394) |
3.71e-06 (0.00106) |
| 16p gain | 12 (3%) | 418 |
3.91e-13 (1.19e-10) |
0.000351 (0.0818) |
0.504 (1.00) |
0.0245 (1.00) |
0.000245 (0.0597) |
0.000169 (0.0418) |
0.000105 (0.0261) |
4.89e-05 (0.0125) |
| 17p gain | 11 (3%) | 419 |
1.49e-07 (4.37e-05) |
6.61e-06 (0.00185) |
0.773 (1.00) |
0.00799 (1.00) |
1.89e-05 (0.00512) |
1.95e-05 (0.00528) |
4.59e-05 (0.0118) |
1.35e-05 (0.0037) |
| 17q gain | 12 (3%) | 418 |
1.21e-07 (3.56e-05) |
1.68e-06 (0.000487) |
0.795 (1.00) |
0.00924 (1.00) |
7.26e-06 (0.00203) |
4.95e-06 (0.0014) |
1.44e-05 (0.00394) |
3.71e-06 (0.00106) |
| 2p loss | 8 (2%) | 422 |
1.7e-08 (5e-06) |
0.000211 (0.0514) |
1 (1.00) |
0.0385 (1.00) |
0.000655 (0.147) |
0.000335 (0.0793) |
4.59e-05 (0.0118) |
2.06e-05 (0.00554) |
| 22q loss | 54 (13%) | 376 |
3.28e-45 (1.02e-42) |
0.00129 (0.274) |
0.122 (1.00) |
0.104 (1.00) |
3.64e-09 (1.08e-06) |
2.17e-07 (6.34e-05) |
0.000267 (0.0642) |
8.28e-05 (0.0209) |
| 2q loss | 7 (2%) | 423 |
1.31e-08 (3.88e-06) |
0.00103 (0.226) |
0.837 (1.00) |
0.0398 (1.00) |
0.00217 (0.441) |
0.00122 (0.264) |
0.000164 (0.0407) |
8.14e-05 (0.0207) |
| 5p gain | 16 (4%) | 414 |
2.61e-17 (8.03e-15) |
0.00733 (1.00) |
1 (1.00) |
0.0911 (1.00) |
0.00918 (1.00) |
0.0101 (1.00) |
0.000686 (0.153) |
0.00053 (0.121) |
| 15q loss | 6 (1%) | 424 |
0.000943 (0.208) |
0.00735 (1.00) |
0.459 (1.00) |
0.228 (1.00) |
0.0175 (1.00) |
0.00936 (1.00) |
0.000579 (0.131) |
0.000319 (0.076) |
| 14q gain | 7 (2%) | 423 |
2.19e-07 (6.36e-05) |
0.00103 (0.226) |
1 (1.00) |
0.228 (1.00) |
0.00217 (0.441) |
0.00122 (0.264) |
0.00432 (0.852) |
0.00204 (0.42) |
| 16q gain | 10 (2%) | 420 |
3.43e-12 (1.04e-09) |
0.00255 (0.509) |
0.858 (1.00) |
0.114 (1.00) |
0.00179 (0.374) |
0.00147 (0.309) |
0.00137 (0.29) |
0.000634 (0.143) |
| 1q gain | 16 (4%) | 414 |
7.85e-05 (0.02) |
0.0375 (1.00) |
0.0155 (1.00) |
0.0911 (1.00) |
0.0328 (1.00) |
0.0235 (1.00) |
0.152 (1.00) |
0.0547 (1.00) |
| 4p gain | 4 (1%) | 426 |
3.73e-05 (0.00992) |
0.0167 (1.00) |
0.0373 (1.00) |
0.0348 (1.00) |
0.108 (1.00) |
0.0986 (1.00) |
||
| 4q gain | 4 (1%) | 426 |
3.73e-05 (0.00992) |
0.0167 (1.00) |
0.0373 (1.00) |
0.0348 (1.00) |
0.108 (1.00) |
0.0986 (1.00) |
||
| 11q gain | 4 (1%) | 426 |
0.00034 (0.0803) |
0.0167 (1.00) |
0.0373 (1.00) |
0.0348 (1.00) |
0.00712 (1.00) |
0.0048 (0.942) |
||
| 19p gain | 3 (1%) | 427 |
0.000497 (0.115) |
0.0748 (1.00) |
0.101 (1.00) |
0.0822 (1.00) |
0.0247 (1.00) |
0.0184 (1.00) |
||
| 19q gain | 4 (1%) | 426 |
3.73e-05 (0.00992) |
0.0167 (1.00) |
0.638 (1.00) |
0.04 (1.00) |
0.0373 (1.00) |
0.0348 (1.00) |
0.00712 (1.00) |
0.0048 (0.942) |
| 20p gain | 8 (2%) | 422 |
8.67e-10 (2.59e-07) |
0.0166 (1.00) |
1 (1.00) |
0.0385 (1.00) |
0.0135 (1.00) |
0.0115 (1.00) |
0.0122 (1.00) |
0.00555 (1.00) |
| 20q gain | 8 (2%) | 422 |
8.67e-10 (2.59e-07) |
0.0166 (1.00) |
1 (1.00) |
0.0385 (1.00) |
0.0135 (1.00) |
0.0115 (1.00) |
0.0122 (1.00) |
0.00555 (1.00) |
| 1p loss | 3 (1%) | 427 |
0.000497 (0.115) |
0.533 (1.00) |
0.489 (1.00) |
0.195 (1.00) |
0.294 (1.00) |
0.357 (1.00) |
||
| 3q loss | 3 (1%) | 427 |
0.000497 (0.115) |
0.0748 (1.00) |
0.101 (1.00) |
0.0822 (1.00) |
0.0247 (1.00) |
0.0184 (1.00) |
||
| 8p loss | 4 (1%) | 426 |
3.73e-05 (0.00992) |
0.0419 (1.00) |
0.0373 (1.00) |
0.0348 (1.00) |
0.00712 (1.00) |
0.0048 (0.942) |
||
| 8q loss | 4 (1%) | 426 |
3.73e-05 (0.00992) |
0.0419 (1.00) |
0.0373 (1.00) |
0.0348 (1.00) |
0.00712 (1.00) |
0.0048 (0.942) |
||
| 9p loss | 10 (2%) | 420 |
5.24e-10 (1.57e-07) |
0.897 (1.00) |
0.557 (1.00) |
0.074 (1.00) |
0.25 (1.00) |
0.527 (1.00) |
0.182 (1.00) |
0.158 (1.00) |
| 9q loss | 14 (3%) | 416 |
1.46e-10 (4.4e-08) |
0.796 (1.00) |
0.213 (1.00) |
0.00228 (0.458) |
0.442 (1.00) |
0.823 (1.00) |
0.193 (1.00) |
0.256 (1.00) |
| 10p loss | 4 (1%) | 426 |
3.73e-05 (0.00992) |
0.26 (1.00) |
0.244 (1.00) |
0.0895 (1.00) |
0.108 (1.00) |
0.0986 (1.00) |
||
| 10q loss | 4 (1%) | 426 |
3.73e-05 (0.00992) |
0.26 (1.00) |
0.244 (1.00) |
0.0895 (1.00) |
0.108 (1.00) |
0.0986 (1.00) |
||
| 11p loss | 5 (1%) | 425 |
2.71e-06 (0.000778) |
0.057 (1.00) |
0.504 (1.00) |
1 (1.00) |
0.0498 (1.00) |
0.132 (1.00) |
0.038 (1.00) |
0.0221 (1.00) |
| 11q loss | 6 (1%) | 424 |
2.51e-05 (0.00672) |
0.0332 (1.00) |
0.391 (1.00) |
0.776 (1.00) |
0.0188 (1.00) |
0.0674 (1.00) |
0.013 (1.00) |
0.00681 (1.00) |
| 18p loss | 4 (1%) | 426 |
0.00034 (0.0803) |
0.175 (1.00) |
1 (1.00) |
0.182 (1.00) |
0.244 (1.00) |
0.0895 (1.00) |
0.0726 (1.00) |
0.0383 (1.00) |
| 18q loss | 4 (1%) | 426 |
0.00034 (0.0803) |
0.175 (1.00) |
1 (1.00) |
0.182 (1.00) |
0.244 (1.00) |
0.0895 (1.00) |
0.0726 (1.00) |
0.0383 (1.00) |
| 21q loss | 5 (1%) | 425 |
3.11e-05 (0.00832) |
0.017 (1.00) |
0.389 (1.00) |
0.04 (1.00) |
0.0498 (1.00) |
0.132 (1.00) |
0.038 (1.00) |
0.0221 (1.00) |
| 11p gain | 5 (1%) | 425 |
0.00195 (0.403) |
0.00598 (1.00) |
0.0175 (1.00) |
0.00936 (1.00) |
0.00204 (0.42) |
0.00124 (0.266) |
||
| 21q gain | 3 (1%) | 427 |
0.00344 (0.68) |
0.0748 (1.00) |
0.101 (1.00) |
0.0822 (1.00) |
0.0247 (1.00) |
0.0184 (1.00) |
||
| 6q loss | 3 (1%) | 427 |
0.0272 (1.00) |
0.0748 (1.00) |
0.101 (1.00) |
0.0822 (1.00) |
0.0247 (1.00) |
0.0184 (1.00) |
||
| 13q loss | 11 (3%) | 419 |
0.00211 (0.43) |
0.0235 (1.00) |
0.0784 (1.00) |
0.856 (1.00) |
0.0981 (1.00) |
0.117 (1.00) |
0.012 (1.00) |
0.00289 (0.575) |
| 17p loss | 7 (2%) | 423 |
0.0018 (0.374) |
1 (1.00) |
1 (1.00) |
1 (1.00) |
0.826 (1.00) |
0.886 (1.00) |
0.112 (1.00) |
0.493 (1.00) |
| 19p loss | 4 (1%) | 426 |
0.232 (1.00) |
0.0167 (1.00) |
0.286 (1.00) |
0.348 (1.00) |
0.0373 (1.00) |
0.0348 (1.00) |
0.00712 (1.00) |
0.0048 (0.942) |
P value = 7.85e-05 (Fisher's exact test), Q value = 0.02
Table S1. Gene #1: '1q gain mutation analysis' versus Clinical Feature #1: 'CN_CNMF'
| nPatients | CLUS_1 | CLUS_2 | CLUS_3 |
|---|---|---|---|
| ALL | 35 | 330 | 65 |
| 1Q GAIN MUTATED | 7 | 9 | 0 |
| 1Q GAIN WILD-TYPE | 28 | 321 | 65 |
Figure S1. Get High-res Image Gene #1: '1q gain mutation analysis' versus Clinical Feature #1: 'CN_CNMF'

P value = 3.73e-05 (Fisher's exact test), Q value = 0.0099
Table S2. Gene #2: '4p gain mutation analysis' versus Clinical Feature #1: 'CN_CNMF'
| nPatients | CLUS_1 | CLUS_2 | CLUS_3 |
|---|---|---|---|
| ALL | 35 | 330 | 65 |
| 4P GAIN MUTATED | 4 | 0 | 0 |
| 4P GAIN WILD-TYPE | 31 | 330 | 65 |
Figure S2. Get High-res Image Gene #2: '4p gain mutation analysis' versus Clinical Feature #1: 'CN_CNMF'

P value = 3.73e-05 (Fisher's exact test), Q value = 0.0099
Table S3. Gene #3: '4q gain mutation analysis' versus Clinical Feature #1: 'CN_CNMF'
| nPatients | CLUS_1 | CLUS_2 | CLUS_3 |
|---|---|---|---|
| ALL | 35 | 330 | 65 |
| 4Q GAIN MUTATED | 4 | 0 | 0 |
| 4Q GAIN WILD-TYPE | 31 | 330 | 65 |
Figure S3. Get High-res Image Gene #3: '4q gain mutation analysis' versus Clinical Feature #1: 'CN_CNMF'

P value = 2.61e-17 (Fisher's exact test), Q value = 8e-15
Table S4. Gene #4: '5p gain mutation analysis' versus Clinical Feature #1: 'CN_CNMF'
| nPatients | CLUS_1 | CLUS_2 | CLUS_3 |
|---|---|---|---|
| ALL | 35 | 330 | 65 |
| 5P GAIN MUTATED | 15 | 1 | 0 |
| 5P GAIN WILD-TYPE | 20 | 329 | 65 |
Figure S4. Get High-res Image Gene #4: '5p gain mutation analysis' versus Clinical Feature #1: 'CN_CNMF'

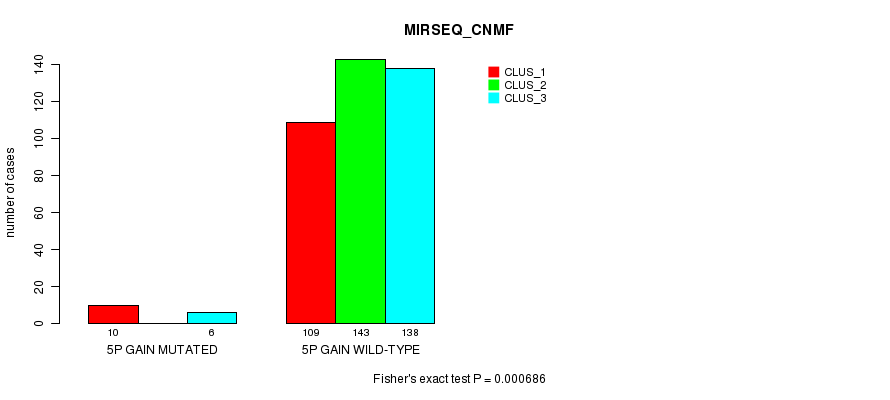
P value = 0.000686 (Fisher's exact test), Q value = 0.15
Table S5. Gene #4: '5p gain mutation analysis' versus Clinical Feature #7: 'MIRSEQ_CNMF'
| nPatients | CLUS_1 | CLUS_2 | CLUS_3 |
|---|---|---|---|
| ALL | 119 | 143 | 144 |
| 5P GAIN MUTATED | 10 | 0 | 6 |
| 5P GAIN WILD-TYPE | 109 | 143 | 138 |
Figure S5. Get High-res Image Gene #4: '5p gain mutation analysis' versus Clinical Feature #7: 'MIRSEQ_CNMF'
P value = 0.00053 (Fisher's exact test), Q value = 0.12
Table S6. Gene #4: '5p gain mutation analysis' versus Clinical Feature #8: 'MIRSEQ_CHIERARCHICAL'
| nPatients | CLUS_1 | CLUS_2 | CLUS_3 |
|---|---|---|---|
| ALL | 108 | 169 | 129 |
| 5P GAIN MUTATED | 10 | 6 | 0 |
| 5P GAIN WILD-TYPE | 98 | 163 | 129 |
Figure S6. Get High-res Image Gene #4: '5p gain mutation analysis' versus Clinical Feature #8: 'MIRSEQ_CHIERARCHICAL'

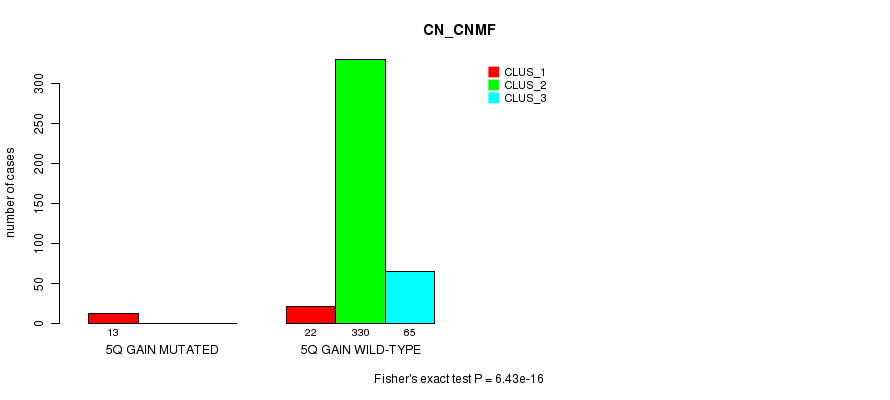
P value = 6.43e-16 (Fisher's exact test), Q value = 2e-13
Table S7. Gene #5: '5q gain mutation analysis' versus Clinical Feature #1: 'CN_CNMF'
| nPatients | CLUS_1 | CLUS_2 | CLUS_3 |
|---|---|---|---|
| ALL | 35 | 330 | 65 |
| 5Q GAIN MUTATED | 13 | 0 | 0 |
| 5Q GAIN WILD-TYPE | 22 | 330 | 65 |
Figure S7. Get High-res Image Gene #5: '5q gain mutation analysis' versus Clinical Feature #1: 'CN_CNMF'
P value = 0.000276 (Fisher's exact test), Q value = 0.066
Table S8. Gene #5: '5q gain mutation analysis' versus Clinical Feature #2: 'METHLYATION_CNMF'
| nPatients | CLUS_1 | CLUS_2 | CLUS_3 |
|---|---|---|---|
| ALL | 135 | 55 | 240 |
| 5Q GAIN MUTATED | 11 | 0 | 2 |
| 5Q GAIN WILD-TYPE | 124 | 55 | 238 |
Figure S8. Get High-res Image Gene #5: '5q gain mutation analysis' versus Clinical Feature #2: 'METHLYATION_CNMF'

P value = 0.000782 (Fisher's exact test), Q value = 0.17
Table S9. Gene #5: '5q gain mutation analysis' versus Clinical Feature #5: 'MRNASEQ_CNMF'
| nPatients | CLUS_1 | CLUS_2 | CLUS_3 | CLUS_4 |
|---|---|---|---|---|
| ALL | 129 | 50 | 89 | 137 |
| 5Q GAIN MUTATED | 11 | 0 | 0 | 2 |
| 5Q GAIN WILD-TYPE | 118 | 50 | 89 | 135 |
Figure S9. Get High-res Image Gene #5: '5q gain mutation analysis' versus Clinical Feature #5: 'MRNASEQ_CNMF'

P value = 0.000962 (Fisher's exact test), Q value = 0.21
Table S10. Gene #5: '5q gain mutation analysis' versus Clinical Feature #6: 'MRNASEQ_CHIERARCHICAL'
| nPatients | CLUS_1 | CLUS_2 | CLUS_3 |
|---|---|---|---|
| ALL | 141 | 190 | 74 |
| 5Q GAIN MUTATED | 11 | 2 | 0 |
| 5Q GAIN WILD-TYPE | 130 | 188 | 74 |
Figure S10. Get High-res Image Gene #5: '5q gain mutation analysis' versus Clinical Feature #6: 'MRNASEQ_CHIERARCHICAL'

P value = 0.000188 (Fisher's exact test), Q value = 0.046
Table S11. Gene #5: '5q gain mutation analysis' versus Clinical Feature #7: 'MIRSEQ_CNMF'
| nPatients | CLUS_1 | CLUS_2 | CLUS_3 |
|---|---|---|---|
| ALL | 119 | 143 | 144 |
| 5Q GAIN MUTATED | 10 | 0 | 3 |
| 5Q GAIN WILD-TYPE | 109 | 143 | 141 |
Figure S11. Get High-res Image Gene #5: '5q gain mutation analysis' versus Clinical Feature #7: 'MIRSEQ_CNMF'

P value = 8.57e-05 (Fisher's exact test), Q value = 0.022
Table S12. Gene #5: '5q gain mutation analysis' versus Clinical Feature #8: 'MIRSEQ_CHIERARCHICAL'
| nPatients | CLUS_1 | CLUS_2 | CLUS_3 |
|---|---|---|---|
| ALL | 108 | 169 | 129 |
| 5Q GAIN MUTATED | 10 | 3 | 0 |
| 5Q GAIN WILD-TYPE | 98 | 166 | 129 |
Figure S12. Get High-res Image Gene #5: '5q gain mutation analysis' versus Clinical Feature #8: 'MIRSEQ_CHIERARCHICAL'

P value = 3.79e-21 (Fisher's exact test), Q value = 1.2e-18
Table S13. Gene #6: '7p gain mutation analysis' versus Clinical Feature #1: 'CN_CNMF'
| nPatients | CLUS_1 | CLUS_2 | CLUS_3 |
|---|---|---|---|
| ALL | 35 | 330 | 65 |
| 7P GAIN MUTATED | 17 | 0 | 0 |
| 7P GAIN WILD-TYPE | 18 | 330 | 65 |
Figure S13. Get High-res Image Gene #6: '7p gain mutation analysis' versus Clinical Feature #1: 'CN_CNMF'

P value = 0.00114 (Fisher's exact test), Q value = 0.25
Table S14. Gene #6: '7p gain mutation analysis' versus Clinical Feature #2: 'METHLYATION_CNMF'
| nPatients | CLUS_1 | CLUS_2 | CLUS_3 |
|---|---|---|---|
| ALL | 135 | 55 | 240 |
| 7P GAIN MUTATED | 12 | 2 | 3 |
| 7P GAIN WILD-TYPE | 123 | 53 | 237 |
Figure S14. Get High-res Image Gene #6: '7p gain mutation analysis' versus Clinical Feature #2: 'METHLYATION_CNMF'

P value = 0.000677 (Fisher's exact test), Q value = 0.15
Table S15. Gene #6: '7p gain mutation analysis' versus Clinical Feature #5: 'MRNASEQ_CNMF'
| nPatients | CLUS_1 | CLUS_2 | CLUS_3 | CLUS_4 |
|---|---|---|---|---|
| ALL | 129 | 50 | 89 | 137 |
| 7P GAIN MUTATED | 13 | 0 | 1 | 2 |
| 7P GAIN WILD-TYPE | 116 | 50 | 88 | 135 |
Figure S15. Get High-res Image Gene #6: '7p gain mutation analysis' versus Clinical Feature #5: 'MRNASEQ_CNMF'

P value = 0.000554 (Fisher's exact test), Q value = 0.13
Table S16. Gene #6: '7p gain mutation analysis' versus Clinical Feature #6: 'MRNASEQ_CHIERARCHICAL'
| nPatients | CLUS_1 | CLUS_2 | CLUS_3 |
|---|---|---|---|
| ALL | 141 | 190 | 74 |
| 7P GAIN MUTATED | 13 | 2 | 1 |
| 7P GAIN WILD-TYPE | 128 | 188 | 73 |
Figure S16. Get High-res Image Gene #6: '7p gain mutation analysis' versus Clinical Feature #6: 'MRNASEQ_CHIERARCHICAL'

P value = 0.000268 (Fisher's exact test), Q value = 0.064
Table S17. Gene #6: '7p gain mutation analysis' versus Clinical Feature #7: 'MIRSEQ_CNMF'
| nPatients | CLUS_1 | CLUS_2 | CLUS_3 |
|---|---|---|---|
| ALL | 119 | 143 | 144 |
| 7P GAIN MUTATED | 12 | 1 | 3 |
| 7P GAIN WILD-TYPE | 107 | 142 | 141 |
Figure S17. Get High-res Image Gene #6: '7p gain mutation analysis' versus Clinical Feature #7: 'MIRSEQ_CNMF'

P value = 9.98e-05 (Fisher's exact test), Q value = 0.025
Table S18. Gene #6: '7p gain mutation analysis' versus Clinical Feature #8: 'MIRSEQ_CHIERARCHICAL'
| nPatients | CLUS_1 | CLUS_2 | CLUS_3 |
|---|---|---|---|
| ALL | 108 | 169 | 129 |
| 7P GAIN MUTATED | 12 | 3 | 1 |
| 7P GAIN WILD-TYPE | 96 | 166 | 128 |
Figure S18. Get High-res Image Gene #6: '7p gain mutation analysis' versus Clinical Feature #8: 'MIRSEQ_CHIERARCHICAL'

P value = 6.81e-24 (Fisher's exact test), Q value = 2.1e-21
Table S19. Gene #7: '7q gain mutation analysis' versus Clinical Feature #1: 'CN_CNMF'
| nPatients | CLUS_1 | CLUS_2 | CLUS_3 |
|---|---|---|---|
| ALL | 35 | 330 | 65 |
| 7Q GAIN MUTATED | 19 | 0 | 0 |
| 7Q GAIN WILD-TYPE | 16 | 330 | 65 |
Figure S19. Get High-res Image Gene #7: '7q gain mutation analysis' versus Clinical Feature #1: 'CN_CNMF'

P value = 0.000166 (Fisher's exact test), Q value = 0.041
Table S20. Gene #7: '7q gain mutation analysis' versus Clinical Feature #2: 'METHLYATION_CNMF'
| nPatients | CLUS_1 | CLUS_2 | CLUS_3 |
|---|---|---|---|
| ALL | 135 | 55 | 240 |
| 7Q GAIN MUTATED | 14 | 2 | 3 |
| 7Q GAIN WILD-TYPE | 121 | 53 | 237 |
Figure S20. Get High-res Image Gene #7: '7q gain mutation analysis' versus Clinical Feature #2: 'METHLYATION_CNMF'

P value = 0.000262 (Fisher's exact test), Q value = 0.064
Table S21. Gene #7: '7q gain mutation analysis' versus Clinical Feature #5: 'MRNASEQ_CNMF'
| nPatients | CLUS_1 | CLUS_2 | CLUS_3 | CLUS_4 |
|---|---|---|---|---|
| ALL | 129 | 50 | 89 | 137 |
| 7Q GAIN MUTATED | 14 | 0 | 1 | 2 |
| 7Q GAIN WILD-TYPE | 115 | 50 | 88 | 135 |
Figure S21. Get High-res Image Gene #7: '7q gain mutation analysis' versus Clinical Feature #5: 'MRNASEQ_CNMF'

P value = 0.000178 (Fisher's exact test), Q value = 0.044
Table S22. Gene #7: '7q gain mutation analysis' versus Clinical Feature #6: 'MRNASEQ_CHIERARCHICAL'
| nPatients | CLUS_1 | CLUS_2 | CLUS_3 |
|---|---|---|---|
| ALL | 141 | 190 | 74 |
| 7Q GAIN MUTATED | 14 | 2 | 1 |
| 7Q GAIN WILD-TYPE | 127 | 188 | 73 |
Figure S22. Get High-res Image Gene #7: '7q gain mutation analysis' versus Clinical Feature #6: 'MRNASEQ_CHIERARCHICAL'

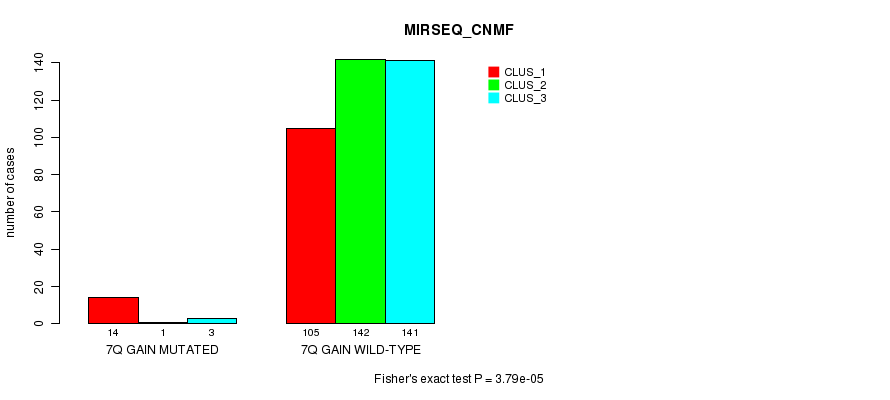
P value = 3.79e-05 (Fisher's exact test), Q value = 0.0099
Table S23. Gene #7: '7q gain mutation analysis' versus Clinical Feature #7: 'MIRSEQ_CNMF'
| nPatients | CLUS_1 | CLUS_2 | CLUS_3 |
|---|---|---|---|
| ALL | 119 | 143 | 144 |
| 7Q GAIN MUTATED | 14 | 1 | 3 |
| 7Q GAIN WILD-TYPE | 105 | 142 | 141 |
Figure S23. Get High-res Image Gene #7: '7q gain mutation analysis' versus Clinical Feature #7: 'MIRSEQ_CNMF'
P value = 9.44e-06 (Fisher's exact test), Q value = 0.0026
Table S24. Gene #7: '7q gain mutation analysis' versus Clinical Feature #8: 'MIRSEQ_CHIERARCHICAL'
| nPatients | CLUS_1 | CLUS_2 | CLUS_3 |
|---|---|---|---|
| ALL | 108 | 169 | 129 |
| 7Q GAIN MUTATED | 14 | 3 | 1 |
| 7Q GAIN WILD-TYPE | 94 | 166 | 128 |
Figure S24. Get High-res Image Gene #7: '7q gain mutation analysis' versus Clinical Feature #8: 'MIRSEQ_CHIERARCHICAL'

P value = 0.00034 (Fisher's exact test), Q value = 0.08
Table S25. Gene #9: '11q gain mutation analysis' versus Clinical Feature #1: 'CN_CNMF'
| nPatients | CLUS_1 | CLUS_2 | CLUS_3 |
|---|---|---|---|
| ALL | 35 | 330 | 65 |
| 11Q GAIN MUTATED | 3 | 0 | 1 |
| 11Q GAIN WILD-TYPE | 32 | 330 | 64 |
Figure S25. Get High-res Image Gene #9: '11q gain mutation analysis' versus Clinical Feature #1: 'CN_CNMF'

P value = 7.66e-12 (Fisher's exact test), Q value = 2.3e-09
Table S26. Gene #10: '12p gain mutation analysis' versus Clinical Feature #1: 'CN_CNMF'
| nPatients | CLUS_1 | CLUS_2 | CLUS_3 |
|---|---|---|---|
| ALL | 35 | 330 | 65 |
| 12P GAIN MUTATED | 10 | 0 | 2 |
| 12P GAIN WILD-TYPE | 25 | 330 | 63 |
Figure S26. Get High-res Image Gene #10: '12p gain mutation analysis' versus Clinical Feature #1: 'CN_CNMF'

P value = 1.68e-06 (Fisher's exact test), Q value = 0.00049
Table S27. Gene #10: '12p gain mutation analysis' versus Clinical Feature #2: 'METHLYATION_CNMF'
| nPatients | CLUS_1 | CLUS_2 | CLUS_3 |
|---|---|---|---|
| ALL | 135 | 55 | 240 |
| 12P GAIN MUTATED | 12 | 0 | 0 |
| 12P GAIN WILD-TYPE | 123 | 55 | 240 |
Figure S27. Get High-res Image Gene #10: '12p gain mutation analysis' versus Clinical Feature #2: 'METHLYATION_CNMF'

P value = 7.26e-06 (Fisher's exact test), Q value = 0.002
Table S28. Gene #10: '12p gain mutation analysis' versus Clinical Feature #5: 'MRNASEQ_CNMF'
| nPatients | CLUS_1 | CLUS_2 | CLUS_3 | CLUS_4 |
|---|---|---|---|---|
| ALL | 129 | 50 | 89 | 137 |
| 12P GAIN MUTATED | 12 | 0 | 0 | 0 |
| 12P GAIN WILD-TYPE | 117 | 50 | 89 | 137 |
Figure S28. Get High-res Image Gene #10: '12p gain mutation analysis' versus Clinical Feature #5: 'MRNASEQ_CNMF'

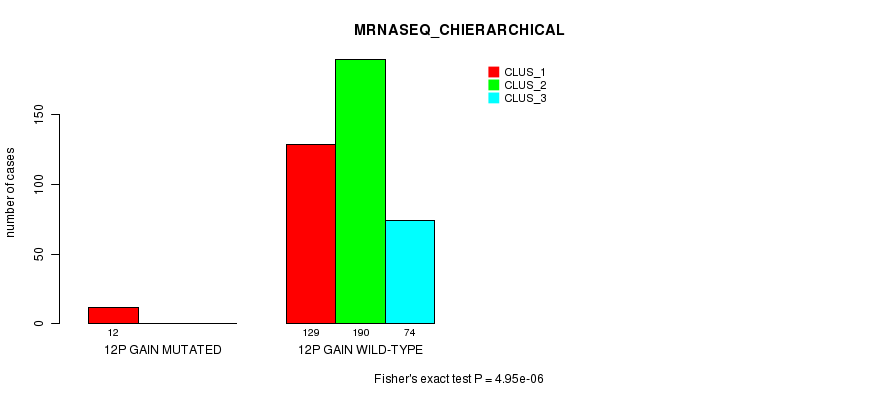
P value = 4.95e-06 (Fisher's exact test), Q value = 0.0014
Table S29. Gene #10: '12p gain mutation analysis' versus Clinical Feature #6: 'MRNASEQ_CHIERARCHICAL'
| nPatients | CLUS_1 | CLUS_2 | CLUS_3 |
|---|---|---|---|
| ALL | 141 | 190 | 74 |
| 12P GAIN MUTATED | 12 | 0 | 0 |
| 12P GAIN WILD-TYPE | 129 | 190 | 74 |
Figure S29. Get High-res Image Gene #10: '12p gain mutation analysis' versus Clinical Feature #6: 'MRNASEQ_CHIERARCHICAL'
P value = 1.44e-05 (Fisher's exact test), Q value = 0.0039
Table S30. Gene #10: '12p gain mutation analysis' versus Clinical Feature #7: 'MIRSEQ_CNMF'
| nPatients | CLUS_1 | CLUS_2 | CLUS_3 |
|---|---|---|---|
| ALL | 119 | 143 | 144 |
| 12P GAIN MUTATED | 11 | 0 | 1 |
| 12P GAIN WILD-TYPE | 108 | 143 | 143 |
Figure S30. Get High-res Image Gene #10: '12p gain mutation analysis' versus Clinical Feature #7: 'MIRSEQ_CNMF'

P value = 3.71e-06 (Fisher's exact test), Q value = 0.0011
Table S31. Gene #10: '12p gain mutation analysis' versus Clinical Feature #8: 'MIRSEQ_CHIERARCHICAL'
| nPatients | CLUS_1 | CLUS_2 | CLUS_3 |
|---|---|---|---|
| ALL | 108 | 169 | 129 |
| 12P GAIN MUTATED | 11 | 1 | 0 |
| 12P GAIN WILD-TYPE | 97 | 168 | 129 |
Figure S31. Get High-res Image Gene #10: '12p gain mutation analysis' versus Clinical Feature #8: 'MIRSEQ_CHIERARCHICAL'

P value = 7.66e-12 (Fisher's exact test), Q value = 2.3e-09
Table S32. Gene #11: '12q gain mutation analysis' versus Clinical Feature #1: 'CN_CNMF'
| nPatients | CLUS_1 | CLUS_2 | CLUS_3 |
|---|---|---|---|
| ALL | 35 | 330 | 65 |
| 12Q GAIN MUTATED | 10 | 0 | 2 |
| 12Q GAIN WILD-TYPE | 25 | 330 | 63 |
Figure S32. Get High-res Image Gene #11: '12q gain mutation analysis' versus Clinical Feature #1: 'CN_CNMF'

P value = 1.68e-06 (Fisher's exact test), Q value = 0.00049
Table S33. Gene #11: '12q gain mutation analysis' versus Clinical Feature #2: 'METHLYATION_CNMF'
| nPatients | CLUS_1 | CLUS_2 | CLUS_3 |
|---|---|---|---|
| ALL | 135 | 55 | 240 |
| 12Q GAIN MUTATED | 12 | 0 | 0 |
| 12Q GAIN WILD-TYPE | 123 | 55 | 240 |
Figure S33. Get High-res Image Gene #11: '12q gain mutation analysis' versus Clinical Feature #2: 'METHLYATION_CNMF'

P value = 7.26e-06 (Fisher's exact test), Q value = 0.002
Table S34. Gene #11: '12q gain mutation analysis' versus Clinical Feature #5: 'MRNASEQ_CNMF'
| nPatients | CLUS_1 | CLUS_2 | CLUS_3 | CLUS_4 |
|---|---|---|---|---|
| ALL | 129 | 50 | 89 | 137 |
| 12Q GAIN MUTATED | 12 | 0 | 0 | 0 |
| 12Q GAIN WILD-TYPE | 117 | 50 | 89 | 137 |
Figure S34. Get High-res Image Gene #11: '12q gain mutation analysis' versus Clinical Feature #5: 'MRNASEQ_CNMF'

P value = 4.95e-06 (Fisher's exact test), Q value = 0.0014
Table S35. Gene #11: '12q gain mutation analysis' versus Clinical Feature #6: 'MRNASEQ_CHIERARCHICAL'
| nPatients | CLUS_1 | CLUS_2 | CLUS_3 |
|---|---|---|---|
| ALL | 141 | 190 | 74 |
| 12Q GAIN MUTATED | 12 | 0 | 0 |
| 12Q GAIN WILD-TYPE | 129 | 190 | 74 |
Figure S35. Get High-res Image Gene #11: '12q gain mutation analysis' versus Clinical Feature #6: 'MRNASEQ_CHIERARCHICAL'

P value = 1.44e-05 (Fisher's exact test), Q value = 0.0039
Table S36. Gene #11: '12q gain mutation analysis' versus Clinical Feature #7: 'MIRSEQ_CNMF'
| nPatients | CLUS_1 | CLUS_2 | CLUS_3 |
|---|---|---|---|
| ALL | 119 | 143 | 144 |
| 12Q GAIN MUTATED | 11 | 0 | 1 |
| 12Q GAIN WILD-TYPE | 108 | 143 | 143 |
Figure S36. Get High-res Image Gene #11: '12q gain mutation analysis' versus Clinical Feature #7: 'MIRSEQ_CNMF'

P value = 3.71e-06 (Fisher's exact test), Q value = 0.0011
Table S37. Gene #11: '12q gain mutation analysis' versus Clinical Feature #8: 'MIRSEQ_CHIERARCHICAL'
| nPatients | CLUS_1 | CLUS_2 | CLUS_3 |
|---|---|---|---|
| ALL | 108 | 169 | 129 |
| 12Q GAIN MUTATED | 11 | 1 | 0 |
| 12Q GAIN WILD-TYPE | 97 | 168 | 129 |
Figure S37. Get High-res Image Gene #11: '12q gain mutation analysis' versus Clinical Feature #8: 'MIRSEQ_CHIERARCHICAL'
P value = 2.19e-07 (Fisher's exact test), Q value = 6.4e-05
Table S38. Gene #12: '14q gain mutation analysis' versus Clinical Feature #1: 'CN_CNMF'
| nPatients | CLUS_1 | CLUS_2 | CLUS_3 |
|---|---|---|---|
| ALL | 35 | 330 | 65 |
| 14Q GAIN MUTATED | 6 | 0 | 1 |
| 14Q GAIN WILD-TYPE | 29 | 330 | 64 |
Figure S38. Get High-res Image Gene #12: '14q gain mutation analysis' versus Clinical Feature #1: 'CN_CNMF'

P value = 0.00103 (Fisher's exact test), Q value = 0.23
Table S39. Gene #12: '14q gain mutation analysis' versus Clinical Feature #2: 'METHLYATION_CNMF'
| nPatients | CLUS_1 | CLUS_2 | CLUS_3 |
|---|---|---|---|
| ALL | 135 | 55 | 240 |
| 14Q GAIN MUTATED | 7 | 0 | 0 |
| 14Q GAIN WILD-TYPE | 128 | 55 | 240 |
Figure S39. Get High-res Image Gene #12: '14q gain mutation analysis' versus Clinical Feature #2: 'METHLYATION_CNMF'

P value = 3.91e-13 (Fisher's exact test), Q value = 1.2e-10
Table S40. Gene #13: '16p gain mutation analysis' versus Clinical Feature #1: 'CN_CNMF'
| nPatients | CLUS_1 | CLUS_2 | CLUS_3 |
|---|---|---|---|
| ALL | 35 | 330 | 65 |
| 16P GAIN MUTATED | 11 | 0 | 1 |
| 16P GAIN WILD-TYPE | 24 | 330 | 64 |
Figure S40. Get High-res Image Gene #13: '16p gain mutation analysis' versus Clinical Feature #1: 'CN_CNMF'

P value = 0.000351 (Fisher's exact test), Q value = 0.082
Table S41. Gene #13: '16p gain mutation analysis' versus Clinical Feature #2: 'METHLYATION_CNMF'
| nPatients | CLUS_1 | CLUS_2 | CLUS_3 |
|---|---|---|---|
| ALL | 135 | 55 | 240 |
| 16P GAIN MUTATED | 10 | 1 | 1 |
| 16P GAIN WILD-TYPE | 125 | 54 | 239 |
Figure S41. Get High-res Image Gene #13: '16p gain mutation analysis' versus Clinical Feature #2: 'METHLYATION_CNMF'

P value = 0.000245 (Fisher's exact test), Q value = 0.06
Table S42. Gene #13: '16p gain mutation analysis' versus Clinical Feature #5: 'MRNASEQ_CNMF'
| nPatients | CLUS_1 | CLUS_2 | CLUS_3 | CLUS_4 |
|---|---|---|---|---|
| ALL | 129 | 50 | 89 | 137 |
| 16P GAIN MUTATED | 11 | 0 | 0 | 1 |
| 16P GAIN WILD-TYPE | 118 | 50 | 89 | 136 |
Figure S42. Get High-res Image Gene #13: '16p gain mutation analysis' versus Clinical Feature #5: 'MRNASEQ_CNMF'
P value = 0.000169 (Fisher's exact test), Q value = 0.042
Table S43. Gene #13: '16p gain mutation analysis' versus Clinical Feature #6: 'MRNASEQ_CHIERARCHICAL'
| nPatients | CLUS_1 | CLUS_2 | CLUS_3 |
|---|---|---|---|
| ALL | 141 | 190 | 74 |
| 16P GAIN MUTATED | 11 | 1 | 0 |
| 16P GAIN WILD-TYPE | 130 | 189 | 74 |
Figure S43. Get High-res Image Gene #13: '16p gain mutation analysis' versus Clinical Feature #6: 'MRNASEQ_CHIERARCHICAL'

P value = 0.000105 (Fisher's exact test), Q value = 0.026
Table S44. Gene #13: '16p gain mutation analysis' versus Clinical Feature #7: 'MIRSEQ_CNMF'
| nPatients | CLUS_1 | CLUS_2 | CLUS_3 |
|---|---|---|---|
| ALL | 119 | 143 | 144 |
| 16P GAIN MUTATED | 10 | 0 | 2 |
| 16P GAIN WILD-TYPE | 109 | 143 | 142 |
Figure S44. Get High-res Image Gene #13: '16p gain mutation analysis' versus Clinical Feature #7: 'MIRSEQ_CNMF'
P value = 4.89e-05 (Fisher's exact test), Q value = 0.013
Table S45. Gene #13: '16p gain mutation analysis' versus Clinical Feature #8: 'MIRSEQ_CHIERARCHICAL'
| nPatients | CLUS_1 | CLUS_2 | CLUS_3 |
|---|---|---|---|
| ALL | 108 | 169 | 129 |
| 16P GAIN MUTATED | 10 | 2 | 0 |
| 16P GAIN WILD-TYPE | 98 | 167 | 129 |
Figure S45. Get High-res Image Gene #13: '16p gain mutation analysis' versus Clinical Feature #8: 'MIRSEQ_CHIERARCHICAL'

P value = 3.43e-12 (Fisher's exact test), Q value = 1e-09
Table S46. Gene #14: '16q gain mutation analysis' versus Clinical Feature #1: 'CN_CNMF'
| nPatients | CLUS_1 | CLUS_2 | CLUS_3 |
|---|---|---|---|
| ALL | 35 | 330 | 65 |
| 16Q GAIN MUTATED | 10 | 0 | 0 |
| 16Q GAIN WILD-TYPE | 25 | 330 | 65 |
Figure S46. Get High-res Image Gene #14: '16q gain mutation analysis' versus Clinical Feature #1: 'CN_CNMF'

P value = 0.000634 (Fisher's exact test), Q value = 0.14
Table S47. Gene #14: '16q gain mutation analysis' versus Clinical Feature #8: 'MIRSEQ_CHIERARCHICAL'
| nPatients | CLUS_1 | CLUS_2 | CLUS_3 |
|---|---|---|---|
| ALL | 108 | 169 | 129 |
| 16Q GAIN MUTATED | 8 | 2 | 0 |
| 16Q GAIN WILD-TYPE | 100 | 167 | 129 |
Figure S47. Get High-res Image Gene #14: '16q gain mutation analysis' versus Clinical Feature #8: 'MIRSEQ_CHIERARCHICAL'

P value = 1.49e-07 (Fisher's exact test), Q value = 4.4e-05
Table S48. Gene #15: '17p gain mutation analysis' versus Clinical Feature #1: 'CN_CNMF'
| nPatients | CLUS_1 | CLUS_2 | CLUS_3 |
|---|---|---|---|
| ALL | 35 | 330 | 65 |
| 17P GAIN MUTATED | 8 | 2 | 1 |
| 17P GAIN WILD-TYPE | 27 | 328 | 64 |
Figure S48. Get High-res Image Gene #15: '17p gain mutation analysis' versus Clinical Feature #1: 'CN_CNMF'

P value = 6.61e-06 (Fisher's exact test), Q value = 0.0018
Table S49. Gene #15: '17p gain mutation analysis' versus Clinical Feature #2: 'METHLYATION_CNMF'
| nPatients | CLUS_1 | CLUS_2 | CLUS_3 |
|---|---|---|---|
| ALL | 135 | 55 | 240 |
| 17P GAIN MUTATED | 11 | 0 | 0 |
| 17P GAIN WILD-TYPE | 124 | 55 | 240 |
Figure S49. Get High-res Image Gene #15: '17p gain mutation analysis' versus Clinical Feature #2: 'METHLYATION_CNMF'

P value = 1.89e-05 (Fisher's exact test), Q value = 0.0051
Table S50. Gene #15: '17p gain mutation analysis' versus Clinical Feature #5: 'MRNASEQ_CNMF'
| nPatients | CLUS_1 | CLUS_2 | CLUS_3 | CLUS_4 |
|---|---|---|---|---|
| ALL | 129 | 50 | 89 | 137 |
| 17P GAIN MUTATED | 11 | 0 | 0 | 0 |
| 17P GAIN WILD-TYPE | 118 | 50 | 89 | 137 |
Figure S50. Get High-res Image Gene #15: '17p gain mutation analysis' versus Clinical Feature #5: 'MRNASEQ_CNMF'
P value = 1.95e-05 (Fisher's exact test), Q value = 0.0053
Table S51. Gene #15: '17p gain mutation analysis' versus Clinical Feature #6: 'MRNASEQ_CHIERARCHICAL'
| nPatients | CLUS_1 | CLUS_2 | CLUS_3 |
|---|---|---|---|
| ALL | 141 | 190 | 74 |
| 17P GAIN MUTATED | 11 | 0 | 0 |
| 17P GAIN WILD-TYPE | 130 | 190 | 74 |
Figure S51. Get High-res Image Gene #15: '17p gain mutation analysis' versus Clinical Feature #6: 'MRNASEQ_CHIERARCHICAL'

P value = 4.59e-05 (Fisher's exact test), Q value = 0.012
Table S52. Gene #15: '17p gain mutation analysis' versus Clinical Feature #7: 'MIRSEQ_CNMF'
| nPatients | CLUS_1 | CLUS_2 | CLUS_3 |
|---|---|---|---|
| ALL | 119 | 143 | 144 |
| 17P GAIN MUTATED | 10 | 0 | 1 |
| 17P GAIN WILD-TYPE | 109 | 143 | 143 |
Figure S52. Get High-res Image Gene #15: '17p gain mutation analysis' versus Clinical Feature #7: 'MIRSEQ_CNMF'

P value = 1.35e-05 (Fisher's exact test), Q value = 0.0037
Table S53. Gene #15: '17p gain mutation analysis' versus Clinical Feature #8: 'MIRSEQ_CHIERARCHICAL'
| nPatients | CLUS_1 | CLUS_2 | CLUS_3 |
|---|---|---|---|
| ALL | 108 | 169 | 129 |
| 17P GAIN MUTATED | 10 | 1 | 0 |
| 17P GAIN WILD-TYPE | 98 | 168 | 129 |
Figure S53. Get High-res Image Gene #15: '17p gain mutation analysis' versus Clinical Feature #8: 'MIRSEQ_CHIERARCHICAL'

P value = 1.21e-07 (Fisher's exact test), Q value = 3.6e-05
Table S54. Gene #16: '17q gain mutation analysis' versus Clinical Feature #1: 'CN_CNMF'
| nPatients | CLUS_1 | CLUS_2 | CLUS_3 |
|---|---|---|---|
| ALL | 35 | 330 | 65 |
| 17Q GAIN MUTATED | 8 | 2 | 2 |
| 17Q GAIN WILD-TYPE | 27 | 328 | 63 |
Figure S54. Get High-res Image Gene #16: '17q gain mutation analysis' versus Clinical Feature #1: 'CN_CNMF'

P value = 1.68e-06 (Fisher's exact test), Q value = 0.00049
Table S55. Gene #16: '17q gain mutation analysis' versus Clinical Feature #2: 'METHLYATION_CNMF'
| nPatients | CLUS_1 | CLUS_2 | CLUS_3 |
|---|---|---|---|
| ALL | 135 | 55 | 240 |
| 17Q GAIN MUTATED | 12 | 0 | 0 |
| 17Q GAIN WILD-TYPE | 123 | 55 | 240 |
Figure S55. Get High-res Image Gene #16: '17q gain mutation analysis' versus Clinical Feature #2: 'METHLYATION_CNMF'

P value = 7.26e-06 (Fisher's exact test), Q value = 0.002
Table S56. Gene #16: '17q gain mutation analysis' versus Clinical Feature #5: 'MRNASEQ_CNMF'
| nPatients | CLUS_1 | CLUS_2 | CLUS_3 | CLUS_4 |
|---|---|---|---|---|
| ALL | 129 | 50 | 89 | 137 |
| 17Q GAIN MUTATED | 12 | 0 | 0 | 0 |
| 17Q GAIN WILD-TYPE | 117 | 50 | 89 | 137 |
Figure S56. Get High-res Image Gene #16: '17q gain mutation analysis' versus Clinical Feature #5: 'MRNASEQ_CNMF'

P value = 4.95e-06 (Fisher's exact test), Q value = 0.0014
Table S57. Gene #16: '17q gain mutation analysis' versus Clinical Feature #6: 'MRNASEQ_CHIERARCHICAL'
| nPatients | CLUS_1 | CLUS_2 | CLUS_3 |
|---|---|---|---|
| ALL | 141 | 190 | 74 |
| 17Q GAIN MUTATED | 12 | 0 | 0 |
| 17Q GAIN WILD-TYPE | 129 | 190 | 74 |
Figure S57. Get High-res Image Gene #16: '17q gain mutation analysis' versus Clinical Feature #6: 'MRNASEQ_CHIERARCHICAL'

P value = 1.44e-05 (Fisher's exact test), Q value = 0.0039
Table S58. Gene #16: '17q gain mutation analysis' versus Clinical Feature #7: 'MIRSEQ_CNMF'
| nPatients | CLUS_1 | CLUS_2 | CLUS_3 |
|---|---|---|---|
| ALL | 119 | 143 | 144 |
| 17Q GAIN MUTATED | 11 | 0 | 1 |
| 17Q GAIN WILD-TYPE | 108 | 143 | 143 |
Figure S58. Get High-res Image Gene #16: '17q gain mutation analysis' versus Clinical Feature #7: 'MIRSEQ_CNMF'

P value = 3.71e-06 (Fisher's exact test), Q value = 0.0011
Table S59. Gene #16: '17q gain mutation analysis' versus Clinical Feature #8: 'MIRSEQ_CHIERARCHICAL'
| nPatients | CLUS_1 | CLUS_2 | CLUS_3 |
|---|---|---|---|
| ALL | 108 | 169 | 129 |
| 17Q GAIN MUTATED | 11 | 1 | 0 |
| 17Q GAIN WILD-TYPE | 97 | 168 | 129 |
Figure S59. Get High-res Image Gene #16: '17q gain mutation analysis' versus Clinical Feature #8: 'MIRSEQ_CHIERARCHICAL'

P value = 0.000497 (Fisher's exact test), Q value = 0.12
Table S60. Gene #17: '19p gain mutation analysis' versus Clinical Feature #1: 'CN_CNMF'
| nPatients | CLUS_1 | CLUS_2 | CLUS_3 |
|---|---|---|---|
| ALL | 35 | 330 | 65 |
| 19P GAIN MUTATED | 3 | 0 | 0 |
| 19P GAIN WILD-TYPE | 32 | 330 | 65 |
Figure S60. Get High-res Image Gene #17: '19p gain mutation analysis' versus Clinical Feature #1: 'CN_CNMF'
P value = 3.73e-05 (Fisher's exact test), Q value = 0.0099
Table S61. Gene #18: '19q gain mutation analysis' versus Clinical Feature #1: 'CN_CNMF'
| nPatients | CLUS_1 | CLUS_2 | CLUS_3 |
|---|---|---|---|
| ALL | 35 | 330 | 65 |
| 19Q GAIN MUTATED | 4 | 0 | 0 |
| 19Q GAIN WILD-TYPE | 31 | 330 | 65 |
Figure S61. Get High-res Image Gene #18: '19q gain mutation analysis' versus Clinical Feature #1: 'CN_CNMF'
P value = 8.67e-10 (Fisher's exact test), Q value = 2.6e-07
Table S62. Gene #19: '20p gain mutation analysis' versus Clinical Feature #1: 'CN_CNMF'
| nPatients | CLUS_1 | CLUS_2 | CLUS_3 |
|---|---|---|---|
| ALL | 35 | 330 | 65 |
| 20P GAIN MUTATED | 8 | 0 | 0 |
| 20P GAIN WILD-TYPE | 27 | 330 | 65 |
Figure S62. Get High-res Image Gene #19: '20p gain mutation analysis' versus Clinical Feature #1: 'CN_CNMF'

P value = 8.67e-10 (Fisher's exact test), Q value = 2.6e-07
Table S63. Gene #20: '20q gain mutation analysis' versus Clinical Feature #1: 'CN_CNMF'
| nPatients | CLUS_1 | CLUS_2 | CLUS_3 |
|---|---|---|---|
| ALL | 35 | 330 | 65 |
| 20Q GAIN MUTATED | 8 | 0 | 0 |
| 20Q GAIN WILD-TYPE | 27 | 330 | 65 |
Figure S63. Get High-res Image Gene #20: '20q gain mutation analysis' versus Clinical Feature #1: 'CN_CNMF'

P value = 0.000497 (Fisher's exact test), Q value = 0.12
Table S64. Gene #22: '1p loss mutation analysis' versus Clinical Feature #1: 'CN_CNMF'
| nPatients | CLUS_1 | CLUS_2 | CLUS_3 |
|---|---|---|---|
| ALL | 35 | 330 | 65 |
| 1P LOSS MUTATED | 3 | 0 | 0 |
| 1P LOSS WILD-TYPE | 32 | 330 | 65 |
Figure S64. Get High-res Image Gene #22: '1p loss mutation analysis' versus Clinical Feature #1: 'CN_CNMF'

P value = 1.7e-08 (Fisher's exact test), Q value = 5e-06
Table S65. Gene #23: '2p loss mutation analysis' versus Clinical Feature #1: 'CN_CNMF'
| nPatients | CLUS_1 | CLUS_2 | CLUS_3 |
|---|---|---|---|
| ALL | 35 | 330 | 65 |
| 2P LOSS MUTATED | 7 | 0 | 1 |
| 2P LOSS WILD-TYPE | 28 | 330 | 64 |
Figure S65. Get High-res Image Gene #23: '2p loss mutation analysis' versus Clinical Feature #1: 'CN_CNMF'

P value = 0.000211 (Fisher's exact test), Q value = 0.051
Table S66. Gene #23: '2p loss mutation analysis' versus Clinical Feature #2: 'METHLYATION_CNMF'
| nPatients | CLUS_1 | CLUS_2 | CLUS_3 |
|---|---|---|---|
| ALL | 135 | 55 | 240 |
| 2P LOSS MUTATED | 8 | 0 | 0 |
| 2P LOSS WILD-TYPE | 127 | 55 | 240 |
Figure S66. Get High-res Image Gene #23: '2p loss mutation analysis' versus Clinical Feature #2: 'METHLYATION_CNMF'
P value = 0.000655 (Fisher's exact test), Q value = 0.15
Table S67. Gene #23: '2p loss mutation analysis' versus Clinical Feature #5: 'MRNASEQ_CNMF'
| nPatients | CLUS_1 | CLUS_2 | CLUS_3 | CLUS_4 |
|---|---|---|---|---|
| ALL | 129 | 50 | 89 | 137 |
| 2P LOSS MUTATED | 8 | 0 | 0 | 0 |
| 2P LOSS WILD-TYPE | 121 | 50 | 89 | 137 |
Figure S67. Get High-res Image Gene #23: '2p loss mutation analysis' versus Clinical Feature #5: 'MRNASEQ_CNMF'
P value = 0.000335 (Fisher's exact test), Q value = 0.079
Table S68. Gene #23: '2p loss mutation analysis' versus Clinical Feature #6: 'MRNASEQ_CHIERARCHICAL'
| nPatients | CLUS_1 | CLUS_2 | CLUS_3 |
|---|---|---|---|
| ALL | 141 | 190 | 74 |
| 2P LOSS MUTATED | 8 | 0 | 0 |
| 2P LOSS WILD-TYPE | 133 | 190 | 74 |
Figure S68. Get High-res Image Gene #23: '2p loss mutation analysis' versus Clinical Feature #6: 'MRNASEQ_CHIERARCHICAL'

P value = 4.59e-05 (Fisher's exact test), Q value = 0.012
Table S69. Gene #23: '2p loss mutation analysis' versus Clinical Feature #7: 'MIRSEQ_CNMF'
| nPatients | CLUS_1 | CLUS_2 | CLUS_3 |
|---|---|---|---|
| ALL | 119 | 143 | 144 |
| 2P LOSS MUTATED | 8 | 0 | 0 |
| 2P LOSS WILD-TYPE | 111 | 143 | 144 |
Figure S69. Get High-res Image Gene #23: '2p loss mutation analysis' versus Clinical Feature #7: 'MIRSEQ_CNMF'

P value = 2.06e-05 (Fisher's exact test), Q value = 0.0055
Table S70. Gene #23: '2p loss mutation analysis' versus Clinical Feature #8: 'MIRSEQ_CHIERARCHICAL'
| nPatients | CLUS_1 | CLUS_2 | CLUS_3 |
|---|---|---|---|
| ALL | 108 | 169 | 129 |
| 2P LOSS MUTATED | 8 | 0 | 0 |
| 2P LOSS WILD-TYPE | 100 | 169 | 129 |
Figure S70. Get High-res Image Gene #23: '2p loss mutation analysis' versus Clinical Feature #8: 'MIRSEQ_CHIERARCHICAL'
P value = 1.31e-08 (Fisher's exact test), Q value = 3.9e-06
Table S71. Gene #24: '2q loss mutation analysis' versus Clinical Feature #1: 'CN_CNMF'
| nPatients | CLUS_1 | CLUS_2 | CLUS_3 |
|---|---|---|---|
| ALL | 35 | 330 | 65 |
| 2Q LOSS MUTATED | 7 | 0 | 0 |
| 2Q LOSS WILD-TYPE | 28 | 330 | 65 |
Figure S71. Get High-res Image Gene #24: '2q loss mutation analysis' versus Clinical Feature #1: 'CN_CNMF'

P value = 0.00103 (Fisher's exact test), Q value = 0.23
Table S72. Gene #24: '2q loss mutation analysis' versus Clinical Feature #2: 'METHLYATION_CNMF'
| nPatients | CLUS_1 | CLUS_2 | CLUS_3 |
|---|---|---|---|
| ALL | 135 | 55 | 240 |
| 2Q LOSS MUTATED | 7 | 0 | 0 |
| 2Q LOSS WILD-TYPE | 128 | 55 | 240 |
Figure S72. Get High-res Image Gene #24: '2q loss mutation analysis' versus Clinical Feature #2: 'METHLYATION_CNMF'

P value = 0.000164 (Fisher's exact test), Q value = 0.041
Table S73. Gene #24: '2q loss mutation analysis' versus Clinical Feature #7: 'MIRSEQ_CNMF'
| nPatients | CLUS_1 | CLUS_2 | CLUS_3 |
|---|---|---|---|
| ALL | 119 | 143 | 144 |
| 2Q LOSS MUTATED | 7 | 0 | 0 |
| 2Q LOSS WILD-TYPE | 112 | 143 | 144 |
Figure S73. Get High-res Image Gene #24: '2q loss mutation analysis' versus Clinical Feature #7: 'MIRSEQ_CNMF'

P value = 8.14e-05 (Fisher's exact test), Q value = 0.021
Table S74. Gene #24: '2q loss mutation analysis' versus Clinical Feature #8: 'MIRSEQ_CHIERARCHICAL'
| nPatients | CLUS_1 | CLUS_2 | CLUS_3 |
|---|---|---|---|
| ALL | 108 | 169 | 129 |
| 2Q LOSS MUTATED | 7 | 0 | 0 |
| 2Q LOSS WILD-TYPE | 101 | 169 | 129 |
Figure S74. Get High-res Image Gene #24: '2q loss mutation analysis' versus Clinical Feature #8: 'MIRSEQ_CHIERARCHICAL'
P value = 0.000497 (Fisher's exact test), Q value = 0.12
Table S75. Gene #25: '3q loss mutation analysis' versus Clinical Feature #1: 'CN_CNMF'
| nPatients | CLUS_1 | CLUS_2 | CLUS_3 |
|---|---|---|---|
| ALL | 35 | 330 | 65 |
| 3Q LOSS MUTATED | 3 | 0 | 0 |
| 3Q LOSS WILD-TYPE | 32 | 330 | 65 |
Figure S75. Get High-res Image Gene #25: '3q loss mutation analysis' versus Clinical Feature #1: 'CN_CNMF'

P value = 3.73e-05 (Fisher's exact test), Q value = 0.0099
Table S76. Gene #27: '8p loss mutation analysis' versus Clinical Feature #1: 'CN_CNMF'
| nPatients | CLUS_1 | CLUS_2 | CLUS_3 |
|---|---|---|---|
| ALL | 35 | 330 | 65 |
| 8P LOSS MUTATED | 4 | 0 | 0 |
| 8P LOSS WILD-TYPE | 31 | 330 | 65 |
Figure S76. Get High-res Image Gene #27: '8p loss mutation analysis' versus Clinical Feature #1: 'CN_CNMF'

P value = 3.73e-05 (Fisher's exact test), Q value = 0.0099
Table S77. Gene #28: '8q loss mutation analysis' versus Clinical Feature #1: 'CN_CNMF'
| nPatients | CLUS_1 | CLUS_2 | CLUS_3 |
|---|---|---|---|
| ALL | 35 | 330 | 65 |
| 8Q LOSS MUTATED | 4 | 0 | 0 |
| 8Q LOSS WILD-TYPE | 31 | 330 | 65 |
Figure S77. Get High-res Image Gene #28: '8q loss mutation analysis' versus Clinical Feature #1: 'CN_CNMF'

P value = 5.24e-10 (Fisher's exact test), Q value = 1.6e-07
Table S78. Gene #29: '9p loss mutation analysis' versus Clinical Feature #1: 'CN_CNMF'
| nPatients | CLUS_1 | CLUS_2 | CLUS_3 |
|---|---|---|---|
| ALL | 35 | 330 | 65 |
| 9P LOSS MUTATED | 9 | 1 | 0 |
| 9P LOSS WILD-TYPE | 26 | 329 | 65 |
Figure S78. Get High-res Image Gene #29: '9p loss mutation analysis' versus Clinical Feature #1: 'CN_CNMF'
P value = 1.46e-10 (Fisher's exact test), Q value = 4.4e-08
Table S79. Gene #30: '9q loss mutation analysis' versus Clinical Feature #1: 'CN_CNMF'
| nPatients | CLUS_1 | CLUS_2 | CLUS_3 |
|---|---|---|---|
| ALL | 35 | 330 | 65 |
| 9Q LOSS MUTATED | 11 | 3 | 0 |
| 9Q LOSS WILD-TYPE | 24 | 327 | 65 |
Figure S79. Get High-res Image Gene #30: '9q loss mutation analysis' versus Clinical Feature #1: 'CN_CNMF'

P value = 3.73e-05 (Fisher's exact test), Q value = 0.0099
Table S80. Gene #31: '10p loss mutation analysis' versus Clinical Feature #1: 'CN_CNMF'
| nPatients | CLUS_1 | CLUS_2 | CLUS_3 |
|---|---|---|---|
| ALL | 35 | 330 | 65 |
| 10P LOSS MUTATED | 4 | 0 | 0 |
| 10P LOSS WILD-TYPE | 31 | 330 | 65 |
Figure S80. Get High-res Image Gene #31: '10p loss mutation analysis' versus Clinical Feature #1: 'CN_CNMF'

P value = 3.73e-05 (Fisher's exact test), Q value = 0.0099
Table S81. Gene #32: '10q loss mutation analysis' versus Clinical Feature #1: 'CN_CNMF'
| nPatients | CLUS_1 | CLUS_2 | CLUS_3 |
|---|---|---|---|
| ALL | 35 | 330 | 65 |
| 10Q LOSS MUTATED | 4 | 0 | 0 |
| 10Q LOSS WILD-TYPE | 31 | 330 | 65 |
Figure S81. Get High-res Image Gene #32: '10q loss mutation analysis' versus Clinical Feature #1: 'CN_CNMF'

P value = 2.71e-06 (Fisher's exact test), Q value = 0.00078
Table S82. Gene #33: '11p loss mutation analysis' versus Clinical Feature #1: 'CN_CNMF'
| nPatients | CLUS_1 | CLUS_2 | CLUS_3 |
|---|---|---|---|
| ALL | 35 | 330 | 65 |
| 11P LOSS MUTATED | 5 | 0 | 0 |
| 11P LOSS WILD-TYPE | 30 | 330 | 65 |
Figure S82. Get High-res Image Gene #33: '11p loss mutation analysis' versus Clinical Feature #1: 'CN_CNMF'

P value = 2.51e-05 (Fisher's exact test), Q value = 0.0067
Table S83. Gene #34: '11q loss mutation analysis' versus Clinical Feature #1: 'CN_CNMF'
| nPatients | CLUS_1 | CLUS_2 | CLUS_3 |
|---|---|---|---|
| ALL | 35 | 330 | 65 |
| 11Q LOSS MUTATED | 5 | 1 | 0 |
| 11Q LOSS WILD-TYPE | 30 | 329 | 65 |
Figure S83. Get High-res Image Gene #34: '11q loss mutation analysis' versus Clinical Feature #1: 'CN_CNMF'

P value = 0.000943 (Fisher's exact test), Q value = 0.21
Table S84. Gene #36: '15q loss mutation analysis' versus Clinical Feature #1: 'CN_CNMF'
| nPatients | CLUS_1 | CLUS_2 | CLUS_3 |
|---|---|---|---|
| ALL | 35 | 330 | 65 |
| 15Q LOSS MUTATED | 4 | 2 | 0 |
| 15Q LOSS WILD-TYPE | 31 | 328 | 65 |
Figure S84. Get High-res Image Gene #36: '15q loss mutation analysis' versus Clinical Feature #1: 'CN_CNMF'
P value = 0.000579 (Fisher's exact test), Q value = 0.13
Table S85. Gene #36: '15q loss mutation analysis' versus Clinical Feature #7: 'MIRSEQ_CNMF'
| nPatients | CLUS_1 | CLUS_2 | CLUS_3 |
|---|---|---|---|
| ALL | 119 | 143 | 144 |
| 15Q LOSS MUTATED | 6 | 0 | 0 |
| 15Q LOSS WILD-TYPE | 113 | 143 | 144 |
Figure S85. Get High-res Image Gene #36: '15q loss mutation analysis' versus Clinical Feature #7: 'MIRSEQ_CNMF'

P value = 0.000319 (Fisher's exact test), Q value = 0.076
Table S86. Gene #36: '15q loss mutation analysis' versus Clinical Feature #8: 'MIRSEQ_CHIERARCHICAL'
| nPatients | CLUS_1 | CLUS_2 | CLUS_3 |
|---|---|---|---|
| ALL | 108 | 169 | 129 |
| 15Q LOSS MUTATED | 6 | 0 | 0 |
| 15Q LOSS WILD-TYPE | 102 | 169 | 129 |
Figure S86. Get High-res Image Gene #36: '15q loss mutation analysis' versus Clinical Feature #8: 'MIRSEQ_CHIERARCHICAL'

P value = 0.00034 (Fisher's exact test), Q value = 0.08
Table S87. Gene #38: '18p loss mutation analysis' versus Clinical Feature #1: 'CN_CNMF'
| nPatients | CLUS_1 | CLUS_2 | CLUS_3 |
|---|---|---|---|
| ALL | 35 | 330 | 65 |
| 18P LOSS MUTATED | 3 | 0 | 1 |
| 18P LOSS WILD-TYPE | 32 | 330 | 64 |
Figure S87. Get High-res Image Gene #38: '18p loss mutation analysis' versus Clinical Feature #1: 'CN_CNMF'

P value = 0.00034 (Fisher's exact test), Q value = 0.08
Table S88. Gene #39: '18q loss mutation analysis' versus Clinical Feature #1: 'CN_CNMF'
| nPatients | CLUS_1 | CLUS_2 | CLUS_3 |
|---|---|---|---|
| ALL | 35 | 330 | 65 |
| 18Q LOSS MUTATED | 3 | 0 | 1 |
| 18Q LOSS WILD-TYPE | 32 | 330 | 64 |
Figure S88. Get High-res Image Gene #39: '18q loss mutation analysis' versus Clinical Feature #1: 'CN_CNMF'

P value = 3.11e-05 (Fisher's exact test), Q value = 0.0083
Table S89. Gene #41: '21q loss mutation analysis' versus Clinical Feature #1: 'CN_CNMF'
| nPatients | CLUS_1 | CLUS_2 | CLUS_3 |
|---|---|---|---|
| ALL | 35 | 330 | 65 |
| 21Q LOSS MUTATED | 4 | 0 | 1 |
| 21Q LOSS WILD-TYPE | 31 | 330 | 64 |
Figure S89. Get High-res Image Gene #41: '21q loss mutation analysis' versus Clinical Feature #1: 'CN_CNMF'

P value = 3.28e-45 (Fisher's exact test), Q value = 1e-42
Table S90. Gene #42: '22q loss mutation analysis' versus Clinical Feature #1: 'CN_CNMF'
| nPatients | CLUS_1 | CLUS_2 | CLUS_3 |
|---|---|---|---|
| ALL | 35 | 330 | 65 |
| 22Q LOSS MUTATED | 9 | 0 | 45 |
| 22Q LOSS WILD-TYPE | 26 | 330 | 20 |
Figure S90. Get High-res Image Gene #42: '22q loss mutation analysis' versus Clinical Feature #1: 'CN_CNMF'

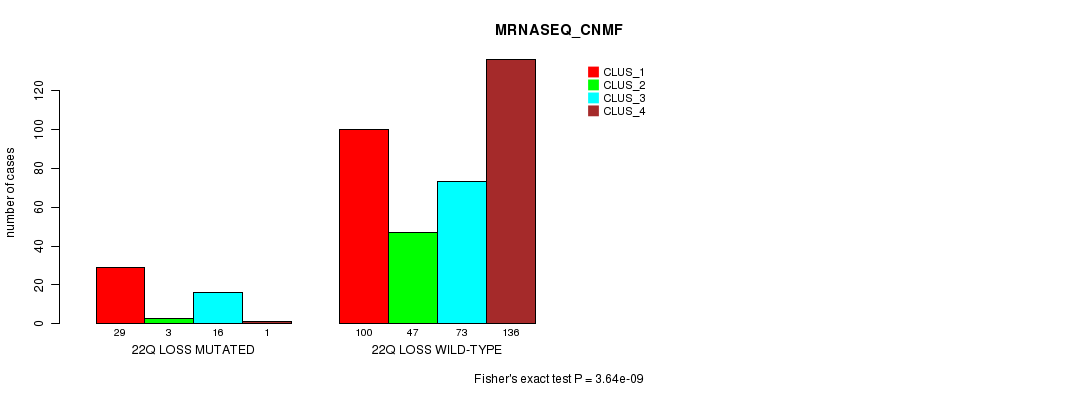
P value = 3.64e-09 (Fisher's exact test), Q value = 1.1e-06
Table S91. Gene #42: '22q loss mutation analysis' versus Clinical Feature #5: 'MRNASEQ_CNMF'
| nPatients | CLUS_1 | CLUS_2 | CLUS_3 | CLUS_4 |
|---|---|---|---|---|
| ALL | 129 | 50 | 89 | 137 |
| 22Q LOSS MUTATED | 29 | 3 | 16 | 1 |
| 22Q LOSS WILD-TYPE | 100 | 47 | 73 | 136 |
Figure S91. Get High-res Image Gene #42: '22q loss mutation analysis' versus Clinical Feature #5: 'MRNASEQ_CNMF'
P value = 2.17e-07 (Fisher's exact test), Q value = 6.3e-05
Table S92. Gene #42: '22q loss mutation analysis' versus Clinical Feature #6: 'MRNASEQ_CHIERARCHICAL'
| nPatients | CLUS_1 | CLUS_2 | CLUS_3 |
|---|---|---|---|
| ALL | 141 | 190 | 74 |
| 22Q LOSS MUTATED | 29 | 6 | 14 |
| 22Q LOSS WILD-TYPE | 112 | 184 | 60 |
Figure S92. Get High-res Image Gene #42: '22q loss mutation analysis' versus Clinical Feature #6: 'MRNASEQ_CHIERARCHICAL'

P value = 0.000267 (Fisher's exact test), Q value = 0.064
Table S93. Gene #42: '22q loss mutation analysis' versus Clinical Feature #7: 'MIRSEQ_CNMF'
| nPatients | CLUS_1 | CLUS_2 | CLUS_3 |
|---|---|---|---|
| ALL | 119 | 143 | 144 |
| 22Q LOSS MUTATED | 28 | 14 | 10 |
| 22Q LOSS WILD-TYPE | 91 | 129 | 134 |
Figure S93. Get High-res Image Gene #42: '22q loss mutation analysis' versus Clinical Feature #7: 'MIRSEQ_CNMF'

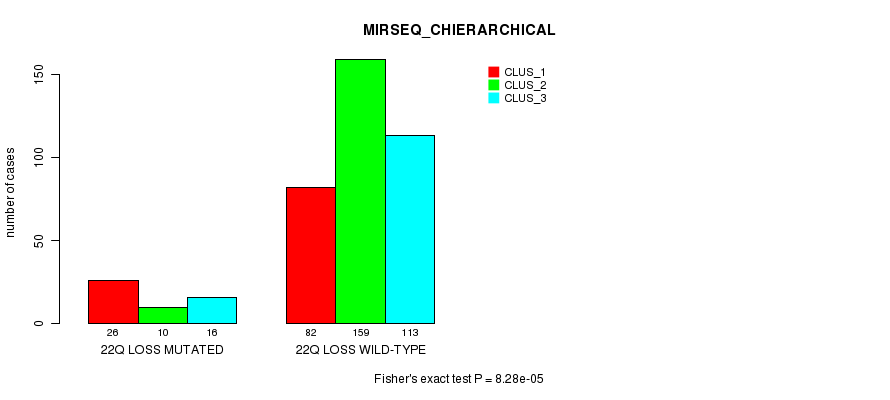
P value = 8.28e-05 (Fisher's exact test), Q value = 0.021
Table S94. Gene #42: '22q loss mutation analysis' versus Clinical Feature #8: 'MIRSEQ_CHIERARCHICAL'
| nPatients | CLUS_1 | CLUS_2 | CLUS_3 |
|---|---|---|---|
| ALL | 108 | 169 | 129 |
| 22Q LOSS MUTATED | 26 | 10 | 16 |
| 22Q LOSS WILD-TYPE | 82 | 159 | 113 |
Figure S94. Get High-res Image Gene #42: '22q loss mutation analysis' versus Clinical Feature #8: 'MIRSEQ_CHIERARCHICAL'
-
Mutation data file = broad_values_by_arm.mutsig.cluster.txt
-
Molecular subtypes file = THCA-TP.transferedmergedcluster.txt
-
Number of patients = 430
-
Number of significantly arm-level cnvs = 42
-
Number of molecular subtypes = 8
-
Exclude genes that fewer than K tumors have mutations, K = 3
For binary or multi-class clinical features (nominal or ordinal), two-tailed Fisher's exact tests (Fisher 1922) were used to estimate the P values using the 'fisher.test' function in R
For multiple hypothesis correction, Q value is the False Discovery Rate (FDR) analogue of the P value (Benjamini and Hochberg 1995), defined as the minimum FDR at which the test may be called significant. We used the 'Benjamini and Hochberg' method of 'p.adjust' function in R to convert P values into Q values.
This is an experimental feature. The full results of the analysis summarized in this report can be downloaded from the TCGA Data Coordination Center.